80 Huntington #624 · Huntington Beach, CA
Flood risk No data
- FEMA flood zone
- —
- Chance of flooding over 30 yrs
- —
- Est. flood insurance / yr
- —
Fire risk No data
- Est. fire insurance / yr
- —
Heat risk No data
- Hot days now (above threshold)
- —
- Hot days in 30 yrs
- —
Wind risk No data
- Chance of severe wind over 30 yrs
- —
Air-quality risk No data
- Unhealthy air days now
- —
- Unhealthy air days in 30 yrs
- —
Risk factors via First Street. Map © Google.
Why this score? — see what drove the B- grade
The composite is a weighted blend of 9 inputs, each scored 0–100. Each bar is that input's sub-score; the figure is the points it added to the 100-point composite (weight × sub-score).
- Cash flow +30.0/30.0
- 1% rule +10.0/10.0
- DSCR +10.0/10.0
- Schools +6.5/10.0
- Livability +3.4/5.0
- Rent growth +3.2/5.0
- Condition / age +2.5/5.0
- ARV discount +0.0/15.0
- Appreciation +0.0/10.0
$280,000
🖨 Deal sheet (PDF) 📄 Offer letter ✓ Due diligence
Listing remarks
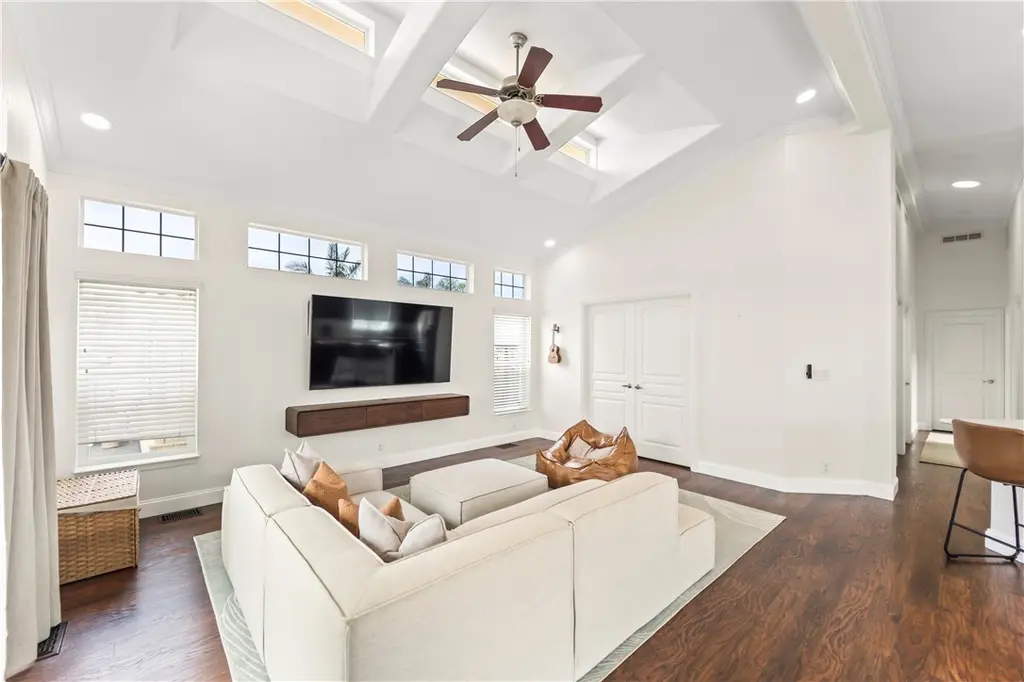
Who say’s “You can’t have it all” LUXURY and AFFORDABILITY! Beautiful, upgraded and comfortable move in ready home is just steps from the lifestyle you came for. Picture this, step inside your home in Huntington Beach and your the day instantly feels lighter, bright, coastal, and effortlessly comfortable. The kind of place where you can picture your morning coffee with the ocean not far away, an easy drive or walk into the heart of the city, and evenings that don’t feel far from the action. This is a rare opportunity to experience the Huntington Beach lifestyle without the luxury price tag. You’re close to the ocean, surrounded by the energy of the area,
Key facts
- Move in ready home
- Upgraded home
- Corner home
Tags
Property features AI
Finance
- Financial info: Land lease of $3,450 per month (park-managed)
- HOA & community: Community pool, clubhouse, and spa; Street lighting and sidewalks
Exterior
- Parking: Located in Surf City Beach Cottages park
- Utilities: Public sewer; District/public water; Cable available; Electricity available
- Home design: Single-story; Entry on main level; Mobile home remains on site
- Construction: Year built per assessor; Mobile dimensions approximately 25' x 110'
- Exterior features: Deck; In-ground community pool (gunite, electrically heated); Community spa; Corner lot
Interior
- Kitchen: Kitchen open to family room; Kitchen island; Gas cooktop; Gas range; Refrigerator; Dishwasher; Vented exhaust fan; Gas water heater
- Bedrooms: Primary bedroom; All bedrooms on one level
- Bathrooms: 2 full bathrooms; Main-floor full bath
- Heating & cooling: Forced air heating; Central cooling
- Interior features: Quartz countertops; High ceilings (9 feet+); Living room deck attached; Recessed lighting; Open floor plan; In-ground community heated gunite spa
- Laundry & utility: In-unit laundry in a dedicated room; Utility room
Neighborhood map
What this means for you Summary
Snapshot
- This is a 3-bed/2.0-bath manufactured listed at $280k.
Deal economics
- At list price, monthly cash flow is $2k ($27k/yr) — positive.
- The deal already cash-flows at list — no discount required.
- Meets the 1% rule at list price ($5k rent vs $280k).
- Recommended offer: $272k (3.0% below list) — sets the bar for market timing.
- Cap rate 16.1% vs local median 1.6% in Huntington Beach — top-decile yield for the area; either an underpriced asset or a hidden risk that comps aren't pricing in. Stress-test before assuming the spread holds.
Location & tenants
- Location reads 67/100 on livability (#306 in CA) — a middle-class / working-renter tenant base. Strengths: employment A+, commute A-; Watch: amenities C-, cost of living F, health & safety F.
- Huntington Beach Union High (suburban): math 65% / reading 82% proficiency, ranked #39 of 517 in CA (top 8%) — strong family-tenant draw, lease renewals of 3-5y typical.
- Zoned schools: John R. Peterson Elementary (489 students, 43% FRL); Ethel Dwyer Middle (995 students, 27% FRL); Huntington Beach High (math 72% / reading 87%, grade A-, #45 of 1,170 statewide, top 4%, 2,807 students, 32% FRL).
- Market conditions: Rents rising (+2.8%/yr); 137 active listings in the ZIP; 40 comparable units currently listed for rent nearby; rentals leasing fast (median 0d on market — plan ~1-2 weeks tenant-placement turnaround); high-income renter base; 6,974 units permitted in Orange County in 2024 (3,839 in 5+ unit buildings).
- At $4,957/mo this rent would consume 46% of the median local household income ($130k/yr) (locally 2957% of renters already pay >50% of income on rent) — very limited rent-growth headroom before tenants either downsize or default.
Forward outlook
- Local home prices are declining (-3.0%/yr); year-one equity from $2k of loan paydown is wiped out by about $8k of value loss. Plan a longer hold.
- Orange County population projected at +14% by 2050 — modest demand growth; plan on rents tracking national, not racing it.
- At projected returns (-3.0% appreciation + 2.8% rent growth), your $78k cash investment doubles in ~4 years — after that, you're playing with house money.
Negotiation context
- It's been on market 35 days — a 3% lower offer ($272k) is reasonable based on typical stale-listing flexibility.
- 5 sale attempts since 3y ago with the ask held roughly flat each time — persistent listings suggest the price (not the market) is what's stuck; bring a comps-based counter.
Questions for the listing agent
- It's been on market 35 days. Have you received any prior offers? Is the seller open to a 3% concession, seller financing, or rate buy-down credit?
- Is there a deadline driving the sale (1031 exchange, divorce, estate, relocation)? That informs how much negotiation room exists.
- Schools are B-rated — typically a magnet for longer-tenancy family renters. What's the average tenant stay here, and is there a school-zone premium baked into asking?
- What's the average days-on-market for RENTAL listings here right now (not sales)? A rising rental-DOM trend means longer vacancies and softer asking-rent achievability than the comps imply.
- What's the recent tenant-quality profile in this submarket — average credit score on applications, eviction rate, late-payment / NSF rate, and stable-employment percentage? A property-management company in the area should have these aggregated.
- How much new for-sale + rental construction is in the pipeline within 1–3 miles? Heavy new supply typically softens prices + rents 12–24 months out; constrained supply supports both.
Investment metrics
- 1% rule
- 1.77% ✓
- Cap rate
- 16.07%
- Cash-on-cash
- 34.92%
- DSCR
- 2.55
- GRM
- 4.7
CMA / ARV
- ARV (on-the-fly)
- $210,250
- Comps found
- 12
Show comp detail 12 sales within ~0.75 mi
| Address | Dist | Beds/Ba | Sqft | Sold | Price | $/sf | Match |
|---|---|---|---|---|---|---|---|
| 80 Huntington St #708 | 0.04mi | 3/2.0 | 1,550 (+7%) | 10mo | $280,000 | $181 | 78 |
| 80 Huntington #630 | 0.03mi | 3/2.0 | 1,251 (-14%) | 2mo | $295,000 | $236 | 74 |
| 80 Huntington #372 | 0.03mi | 2/2.0 (-1) | 1,272 (-12%) | 7mo | $73,000 | $57 | 68 |
| 20701 Beach Blvd #220 | 0.50mi | 3/3.0 | 1,500 (+3%) | 2mo | $275,000 | $183 | 65 |
| 20701 Beach Blvd #55 | 0.43mi | 3/2.0 | 1,566 (+8%) | 2mo | $255,000 | $163 | 65 |
| 20701 Beach Blvd #251 | 0.34mi | 2/2.0 (-1) | 1,334 (-8%) | 7mo | $193,500 | $145 | 60 |
| 20701 beach Blvd #168 | 0.47mi | 3/2.0 | 1,620 (+12%) | 1mo | $150,000 | $93 | 58 |
| 20701 Beach Blvd #36 | 0.43mi | 3/2.0 | 1,344 (-7%) | 12mo | $192,000 | $143 | 58 |
| 20701 Beach Blvd #100 | 0.51mi | 3/2.0 | 1,560 (+8%) | 8mo | $280,000 | $179 | 57 |
| 20701 Beach Blvd #106 | 0.48mi | 3/2.0 | 1,560 (+8%) | 10mo | $225,000 | $144 | 56 |
| 20701 Beach Blvd #280 | 0.40mi | 2/2.0 (-1) | 1,349 (-7%) | 11mo | $162,500 | $120 | 55 |
| 20701 Beach Blvd #200 | 0.52mi | 2/2.0 (-1) | 1,368 (-6%) | 7mo | $115,000 | $84 | 55 |
Match score weights: distance 35% · size 25% · config 20% · recency 20%. Top-matched comps best support the ARV.
Projected returns pro-forma
-3.0% appreciation · 2.78% rent growth · sell at horizon
- IRR
- 30.2%
- Equity multiple
- 2.26×
- Total profit
- $98,733
- Equity at exit
- $41,749
- IRR
- 37.3%
- Equity multiple
- 4.42×
- Total profit
- $268,166
- Equity at exit
- $24,209
Cash invested: $78,400 (down + closing). Projections, not guarantees.
Landlord ↔ Tenant lean methodology
- Overall (STATE)
- 18 Strongly Tenant-Friendly
- State California
- 18 Strongly Tenant-Friendly · D+13
- County
- — inherits STATE
- City
- — inherits STATE
ZIP-level market 92648
- Rents YoY
- 2.8%
- Active inventory
- 137
- Price-to-rent
- 4.7×
Monthly cashflow live
- Estimated rent
- $4,957 high interval (Pro) →
- Mortgage (P&I)
- −$1,468
- Tax from tax record
- −$49 /mo · $594/yr
- Insurance
- −$117
- HOA
- −$0
- Vacancy / Maint / Mgmt
- −$1,041
- Net cashflow
- $2,282
Break-even live
Sensitivity live
| Price | -10% $2,440 | -5% $2,361 | +0% $2,282 | +5% $2,202 | +10% $1,787 |
|---|---|---|---|---|---|
| Rent | -10% $1,890 | -5% $2,086 | +0% $2,282 | +5% $2,477 | +10% $2,673 |
| Rate | -1.0pp $2,423 | -0.5pp $2,353 | base $2,282 | +0.5pp $2,209 | +1.0pp $2,135 |
UW: 25.0% down · 7.5% · 30yr · 1.5% tax · 5.0% vac · 8.0% maint · 8.0% mgmt
Financing live
Cash to close
- Down payment
- $70,000
- Closing costs
- $8,400
- Reserves months
- —
- Total cash needed
- —
Loan-product check · same deal, 3 products live
Conventional
25% down · 7.5% · 30yr
- Down + closing
- —
- Monthly P&I
- —
- Monthly cashflow
- —
- DSCR
- —
- Eligible?
- —
Personal DTI + credit; lowest rate.
DSCR
20% down · 8.5% · 30yr
- Down + closing
- —
- Monthly P&I
- —
- Monthly cashflow
- —
- DSCR
- —
- Eligible?
- —
No personal income docs; deal must DSCR.
Hard money
10% down · 12.0% · 12mo
- Down + closing
- —
- Monthly P&I
- —
- Monthly cashflow
- —
- DSCR
- —
- Eligible?
- —
Short-term bridge; refi at stabilization.
Rent comps 40 comps
| Address | Beds | Baths | Sqft | Rent | $/sqft | DOM | Units | Dist |
|---|---|---|---|---|---|---|---|---|
| 7832 Seaglen Dr Huntington Beach, CA | 3.0 | 2.5 | 1700 | $8,000 | $4.71 | 0d | 1 | 0.12mi |
| 7795 Neptune Dr Huntington Beach, CA | 2.0–4.0 | 1.5–2.5 | 1155 | $4,654 | $4.03 | 0d | 3 | 0.14mi |
| 7866 Southwind Cir Huntington Beach, CA | 3.0 | 2.0 | 1787 | $5,000 | $2.80 | 0d | 1 | 0.15mi |
| 21040 Pacific City Cir Huntington Beach, CA | 1.0–3.0 | 1.0–2.5 | 1137 | $7,979 | $7.01 | 0d | 26 | 0.21mi |
| 7961 Southwind Cir Huntington Beach, CA | 3.0 | 2.5 | 1664 | $6,195 | $3.72 | 0d | 1 | 0.23mi |
| 7946 Waterfall Cir Huntington Beach, CA | 2.0 | 2.5 | 1439 | $4,500 | $3.13 | 0d | 1 | 0.25mi |
| 7623 Bay Dr #103 Huntington Beach, CA | 2.0 | 1.0 | 968 | $3,200 | $3.31 | 0d | 1 | 0.26mi |
| 20966 Seacoast Cir Huntington Beach, CA | 3.0 | 2.5 | 1685 | $4,300 | $2.55 | 9d | 1 | 0.32mi |
| 21270 Beach Blvd Huntington Beach, CA | 2.0 | 1.0–2.0 | 679 | $3,537 | $5.21 | 0d | 13 | 0.33mi |
| 227 1st St Unit 3 Huntington Beach, CA | 2.0 | 2.0 | 1050 | $7,000 | $6.67 | 20d | 1 | 0.34mi |
| 310 Lake St #310 Huntington Beach, CA | 2.0 | 2.0 | 1160 | $3,350 | $2.89 | 0d | 1 | 0.36mi |
| 8121 Foxhall Dr Huntington Beach, CA | 3.0 | 1.5 | 1296 | $4,950 | $3.82 | 0d | 1 | 0.42mi |
| 420 Lake St #101 Huntington Beach, CA | 2.0 | 2.0 | 1023 | $4,000 | $3.91 | 21d | 1 | 0.44mi |
| 200 Pacific Coast Hwy Huntington Beach, CA | 1.0–2.0 | 1.0–2.0 | 1064 | $4,500 | $4.23 | 0d | 2 | 0.45mi |
| 200 Pacific Coast Hwy Huntington Beach, CA | 2.0 | 2.0–2.5 | 1299 | $4,575 | $3.52 | 17d | 2 | 0.45mi |
| 509 Delaware St Huntington Beach, CA | 3.0 | 2.0 | 1200 | $3,200 | $2.67 | 0d | 1 | 0.46mi |
| 509 Delaware St Unit A Huntington Beach, CA | 3.0 | 2.0 | 1200 | $3,200 | $2.67 | 3d | 1 | 0.46mi |
| 430 Lake St #202 Huntington Beach, CA | 2.0 | 2.0 | 1023 | $3,850 | $3.76 | 20d | 1 | 0.47mi |
| 414 Main St #210 Huntington Beach, CA | 2.0 | 2.5 | 1530 | $6,500 | $4.25 | 23d | 1 | 0.48mi |
| 224 Frankfort Ave Huntington Beach, CA | 2.0 | 1.0 | 925 | $3,750 | $4.05 | 0d | 1 | 0.50mi |
| 8216 Foxhall Dr Huntington Beach, CA | 4.0 | 2.5 | 1482 | $5,195 | $3.51 | 4d | 1 | 0.52mi |
| 608 Olive Ave Huntington Beach, CA | 3.0 | 2.0 | 1100 | $4,195 | $3.81 | 17d | 1 | 0.64mi |
| 626 Lake St #54 Huntington Beach, CA | 3.0 | 3.0 | 1400 | $3,895 | $2.78 | 25d | 1 | 0.70mi |
| 8450 Atlanta Ave Huntington Beach, CA | 1.0–2.0 | 1.0 | 791 | $2,845 | $3.59 | 0d | 9 | 0.72mi |
| 408 8th St Huntington Beach, CA | 3.0 | 2.0 | 1545 | $5,500 | $3.56 | 0d | 1 | 0.72mi |
| 711 Pacific Coast Hwy Huntington Beach, CA | 1.0–3.0 | 1.0–2.0 | 1089 | $9,500 | $8.72 | 0d | 3 | 0.76mi |
| 8461 Lomond Dr Huntington Beach, CA | 3.0 | 1.0 | 950 | $3,800 | $4.00 | 12d | 1 | 0.76mi |
| 711 Pacific Coast Hwy #325 Huntington Beach, CA | 2.0 | 1.0 | 968 | $9,500 | $9.81 | 0d | 1 | 0.76mi |
| 1008 England St Huntington Beach, CA | 3.0 | 2.0 | 1200 | $4,500 | $3.75 | 0d | 1 | 0.77mi |
| 910 Acacia Ave Huntington Beach, CA | 3.0 | 2.0 | 1700 | $6,850 | $4.03 | 0d | 1 | 0.84mi |
| 21851 Newland St #104 Huntington Beach, CA | 3.0 | 2.0 | 1248 | $4,000 | $3.21 | 18d | 1 | 0.86mi |
| 8302 Indianapolis Ave Huntington Beach, CA | 3.0 | 2.0 | 1045 | $4,450 | $4.26 | 21d | 1 | 0.89mi |
| 20301 Bluffside Cir Unit D110 Huntington Beach, CA | 2.0 | 2.0 | 1101 | $5,250 | $4.77 | 0d | 1 | 0.93mi |
| 403 Memphis Ave Unit 2 Huntington Beach, CA | 2.0 | 1.0 | 900 | $2,500 | $2.78 | 21d | 1 | 0.95mi |
| 1318 Applecross Ln Huntington Beach, CA | 3.0 | 2.5 | 1588 | $4,400 | $2.77 | 14d | 1 | 0.97mi |
| 308 Nashville Ave Huntington Beach, CA | 2.0 | 1.0 | 1000 | $3,116 | $3.12 | 0d | 1 | 0.99mi |
| 1315 Alabama St Huntington Beach, CA | 3.0 | 2.0 | 1236 | $7,500 | $6.07 | 0d | 1 | 0.99mi |
| 20321 Tidepool Cir Unit 105 Huntington Beach, CA | 2.0 | 2.0 | 1104 | $3,700 | $3.35 | 0d | 1 | 0.99mi |
| 8565 Trinity Cir Unit 821D Huntington Beach, CA | 2.0 | 2.0 | 1077 | $3,450 | $3.20 | 12d | 1 | 1.00mi |
| 8565 Trinity Cir Unit 821D Huntington Beach, CA | 2.0 | 2.0 | 1077 | $3,450 | $3.20 | 0d | 1 | 1.00mi |
Listing history 25 events
-
2026-06-21days on market $280,000 Active 35 DOM
-
2026-06-18days on market $280,000 Active 32 DOM
-
2026-06-17days on market $280,000 Active 31 DOM
-
2026-06-16days on market $280,000 Active 30 DOM
-
2026-06-15days on market $280,000 Active 29 DOM
-
2026-06-13days on market $280,000 Active 27 DOM
-
2026-06-13days on market $280,000 Active 26 DOM
-
2026-06-09days on market $280,000 Active 23 DOM
-
2026-06-08days on market $280,000 Active 22 DOM
-
2026-06-07days on market $280,000 Active 21 DOM
-
2026-06-04days on market $280,000 Active 18 DOM
-
2026-06-03days on market $280,000 Active 17 DOM
-
2026-06-02days on market $280,000 Active 16 DOM
-
2026-06-01days on market $280,000 Active 15 DOM
-
2026-05-31days on market $280,000 Active 14 DOM
-
2026-05-17$280,000 Active
-
2024-05-31historical
-
2024-03-20price $289,000
-
2024-03-04$325,000 Active
-
2024-03-01historical
-
2024-02-27status Active
-
2024-02-19status Pending Sale
-
2024-02-07status Active
-
2024-01-31status Pending Sale
-
2023-10-06$325,000 Active
ⓘ Source: listings_history table (triggers on properties + properties_extension) + one-shot
backfill from property_details.listing_events for pre-trigger history.
Tax reassessment forecast CA · Resets to sale price
- Current annual tax
- $594 · $49/mo
- Projected year-2 tax
- $2,128 · $177/mo
- Expected delta
- +$1,534/yr (+$128/mo · 258.5%)
ⓘ Screening estimate from a state-policy table — verify with the county assessor before closing.
Nearby sold comps map
Loading sold comps map…
Walkable amenities ~0.75 mi
Loading nearby amenities…
Taxation est. · year 1
- Rental income
- $59,483
- − Mortgage interest
- −$15,684
- − Property taxes
- −$594
- − Insurance
- −$1,400
- − Repairs & maintenance
- −$4,759
- − Management
- −$4,759
- − Depreciation
- −$8,145
- Taxable income
- $24,143
- Est. tax owed @ 24.0%
- −$5,794
- After-tax cash flow
- $21,584/yr
For passive investors: Depreciation is non-cash, so a rental often shows a tax loss while cash-flowing — sheltering income. Rental losses are passive: they offset passive income freely, and up to $25,000/yr can offset ordinary (W-2) income if you actively participate and your MAGI is under $100k (phasing out to $0 by $150k); unused losses carry forward. On sale, claimed depreciation is recaptured at up to 25%, and gains may owe capital-gains tax (a 1031 exchange can defer both). Figures are a year-1 estimate at your 24.0% rate — not tax advice; consult a CPA.
Schools (NCES district)
- District
- Huntington Beach Union High
- NCES district ID
- 0618060
- Math proficiency
- 65% ▲ 17.00%
- Reading proficiency
- 82% ▲ 8.00%
- Median HH income
- $78,159
- Composite
- 64.9/100
- National rank
- #511
- State rank
- #39 of 517 in CA
Livability — Huntington Beach
- Score
- 67/100
- State rank
- #306
- US rank
- #10298
Category grades
Schools grade is shown separately in the Schools card above.
Census & demographics
- Census place
- Huntington Beach, CA
- County
- Orange County · 3,096,323 people
- City population
- 194,835
- Metro
- Los Angeles-Long Beach-Anaheim, CA
- Population (ZIP)
- 45,827
- Household income
- $130,164
- Rent vs Own
- Severe rent burden
- 2957.0
Population outlook (Orange County) Hauer SSP2
- Today (2025)
- 3,477,456 people
- By 2030
- 3,613,117 · +3.9%
- By 2040
- 3,835,945 · +10.3%
- By 2050
- 3,968,736 · +14.1%
- By 2075
- 4,097,053 · +17.8%
- By 2100
- 3,903,633 · +12.3%
Race, ethnicity, and origin ACS 2023
- Neighborhood character
- Diverse neighborhood (Simpson 0.56)
- Race & ethnicity
- White 63% Hispanic / Latino 16% Two or more races 14% Asian 11%
- Hispanic origin (detail)
- Mexican 11%
- Common ancestry
- Slovak 3% Italian 3% Scotch-Irish 3%
- Foreign-born
- 14% · Canada, Vietnam, China
- Languages at home
- 80% English-only · Spanish 7% Vietnamese 3% Other Indo-European 3%
Political lean MEDSL · Orange
- 2024 margin
- Toss-up / Even · D 49.7% · R 47.1% · Other 3.2%
- 2008→2024 swing
- +5.2pp toward D · 2008: -2.6pp · 2024: 2.6pp
- All cycles
- 2024: D+2.6 2020: D+9.0 2016: D+7.7 2012: R+8.3 2008: R+2.6
Not yet ingested
- Civics
- —
Market trends
- HPI YoY
- ▼ -797.90%
- Current HPI
- 381.1587
- Rent YoY
- ▲ 2.78%
- Metro
- Los Angeles-Long Beach-Anaheim, CA
- State GDP YoY
- ▲ 3.21%
- F500 in state
- 116
Industry mix (Fortune 500 HQ in CA)
| Industry | F500 HQs | Revenue |
|---|---|---|
| Technology | 27 | $1,492B |
|
||
| Financial Services | 3 | $174B |
|
||
| Retail | 3 | $44B |
|
||
| Insurance | 3 | $26B |
|
||
| Media / Entertainment | 2 | $115B |
|
||
| Pharmaceuticals / Biotech | 2 | $62B |
|
||
Price history
-13.8% since first listed10 events — show timeline
- 2026-05-17 Listed $280,000 CRMLS
- 2024-05-31 Listing Removed — CRMLS
- 2024-03-20 Price Changed $289,000 CRMLS
- 2024-03-04 Listed $325,000 CRMLS
- 2024-03-01 Listing Removed — CRMLS
- 2024-02-27 Relisted — CRMLS
- 2024-02-19 Pending — CRMLS
- 2024-02-07 Relisted — CRMLS
- 2024-01-31 Pending — CRMLS
- 2023-10-06 Listed $325,000 CRMLS
Property tax history
-3.4%/yrLatest (2025): $594 · -0.3% YoY. Source: county tax records.
Cash-flow waterfall
monthlySold comps — $/sqft
last 12 mo · ≤1 miLoading sold comps…