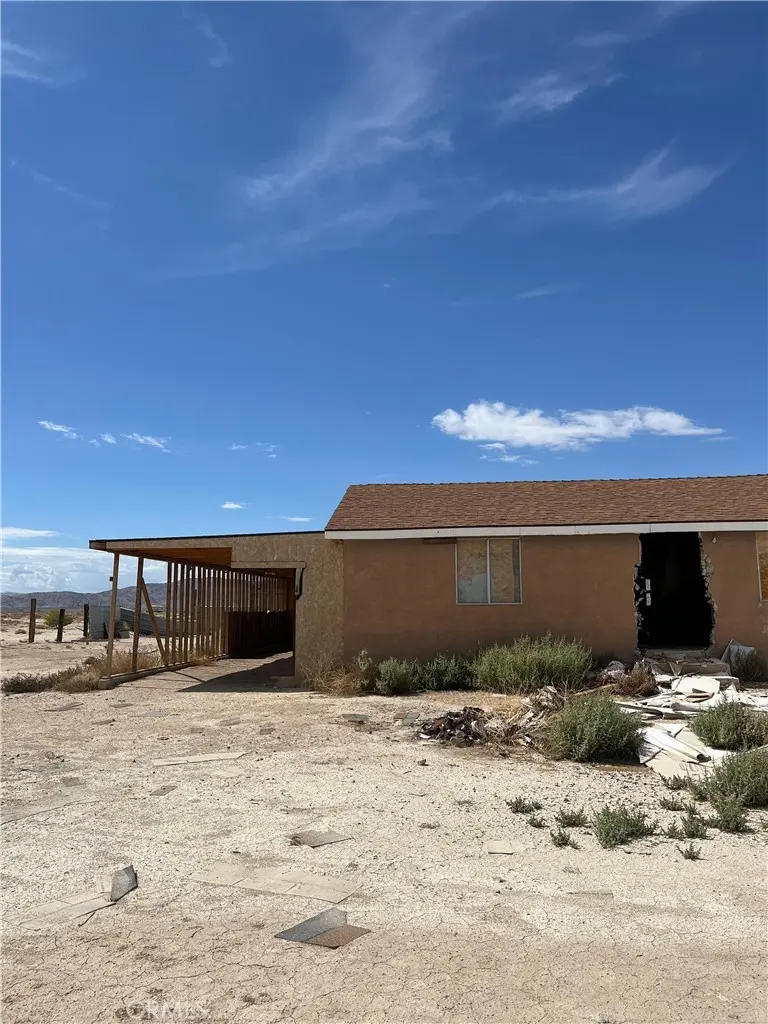
14588 Locust · Lucerne Valley, CA
Flood risk 1/10 · Minimal
- FEMA flood zone
- D
- Chance of flooding over 30 yrs
- 0.0%
- Est. flood insurance / yr
- $544 – $1,084
Fire risk 1/10 · Minimal
- Est. fire insurance / yr
- $659 – $1,223
Heat risk 7/10 · Major
- Hot days now (above 102°F)
- 6 days/yr
- Hot days in 30 yrs
- 17 days/yr
Wind risk 1/10 · Minimal
- Chance of severe wind over 30 yrs
- —
Air-quality risk 9/10 · Severe
- Unhealthy air days now
- 21 days/yr
- Unhealthy air days in 30 yrs
- 26 days/yr
Risk factors via First Street. Map © Google.
Why this score? — see what drove the A- grade
The composite is a weighted blend of 9 inputs, each scored 0–100. Each bar is that input's sub-score; the figure is the points it added to the 100-point composite (weight × sub-score).
- Cash flow +30.0/30.0
- ARV discount +15.0/15.0
- DSCR +10.0/10.0
- Appreciation +10.0/10.0
- 1% rule +9.5/10.0
- Rent growth +2.5/5.0
- Schools +2.5/10.0
- Condition / age +2.5/5.0
- Livability +2.1/5.0
$130,000
🖨 Deal sheet 📄 Offer letter ✓ Due diligence
Listing remarks MLS
The home needs some repairs and renovation. Ideal for investors, flipper, or contractors. Looking for their next project. With the right vision and improvements, this could be rewarding investment. Bring your ideas and turn this property into something special! Fixer upper sold “as is”!
Key facts
- 26.36 acre lot
- Built 1969
- Listed 260 days
Neighborhood map
What this means for you Summary
Snapshot
- This is a 2-bed/1.0-bath single-family listed at $130k.
Deal economics
- At list price, monthly cash flow is $550 ($7k/yr) — positive.
- The deal already cash-flows at list — no discount required.
- Meets the 1% rule at list price ($2k rent vs $130k).
- Recommended offer: $114k (12.0% below list) — sets the bar for market timing.
- Cap rate 11.4% vs local median 4.7% in Lucerne Valley — top-decile yield for the area; either an underpriced asset or a hidden risk that comps aren't pricing in. Stress-test before assuming the spread holds.
Location & tenants
- Location reads 42/100 on livability (#1,358 in CA) — a working-class tenant base; expect higher turnover. Strengths: housing A+; Watch: cost of living C-, schools F, crime F.
- Lucerne Valley Unified (rural): math 22% / reading 33% proficiency, ranked #1,155 of 1,400 in CA (top 82%) — low school quality limits family demand, transient renter base, plan for 1-2y turnover; 78% free/reduced lunch — lower-income household profile, screen leases tightly.
- Market conditions: 366 active listings in the ZIP; 5,458 units permitted in San Bernardino County in 2024 (1,500 in 5+ unit buildings).
Forward outlook
- In year one you build about $14k of equity ($899 loan paydown + $13k appreciation (10.0% local appreciation)).
- San Bernardino County population projected at +15% by 2050 — modest demand growth; plan on rents tracking national, not racing it.
- At projected returns (10.0% appreciation + 3.0% rent growth), your $36k cash investment doubles in ~2 years — after that, you're playing with house money.
- By year 3, paydown + projected appreciation supports a ~$35k cash-out refi (75% LTV) — recoverable capital for the next deal without selling this one.
Negotiation context
- It's been on market 261 days — a 12% lower offer ($114k) is reasonable based on typical stale-listing flexibility.
- 17 sale attempts since 15y ago; this cycle's ask has dropped $130k (50%) from the opening price — seller is motivated, your offer sets the floor, not the list.
Risks & watch-outs
- Climate carrying-cost: extreme-heat days projected 6→17/yr by 2055 (HVAC capex compounding) — expect insurance premiums to compound above CPI over the hold.
Questions for the listing agent
- It's been on market 261 days. Have you received any prior offers? Is the seller open to a 12% concession, seller financing, or rate buy-down credit?
- Built in 1969 — when were the roof, HVAC, electrical panel, plumbing, and water heater last replaced?
- Why hasn't it sold? Are there any deal-killer items the seller is aware of (foundation, flood, title, zoning, code violations)?
- Is there a deadline driving the sale (1031 exchange, divorce, estate, relocation)? That informs how much negotiation room exists.
- Schools are F-rated, which usually means shorter tenancies and higher turnover. Who's the typical renter profile here, and what's been the actual vacancy rate?
- Crime grade is F in this area — have there been break-ins, vandalism, or insurance claims at this property in the last 3 years? What carrier currently insures it and at what premium?
- What's the average days-on-market for RENTAL listings here right now (not sales)? A rising rental-DOM trend means longer vacancies and softer asking-rent achievability than the comps imply.
- What's the recent tenant-quality profile in this submarket — average credit score on applications, eviction rate, late-payment / NSF rate, and stable-employment percentage? A property-management company in the area should have these aggregated.
- How much new for-sale + rental construction is in the pipeline within 1–3 miles? Heavy new supply typically softens prices + rents 12–24 months out; constrained supply supports both.
Investment metrics
- 1% rule
- 1.45% ✓
- Cap rate
- 11.37%
- Cash-on-cash
- 18.14%
- DSCR
- 1.81
- GRM
- 5.8
CMA / ARV
- ARV (median comp)
- $210,063
- List price
- $130,000
- Delta
- -38.11%
- Verdict
- UNDERPRICED
- Comps
- 1 within 2.0 mi
Projected returns pro-forma
10.0% appreciation · 3.0% rent growth · sell at horizon
- IRR
- 37.8%
- Equity multiple
- 3.91×
- Total profit
- $105,903
- Equity at exit
- $117,114
- IRR
- 32.5%
- Equity multiple
- 8.81×
- Total profit
- $284,404
- Equity at exit
- $252,561
Cash invested: $36,400 (down + closing). Projections, not guarantees.
Landlord ↔ Tenant lean methodology
- Overall (STATE)
- 18 Strongly Tenant-Friendly
- State California
- 18 Strongly Tenant-Friendly · D+13
- County
- — inherits STATE
- City
- — inherits STATE
ZIP-level market 92356
- Home prices YoY
- 20.6%
- Active inventory
- 366
- Price-to-rent
- 5.8×
Monthly cashflow live
- Estimated rent
- $1,880 medium interval (Pro) →
- Mortgage (P&I)
- −$682
- Tax from tax record
- −$199 /mo · $2,392/yr
- Insurance
- −$54
- HOA
- −$0
- Vacancy / Maint / Mgmt
- −$395
- Net cashflow
- $550
Break-even live
UW: 25.0% down · 7.5% · 30yr · 1.5% tax · 5.0% vac · 8.0% maint · 8.0% mgmt
Financing live
Cash to close
- Down payment
- $32,500
- Closing costs
- $3,900
- Reserves months
- —
- Total cash needed
- —
Loan-product check · same deal, 3 products live
Conventional
25% down · 7.5% · 30yr
- Down + closing
- —
- Monthly P&I
- —
- Monthly cashflow
- —
- DSCR
- —
- Eligible?
- —
Personal DTI + credit; lowest rate.
DSCR
20% down · 8.5% · 30yr
- Down + closing
- —
- Monthly P&I
- —
- Monthly cashflow
- —
- DSCR
- —
- Eligible?
- —
No personal income docs; deal must DSCR.
Hard money
10% down · 12.0% · 12mo
- Down + closing
- —
- Monthly P&I
- —
- Monthly cashflow
- —
- DSCR
- —
- Eligible?
- —
Short-term bridge; refi at stabilization.
Listing history 50 events
-
2026-06-18days on market $130,000 Active 261 DOM
-
2026-06-17days on market $130,000 Active 260 DOM
-
2026-06-16days on market $130,000 Active 259 DOM
-
2026-06-15days on market $130,000 Active 258 DOM
-
2026-06-13days on market $130,000 Active 256 DOM
-
2026-06-13days on market $130,000 Active 255 DOM
-
2026-06-09days on market $130,000 Active 252 DOM
-
2026-06-08days on market $130,000 Active 251 DOM
-
2026-06-07days on market $130,000 Active 250 DOM
-
2026-06-04days on market $130,000 Active 247 DOM
-
2026-06-03days on market $130,000 Active 246 DOM
-
2026-06-02days on market $130,000 Active 245 DOM
-
2026-06-01days on market $130,000 Active 244 DOM
-
2026-05-31days on market $130,000 Active 243 DOM
-
2026-04-28price $130,000 300-char remark
Show marketing remark (300 chars)
The home needs some repairs and renovation. Ideal for investors, flipper, or contractors. Looking for their next project. With the right vision and improvements, this could be rewarding investment. Bring your ideas and turn this property into something special! Fixer upper sold “as is”!
-
2026-03-25price $140,000 300-char remark
Show marketing remark (300 chars)
The home needs some repairs and renovation. Ideal for investors, flipper, or contractors. Looking for their next project. With the right vision and improvements, this could be rewarding investment. Bring your ideas and turn this property into something special! Fixer upper sold “as is”!
-
2026-03-05price $175,999 300-char remark
Show marketing remark (300 chars)
The home needs some repairs and renovation. Ideal for investors, flipper, or contractors. Looking for their next project. With the right vision and improvements, this could be rewarding investment. Bring your ideas and turn this property into something special! Fixer upper sold “as is”!
-
2026-02-09price $199,000 300-char remark
Show marketing remark (300 chars)
The home needs some repairs and renovation. Ideal for investors, flipper, or contractors. Looking for their next project. With the right vision and improvements, this could be rewarding investment. Bring your ideas and turn this property into something special! Fixer upper sold “as is”!
-
2026-02-09soldstatus $150,000
Show marketing remark (300 chars)
The home needs some repairs and renovation. Ideal for investors, flipper, or contractors. Looking for their next project. With the right vision and improvements, this could be rewarding investment. Bring your ideas and turn this property into something special! Fixer upper sold “as is”!
-
2025-11-24price $240,000 300-char remark
Show marketing remark (300 chars)
The home needs some repairs and renovation. Ideal for investors, flipper, or contractors. Looking for their next project. With the right vision and improvements, this could be rewarding investment. Bring your ideas and turn this property into something special! Fixer upper sold “as is”!
-
2025-09-30$260,000 Active 300-char remark
Show marketing remark (300 chars)
The home needs some repairs and renovation. Ideal for investors, flipper, or contractors. Looking for their next project. With the right vision and improvements, this could be rewarding investment. Bring your ideas and turn this property into something special! Fixer upper sold “as is”!
-
2021-11-25historical
-
2021-11-24historical
-
2019-07-08historical
-
2018-10-31historical
-
2018-10-31historical
-
2018-08-16soldstatus $150,000
-
2018-08-16soldstatus $150,000 Closed Sale
-
2018-08-16soldstatus $150,000
-
2018-07-20status Pending Sale
-
2017-11-05$150,000 Active
-
2017-11-03$150,000
-
2017-04-01$130,000
-
2016-12-30$75,000
-
2016-12-30$75,000
-
2016-10-05historical
-
2016-09-09$119,000
-
2016-09-09$119,000
-
2016-09-09$119,000 Active
-
2016-06-30historical
-
2016-04-15price $99,900
-
2015-12-08price $139,900
-
2015-10-26$149,900 Active
-
2015-07-04historical
-
2015-03-06historical
-
2015-01-04$129,900
-
2014-04-24historical
-
2013-11-06status Active
-
2013-10-10historical
-
2013-09-16$90,000
ⓘ Source: listings_history table (triggers on properties + properties_extension) + one-shot
backfill from property_details.listing_events for pre-trigger history.
Tax reassessment forecast CA · Resets to sale price
- Current annual tax
- $2,392 · $199/mo
- Projected year-2 tax
- $2,392 · $199/mo
- Expected delta
- $0/yr ($0/mo · 0.0%)
ⓘ Screening estimate from a state-policy table — verify with the county assessor before closing.
Climate risk First Street
- Flood 1/10 Low FEMA zone D · 0% chance over 30 yrs
- Wildfire 1/10 Low
- Heat 7/10 Severe 6 d/yr ≥102°F today · 17 d/yr by 30 yrs out
- Wind 1/10 Low
- Air quality 9/10 Extreme 21 unhealthy d/yr today · 26 by 30 yrs out
Nearby sold comps map
Loading sold comps map…
Walkable amenities ~0.75 mi
Loading nearby amenities…
Taxation est. · year 1
- Rental income
- $22,566
- − Mortgage interest
- −$7,282
- − Property taxes
- −$2,392
- − Insurance
- −$650
- − Repairs & maintenance
- −$1,805
- − Management
- −$1,805
- − Depreciation
- −$3,782
- Taxable income
- $4,849
- Est. tax owed @ 24.0%
- −$1,164
- After-tax cash flow
- $5,440/yr
For passive investors: Depreciation is non-cash, so a rental often shows a tax loss while cash-flowing — sheltering income. Rental losses are passive: they offset passive income freely, and up to $25,000/yr can offset ordinary (W-2) income if you actively participate and your MAGI is under $100k (phasing out to $0 by $150k); unused losses carry forward. On sale, claimed depreciation is recaptured at up to 25%, and gains may owe capital-gains tax (a 1031 exchange can defer both). Figures are a year-1 estimate at your 24.0% rate — not tax advice; consult a CPA.
Schools (NCES district)
- District
- Lucerne Valley Unified
- NCES district ID
- 0600015
- Math proficiency
- 22% ▲ 6.00%
- Reading proficiency
- 33% ▲ 1.00%
- Median HH income
- $28,341
- Composite
- 24.98/100
- National rank
- #12969
- State rank
- #1155 of 1400 in CA
Livability — Lucerne Valley
- Score
- 42/100
- State rank
- #1358
- US rank
- #26994
Category grades
Schools grade is shown separately in the Schools card above.
Census & demographics
- Population (ZIP)
- 6,665
Population outlook (San Bernardino County) Hauer SSP2
- Today (2025)
- 2,300,329 people
- By 2030
- 2,378,907 · +3.4%
- By 2040
- 2,523,137 · +9.7%
- By 2050
- 2,642,388 · +14.9%
- By 2075
- 2,880,769 · +25.2%
- By 2100
- 2,909,436 · +26.5%
Race, ethnicity, and origin ACS 2023
- Neighborhood character
- Diverse neighborhood (Simpson 0.58)
- Race & ethnicity
- White 56% Hispanic / Latino 32% Two or more races 17% Asian 3% Black 3% Native American 2%
- Hispanic origin (detail)
- Mexican 28% Cuban 2%
- Common ancestry
- Italian 4% Lithuanian 2% Romanian 2%
- Foreign-born
- 18% · Canada, South Korea
- Languages at home
- 70% English-only · Spanish 26% Korean 3% Tagalog/Filipino 1%
Political lean MEDSL · San Bernardino
- 2024 margin
- Toss-up / Even · D 47.5% · R 49.7% · Other 2.8%
- 2008→2024 swing
- -8.5pp toward R · 2008: 6.3pp · 2024: -2.1pp
- All cycles
- 2024: R+2.1 2020: D+10.7 2016: D+9.8 2012: D+5.4 2008: D+6.3
Not yet ingested
- Civics
- —
Market trends
- HPI YoY
- ▲ 75.34%
- Current HPI
- 440.6077
- Rent YoY
- —
- Metro
- —
- State GDP YoY
- ▲ 3.21%
- F500 in state
- 116
Industry mix (Fortune 500 HQ in CA)
| Industry | F500 HQs | Revenue |
|---|---|---|
| Technology | 27 | $1,492B |
|
||
| Financial Services | 3 | $174B |
|
||
| Retail | 3 | $44B |
|
||
| Insurance | 3 | $26B |
|
||
| Media / Entertainment | 2 | $115B |
|
||
| Pharmaceuticals / Biotech | 2 | $62B |
|
||
Price history
+160.0% since first listed49 events — show timeline
- 2026-04-28 Price Changed $130,000 CRMLS
- 2026-03-25 Price Changed $140,000 CRMLS
- 2026-03-05 Price Changed $175,999 CRMLS
- 2026-02-09 Price Changed $199,000 CRMLS
- 2026-02-09 Sold (Public Records) $150,000 Public Records
- 2025-11-24 Price Changed $240,000 CRMLS
- 2025-09-30 Listed $260,000 CRMLS
- 2021-11-25 Listing Removed — CRMLS
- 2021-11-24 Listing Removed — CRMLS
- 2019-07-08 Listing Removed — CRMLS
- 2018-10-31 Listing Removed — SDMLS
- 2018-10-31 Listing Removed — SDMLS
- 2018-08-16 Sold (Public Records) $150,000 Public Records
- 2018-08-16 Sold (MLS) $150,000 CRMLS
- 2018-08-16 Sold (MLS) $150,000 CRMLS
- 2018-07-20 Pending — CRMLS
- 2017-11-05 Listed $150,000 CRMLS
- 2017-11-03 Listed $150,000 CRMLS
- 2017-04-01 Listed $130,000 CRMLS
- 2016-12-30 Listed $75,000 SDMLS
- 2016-12-30 Listed $75,000 CRMLS
- 2016-10-05 Listing Removed — CRMLS
- 2016-09-09 Listed $119,000 SDMLS
- 2016-09-09 Listed $119,000 CRMLS
- 2016-09-09 Listed $119,000 CRMLS
- 2016-06-30 Listing Removed — CRMLS
- 2016-04-15 Price Changed $99,900 CRMLS
- 2015-12-08 Price Changed $139,900 CRMLS
- 2015-10-26 Listed $149,900 CRMLS
- 2015-07-04 Listing Removed — CRMLS
- 2015-03-06 Listing Removed — CRMLS
- 2015-01-04 Listed $129,900 CRMLS
- 2014-04-24 Listing Removed — CRMLS
- 2013-11-06 Relisted — CRMLS
- 2013-10-10 Listing Removed — CRMLS
- 2013-09-16 Listed $90,000 CRMLS
- 2012-04-30 Listed $85,000 CRMLS
- 2012-04-15 Listing Removed — CRMLS
- 2012-04-06 Relisted — CRMLS
- 2012-03-27 Delisted — CRMLS
- 2012-03-19 Relisted — CRMLS
- 2012-03-09 Delisted — CRMLS
- 2011-12-22 Price Changed $91,000 CRMLS
- 2011-12-17 Price Changed $93,000 CRMLS
- 2011-10-12 Listed $98,000 CRMLS
- 2005-03-25 Sold (Public Records) $200,000 Public Records
- 2004-01-01 Sold (MLS) $50,000 CRMLS
- 1989-12-07 Sold (Public Records) $90,000 Public Records
- 1986-07-09 Sold (Public Records) $50,000 Public Records
Property tax history
+2.1%/yrLatest (2025): $2,392 · +2.3% YoY. Source: county tax records.
Cash-flow waterfall
monthlySold comps — $/sqft
last 12 mo · ≤1 miLoading sold comps…