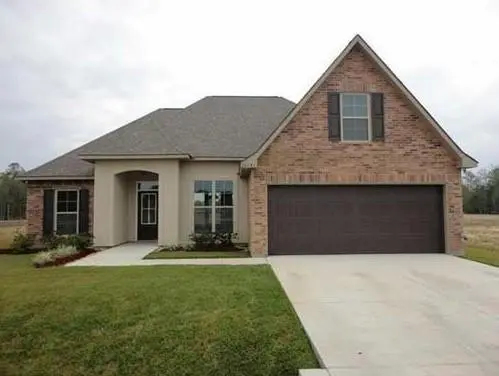
20191 Bella Gardens Cir · Hammond, LA
Flood risk 1/10 · Minimal
- FEMA flood zone
- X (unshaded)
- Chance of flooding over 30 yrs
- 0.0%
- Est. flood insurance / yr
- $507 – $1,088
Fire risk 3/10 · Minor
- Est. fire insurance / yr
- $1,269 – $2,357
Heat risk 9/10 · Severe
- Hot days now (above 109°F)
- 7 days/yr
- Hot days in 30 yrs
- 22 days/yr
Wind risk 9/10 · Severe
- Chance of severe wind over 30 yrs
- 99.0%
Air-quality risk 2/10 · Minimal
- Unhealthy air days now
- 0 days/yr
- Unhealthy air days in 30 yrs
- 1 days/yr
Risk factors via First Street. Map © Google.
Why this score? — see what drove the D+ grade
The composite is a weighted blend of 9 inputs, each scored 0–100. Each bar is that input's sub-score; the figure is the points it added to the 100-point composite (weight × sub-score).
- Cash flow +18.3/30.0
- ARV discount +10.7/15.0
- DSCR +5.8/10.0
- 1% rule +4.0/10.0
- Livability +3.5/5.0
- Rent growth +2.7/5.0
- Condition / age +2.5/5.0
- Schools +2.0/10.0
- Appreciation +0.0/10.0
$275,000
🖨 Deal sheet (PDF) 📄 Offer letter ✓ Due diligence
Listing remarks MLS
Three bedroom, two bath home in Blythwood Estates! Energy smart home with an open floor plan with carpeted bedrooms and living room. Gas fireplace in living room. Garden tub in master bathroom with separate shower, including large walk-in closet. Double car garage. This property offers a spacious, fenced backyard great for entertaining. Additional highlights include a tankless water heater and other energy-efficient upgrades.
Key facts
- Energy smart home
- Open floor plan
- Gas fireplace
Tags
Neighborhood map
What this means for you Summary
Snapshot
- This is a 3-bed/2.0-bath single-family listed at $275k.
Deal economics
- At list price, monthly cash flow is $254 ($3k/yr) — positive.
- The deal already cash-flows at list — no discount required.
- To meet the 1% rule (rent ≥ 1% of price), the offer needs to be $249k (9.6% below list).
- Recommended offer: $249k (9.6% below list) — sets the bar for 1% rule.
- Cap rate 7.4% vs local median 5.0% in Hammond — top-decile yield for the area; either an underpriced asset or a hidden risk that comps aren't pricing in. Stress-test before assuming the spread holds.
Location & tenants
- Location reads 69/100 on livability (#77 in LA) — a middle-class / working-renter tenant base. Strengths: cost of living A+, health & safety A+; Watch: amenities C-, commute D+, schools D.
- Tangipahoa Parish (rural): math 18% / reading 29% proficiency, ranked #63 of 98 in LA (top 64%) — low school quality limits family demand, transient renter base, plan for 1-2y turnover; 73% free/reduced lunch — lower-income household profile, screen leases tightly.
- Market conditions: Rents flat; 526 active listings in the ZIP; 4 comparable units currently listed for rent nearby; rentals lingering (median 44d on market — plan ~5-8 weeks vacancy on turnover, expect pricing pressure); 75% of comp listings sitting > 30 days — soft ceiling on asking rent; 1,085 units permitted in Tangipahoa Parish in 2024 (378 in 5+ unit buildings).
- This rent runs 42% of the median local income ($72k/yr) — at the standard rent-burdened threshold; future hikes will face affordability resistance.
Forward outlook
- Local home prices are declining (-3.0%/yr); year-one equity from $2k of loan paydown is wiped out by about $8k of value loss. Plan a longer hold.
- Tangipahoa County population projected at +22% by 2050 — long-run rental-demand tailwind backs the buy-and-hold thesis.
Negotiation context
- It's been on market 79 days — a 6% lower offer ($258k) is reasonable based on typical stale-listing flexibility.
- 6 sale attempts since 18y ago with the ask held roughly flat each time — persistent listings suggest the price (not the market) is what's stuck; bring a comps-based counter.
- Current owner paid $171k; list at $275k implies a 61% gain — meaningful room to come down on a strong offer.
Risks & watch-outs
- Climate carrying-cost: severe wind risk, 99% chance of damaging wind over 30y; extreme-heat days projected 7→22/yr by 2055 (HVAC capex compounding) — expect insurance premiums to compound above CPI over the hold.
Questions for the listing agent
- It's been on market 79 days. Have you received any prior offers? Is the seller open to a 10% concession, seller financing, or rate buy-down credit?
- What does the HOA fee cover, when was the last increase, and are there any pending special assessments or reserve-fund shortfalls?
- Why hasn't it sold? Are there any deal-killer items the seller is aware of (foundation, flood, title, zoning, code violations)?
- Is there a deadline driving the sale (1031 exchange, divorce, estate, relocation)? That informs how much negotiation room exists.
- Schools are D-rated, which usually means shorter tenancies and higher turnover. Who's the typical renter profile here, and what's been the actual vacancy rate?
- Crime grade is F in this area — have there been break-ins, vandalism, or insurance claims at this property in the last 3 years? What carrier currently insures it and at what premium?
- The area grade is low — what's the realistic commute time and amenity access for the typical tenant pool here? Any planned neighborhood developments (good or bad) we should know about?
- What's the average days-on-market for RENTAL listings here right now (not sales)? A rising rental-DOM trend means longer vacancies and softer asking-rent achievability than the comps imply.
- What's the recent tenant-quality profile in this submarket — average credit score on applications, eviction rate, late-payment / NSF rate, and stable-employment percentage? A property-management company in the area should have these aggregated.
- How much new for-sale + rental construction is in the pipeline within 1–3 miles? Heavy new supply typically softens prices + rents 12–24 months out; constrained supply supports both.
Investment metrics
- 1% rule
- 0.90% ✗
- Cap rate
- 7.40%
- Cash-on-cash
- 3.95%
- DSCR
- 1.18
- GRM
- 9.2
CMA / ARV
- ARV (median comp)
- $296,170
- List price
- $275,000
- Delta
- -7.15%
- Verdict
- FAIR
- Comps
- 20 within 1.0 mi
Show comp detail 12 sales within ~0.75 mi
| Address | Dist | Beds/Ba | Sqft | Sold | Price | $/sf | Match |
|---|---|---|---|---|---|---|---|
| 42321 Cy Cir | 0.13mi | 3/2.0 | 1,887 (+2%) | 5mo | $258,000 | $137 | 86 |
| 42375 Wood Ave | 0.19mi | 3/2.0 | 1,887 (+2%) | 4mo | $255,000 | $135 | 84 |
| 42467 Harlan Pl | 0.20mi | 4/2.0 (+1) | 1,875 (+2%) | 6mo | $279,900 | $149 | 78 |
| 20278 Bella Gardens Cir | 0.11mi | 3/2.0 | 1,655 (-10%) | 3mo | $215,000 | $130 | 75 |
| 20316 Clemson Way | 0.39mi | 4/2.0 (+1) | 1,858 (+1%) | 2mo | $279,900 | $151 | 74 |
| 20291 Clemson Way | 0.34mi | 3/2.0 | 1,718 (-7%) | 9mo | $258,000 | $150 | 65 |
| 20151 Carolina Ct | 0.58mi | 3/2.0 | 1,887 (+2%) | 5mo | $260,000 | $138 | 65 |
| 42059 Wood Ave | 0.57mi | 3/2.0 | 1,825 (-1%) | 9mo | $253,675 | $139 | 64 |
| 19078 Greenleaf Cir | 0.40mi | 3/2.0 | 1,714 (-7%) | 7mo | $245,000 | $143 | 63 |
| 19075 Greenleaf Cir | 0.38mi | 3/2.0 | 2,030 (+10%) | 4mo | $277,000 | $136 | 62 |
| 20195 Deveron Dr | 0.46mi | 3/2.0 | 1,718 (-7%) | 9mo | $250,000 | $146 | 60 |
| 42016 Wood Ave | 0.64mi | 4/2.0 (+1) | 1,875 (+2%) | 3mo | $274,500 | $146 | 60 |
Match score weights: distance 35% · size 25% · config 20% · recency 20%. Top-matched comps best support the ARV.
Projected returns pro-forma
-3.0% appreciation · 0.66% rent growth · sell at horizon
- IRR
- -12.6%
- Equity multiple
- 0.56×
- Total profit
- $-34,202
- Equity at exit
- $41,003
- IRR
- -7.2%
- Equity multiple
- 0.59×
- Total profit
- $-31,692
- Equity at exit
- $23,777
Cash invested: $77,000 (down + closing). Projections, not guarantees.
Landlord ↔ Tenant lean methodology
- Overall (STATE)
- 90 Strongly Landlord-Friendly
- State Louisiana
- 90 Strongly Landlord-Friendly · R+12
- County
- — inherits STATE
- City
- — inherits STATE
ZIP-level market 70454
- Rents YoY
- 0.7%
- Active inventory
- 526
- Price-to-rent
- 9.2×
Monthly cashflow live
- Estimated rent
- $2,486 medium interval (Pro) →
- Mortgage (P&I)
- −$1,442
- Tax from tax record
- −$131 /mo · $1,577/yr
- Insurance
- −$115
- HOA
- −$22
- Vacancy / Maint / Mgmt
- −$522
- Net cashflow
- $254
Break-even live
Sensitivity live
| Price | -10% $409 | -5% $332 | +0% $254 | +5% $176 | +10% $98 |
|---|---|---|---|---|---|
| Rent | -10% $57 | -5% $156 | +0% $254 | +5% $352 | +10% $450 |
| Rate | -1.0pp $392 | -0.5pp $324 | base $254 | +0.5pp $182 | +1.0pp $110 |
UW: 25.0% down · 7.5% · 30yr · 1.5% tax · 5.0% vac · 8.0% maint · 8.0% mgmt
Financing live
Cash to close
- Down payment
- $68,750
- Closing costs
- $8,250
- Reserves months
- —
- Total cash needed
- —
Loan-product check · same deal, 3 products live
Conventional
25% down · 7.5% · 30yr
- Down + closing
- —
- Monthly P&I
- —
- Monthly cashflow
- —
- DSCR
- —
- Eligible?
- —
Personal DTI + credit; lowest rate.
DSCR
20% down · 8.5% · 30yr
- Down + closing
- —
- Monthly P&I
- —
- Monthly cashflow
- —
- DSCR
- —
- Eligible?
- —
No personal income docs; deal must DSCR.
Hard money
10% down · 12.0% · 12mo
- Down + closing
- —
- Monthly P&I
- —
- Monthly cashflow
- —
- DSCR
- —
- Eligible?
- —
Short-term bridge; refi at stabilization.
Rent comps 4 comps
| Address | Beds | Baths | Sqft | Rent | $/sqft | DOM | Units | Dist |
|---|---|---|---|---|---|---|---|---|
| 43293 Quiet Lake Dr Hammond, LA | 4.0 | 2.0 | 1850 | $3,840 | $2.08 | 44d | 1 | 1.00mi |
| 19216 Dr John Lambert Dr Hammond, LA | 1.0–3.0 | 1.0–2.0 | 995 | $1,808 | $1.82 | 14d | 10 | 1.15mi |
| 42318 Andrea Ln Ponchatoula, LA | 3.0 | 2.0 | 1291 | $1,800 | $1.39 | 44d | 1 | 1.29mi |
| 20175 Kingland Dr Hammond, LA | 3.0 | 2.5 | 2300 | $2,300 | $1.00 | 44d | 1 | 1.49mi |
HOA detail
- Monthly dues
- $22 · $264/yr
- Likely covers
- watergas
Listing history 27 events
-
2026-06-19days on market $275,000 Active 79 DOM
-
2026-06-18days on market $275,000 Active 78 DOM
-
2026-06-17days on market $275,000 Active 77 DOM
-
2026-06-16days on market $275,000 Active 76 DOM
-
2026-06-15days on market $275,000 Active 75 DOM
-
2026-06-14days on market $275,000 Active 73 DOM
-
2026-06-13days on market $275,000 Active 72 DOM
-
2026-06-10days on market $275,000 Active 70 DOM
-
2026-06-09days on market $275,000 Active 69 DOM
-
2026-06-08days on market $275,000 Active 68 DOM
-
2026-06-07days on market $275,000 Active 67 DOM
-
2026-06-05days on market $275,000 Active 64 DOM
-
2026-06-03remarks 699-char remark
-
2026-06-03days on market $275,000 Active 63 DOM
-
2026-06-02days on market $275,000 Active 62 DOM
-
2026-06-01days on market $275,000 Active 61 DOM
-
2026-05-31days on market $275,000 Active 60 DOM
-
2026-05-30days on market $275,000 Active 59 DOM
-
2026-04-20price $275,000 429-char remark
Show marketing remark (429 chars)
Three bedroom, two bath home in Blythwood Estates! Energy smart home with an open floor plan with carpeted bedrooms and living room. Gas fireplace in living room. Garden tub in master bathroom with separate shower, including large walk-in closet. Double car garage. This property offers a spacious, fenced backyard great for entertaining. Additional highlights include a tankless water heater and other energy-efficient upgrades.
-
2026-04-01$275,500 Active 429-char remark
Show marketing remark (429 chars)
Three bedroom, two bath home in Blythwood Estates! Energy smart home with an open floor plan with carpeted bedrooms and living room. Gas fireplace in living room. Garden tub in master bathroom with separate shower, including large walk-in closet. Double car garage. This property offers a spacious, fenced backyard great for entertaining. Additional highlights include a tankless water heater and other energy-efficient upgrades.
-
2026-03-14$275,500 Active 429-char remark
Show marketing remark (429 chars)
Three bedroom, two bath home in Blythwood Estates! Energy smart home with an open floor plan with carpeted bedrooms and living room. Gas fireplace in living room. Garden tub in master bathroom with separate shower, including large walk-in closet. Double car garage. This property offers a spacious, fenced backyard great for entertaining. Additional highlights include a tankless water heater and other energy-efficient upgrades.
-
2013-05-29soldstatus $171,000
-
2012-02-01$171,000
-
2012-02-01$171,000
-
2008-07-24$36,000
-
2008-07-24$36,000
ⓘ Source: listings_history table (triggers on properties + properties_extension) + one-shot
backfill from property_details.listing_events for pre-trigger history.
Tax reassessment forecast LA · Resets to sale price
- Current annual tax
- $1,577 · $131/mo
- Projected year-2 tax
- $1,577 · $131/mo
- Expected delta
- $0/yr ($0/mo · 0.0%)
ⓘ Screening estimate from a state-policy table — verify with the county assessor before closing.
Climate risk First Street
- Flood 1/10 Low FEMA zone X (unshaded) · 0% chance over 30 yrs
- Wildfire 3/10 Moderate
- Heat 9/10 Extreme 7 d/yr ≥109°F today · 22 d/yr by 30 yrs out
- Wind 9/10 Extreme 99% chance of damaging wind over 30 yrs
- Air quality 2/10 Low 0 unhealthy d/yr today · 1 by 30 yrs out
Nearby sold comps map
Loading sold comps map…
Walkable amenities ~0.75 mi
Loading nearby amenities…
Taxation est. · year 1
- Rental income
- $29,830
- − Mortgage interest
- −$15,404
- − Property taxes
- −$1,577
- − Insurance
- −$1,375
- − Repairs & maintenance
- −$2,386
- − Management
- −$2,386
- − HOA
- −$264
- − Depreciation
- −$8,000
- Taxable loss
- −$1,563
- Est. tax savings @ 24.0%
- +$375
- After-tax cash flow
- $3,420/yr
For passive investors: Depreciation is non-cash, so a rental often shows a tax loss while cash-flowing — sheltering income. Rental losses are passive: they offset passive income freely, and up to $25,000/yr can offset ordinary (W-2) income if you actively participate and your MAGI is under $100k (phasing out to $0 by $150k); unused losses carry forward. On sale, claimed depreciation is recaptured at up to 25%, and gains may owe capital-gains tax (a 1031 exchange can defer both). Figures are a year-1 estimate at your 24.0% rate — not tax advice; consult a CPA.
Schools (NCES district)
- District
- Tangipahoa Parish
- NCES district ID
- 2201680
- Math proficiency
- 18% ▼ -32.00%
- Reading proficiency
- 29% ▼ -31.00%
- Median HH income
- $41,283
- Composite
- 19.94/100
- National rank
- #8676
- State rank
- #63 of 98 in LA
Livability — Hammond
- Score
- 69/100
- State rank
- #77
- US rank
- #8868
Category grades
Schools grade is shown separately in the Schools card above.
Census & demographics
- County
- Tangipahoa Parish · 85,958 people
- City population
- 51,394
- Metro
- Hammond, LA
- Population (ZIP)
- 34,564
- Household income
- $71,611
- Rent vs Own
- Severe rent burden
- 479.0
Population outlook (Tangipahoa County) Hauer SSP2
- Today (2025)
- 144,204 people
- By 2030
- 151,413 · +5.0%
- By 2040
- 164,374 · +14.0%
- By 2050
- 175,427 · +21.7%
- By 2075
- 195,165 · +35.3%
- By 2100
- 201,641 · +39.8%
Race, ethnicity, and origin ACS 2023
- Neighborhood character
- Predominantly White (73%)
- Race & ethnicity
- White 73% Black 16% Two or more races 8% Hispanic / Latino 8%
- Hispanic origin (detail)
- Mexican 2%
- Common ancestry
- Lithuanian 15% Slovak 1% Portuguese 1%
- Foreign-born
- 3% · Canada
- Languages at home
- 94% English-only · Spanish 5%
Political lean MEDSL · Tangipahoa
- 2024 margin
- Solid R (+37.4) · D 30.6% · R 68.0% · Other 1.3%
- 2008→2024 swing
- -6.5pp toward R · 2008: -30.9pp · 2024: -37.4pp
- All cycles
- 2024: R+37.4 2020: R+32.8 2016: R+32.6 2012: R+27.7 2008: R+30.9
Not yet ingested
- Civics
- —
Market trends
- HPI YoY
- ▼ -83.55%
- Current HPI
- 129.6069
- Rent YoY
- ▲ 0.66%
- Metro
- Hammond, LA
- State GDP YoY
- ▲ 3.29%
- F500 in state
- 10
Industry mix (Fortune 500 HQ in LA)
| Industry | F500 HQs | Revenue |
|---|---|---|
| Telecommunications | 2 | $23B |
|
||
| Utilities | 1 | $12B |
|
||
| Wholesale / Distribution | 1 | $5B |
|
||
| Advertising | 1 | $2B |
|
||
Price history
+663.9% since first listed9 events — show timeline
- 2026-04-20 Price Changed $275,000 AcadianaMLS
- 2026-04-20 Price Changed $275,000 GSREIN
- 2026-04-01 Listed $275,500 AcadianaMLS
- 2026-03-14 Listed $275,500 GSREIN
- 2013-05-29 Sold (MLS) $171,000 GSREIN
- 2012-02-01 Listed $171,000 AcadianaMLS
- 2012-02-01 Listed $171,000 GSREIN
- 2008-07-24 Listed $36,000 GSREIN
- 2008-07-24 Listed $36,000 AcadianaMLS
Property tax history
+0.6%/yrLatest (2025): $1,577 · +1.0% YoY. Source: county tax records.
Cash-flow waterfall
monthlySold comps — $/sqft
last 12 mo · ≤1 miLoading sold comps…