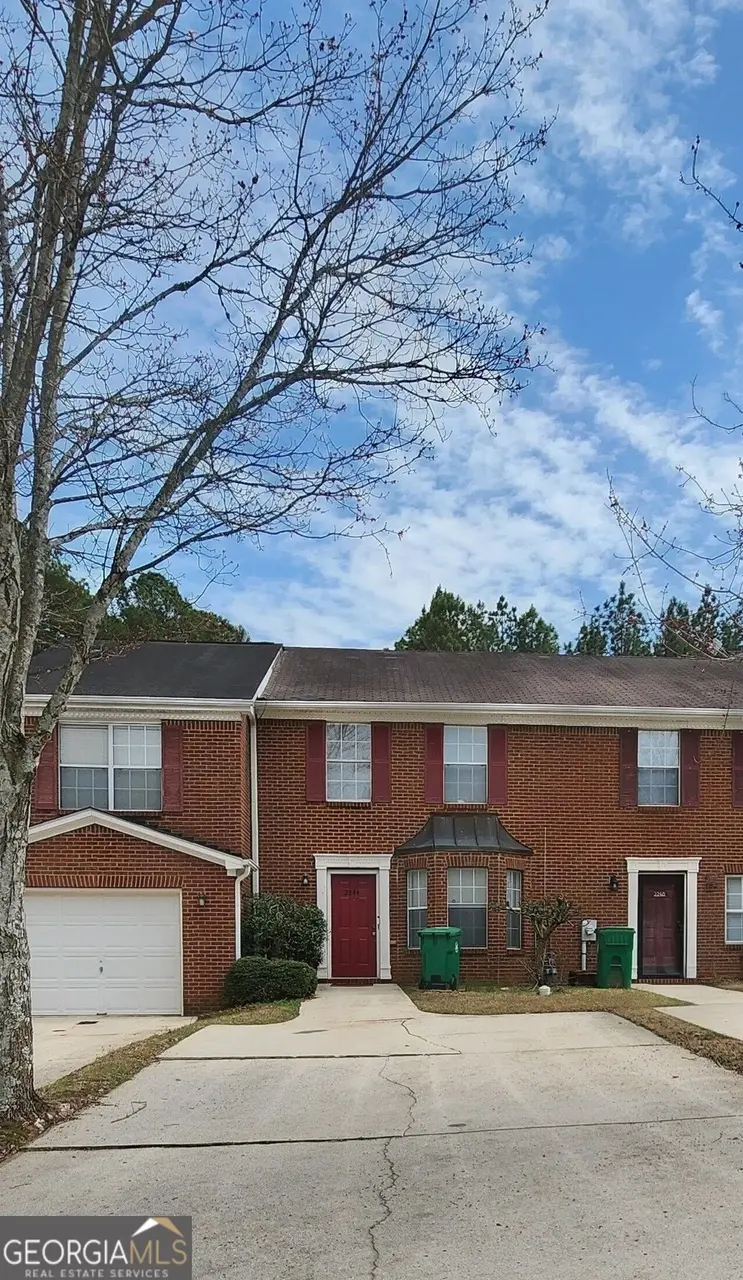
2244 Wind Rose Ct · Redan, GA
Flood risk 1/10 · Minimal
- FEMA flood zone
- X (unshaded)
- Chance of flooding over 30 yrs
- 0.0%
- Est. flood insurance / yr
- $507 – $1,088
Fire risk 1/10 · Minimal
- Est. fire insurance / yr
- $963 – $1,789
Heat risk 5/10 · Moderate
- Hot days now (above 105°F)
- 7 days/yr
- Hot days in 30 yrs
- 17 days/yr
Wind risk 5/10 · Moderate
- Chance of severe wind over 30 yrs
- 26.0%
Air-quality risk 5/10 · Moderate
- Unhealthy air days now
- 7 days/yr
- Unhealthy air days in 30 yrs
- 10 days/yr
Risk factors via First Street. Map © Google.
Why this score? — see what drove the C- grade
The composite is a weighted blend of 9 inputs, each scored 0–100. Each bar is that input's sub-score; the figure is the points it added to the 100-point composite (weight × sub-score).
- Cash flow +15.3/30.0
- ARV discount +15.0/15.0
- 1% rule +5.0/10.0
- DSCR +4.7/10.0
- Livability +3.2/5.0
- Rent growth +2.8/5.0
- Condition / age +2.5/5.0
- Schools +2.1/10.0
- Appreciation +0.0/10.0
$180,000
🖨 Deal sheet (PDF) 📄 Offer letter ✓ Due diligence
Listing remarks MLS
Perfectly situated near major commuter routes and everyday conveniences, this townhouse delivers the comfort, efficiency, and longterm value that both homeowners and investors look for. The home offers a clean, moveinready environment that minimizes upfront maintenance and supports a strong appeal. The functional layout provides versatility for daily living, while the bright living area creates a warm, inviting space to unwind after a long day. The kitchen's practical design supports easy meal prep and longterm durability. Neutral finishes throughout allow for effortless personalization, whether you're creating your own sanctuary or preparing the property for something special! Its proximity to shopping, parks, schools, and major highways enhances both lifestyle conveniences.
Key facts
- Bright living area
- Functional layout
- Neutral finishes
Tags
Neighborhood map
What this means for you Summary
Snapshot
- This is a 3-bed/2.5-bath townhouse listed at $180k.
Deal economics
- At list price, monthly cash flow is $65 ($777/yr) — positive.
- The deal already cash-flows at list — no discount required.
- To meet the 1% rule (rent ≥ 1% of price), the offer needs to be $180k (0.0% below list).
- Recommended offer: $169k (6.0% below list) — sets the bar for market timing.
- Cap rate 6.7% vs local median 5.3% in Redan — meaningfully above typical; check what's discounted (condition, days-on-market, listing class) to confirm the premium yield is real.
Location & tenants
- Location reads 64/100 on livability (#274 in GA) — a middle-class / working-renter tenant base. Strengths: cost of living A+, housing A+; Watch: crime D, amenities F, commute F.
- Dekalb County (suburban): math 19% / reading 28% proficiency, ranked #125 of 174 in GA (top 72%) — low school quality limits family demand, transient renter base, plan for 1-2y turnover; 68% free/reduced lunch — lower-income household profile, screen leases tightly.
- Market conditions: Rents rising (+1.2%/yr); 435 active listings in the ZIP; 40 comparable units currently listed for rent nearby; rentals leasing fast (median 6d on market — plan ~1-2 weeks tenant-placement turnaround); 1,240 units permitted in DeKalb County in 2024 (385 in 5+ unit buildings).
- This rent runs 35% of the median local income ($62k/yr) — at the standard rent-burdened threshold; future hikes will face affordability resistance.
Forward outlook
- Local home prices are declining (-3.0%/yr); year-one equity from $1k of loan paydown is wiped out by about $5k of value loss. Plan a longer hold.
- DeKalb County population projected at +28% by 2050 — long-run rental-demand tailwind backs the buy-and-hold thesis.
Negotiation context
- It's been on market 77 days — a 6% lower offer ($169k) is reasonable based on typical stale-listing flexibility.
- 2 sale attempts with the ask held roughly flat each time — persistent listings suggest the price (not the market) is what's stuck; bring a comps-based counter.
- Current owner paid $76k; list at $180k implies a 135% gain — meaningful room to come down on a strong offer.
Risks & watch-outs
- Climate carrying-cost: moderate wind risk, 26% chance of damaging wind over 30y; extreme-heat days projected 7→17/yr by 2055 (HVAC capex compounding) — expect insurance premiums to compound above CPI over the hold.
Questions for the listing agent
- It's been on market 77 days. Have you received any prior offers? Is the seller open to a 6% concession, seller financing, or rate buy-down credit?
- What does the HOA fee cover, when was the last increase, and are there any pending special assessments or reserve-fund shortfalls?
- Why hasn't it sold? Are there any deal-killer items the seller is aware of (foundation, flood, title, zoning, code violations)?
- Is there a deadline driving the sale (1031 exchange, divorce, estate, relocation)? That informs how much negotiation room exists.
- Schools are B-rated — typically a magnet for longer-tenancy family renters. What's the average tenant stay here, and is there a school-zone premium baked into asking?
- Crime grade is D in this area — have there been break-ins, vandalism, or insurance claims at this property in the last 3 years? What carrier currently insures it and at what premium?
- What's the average days-on-market for RENTAL listings here right now (not sales)? A rising rental-DOM trend means longer vacancies and softer asking-rent achievability than the comps imply.
- What's the recent tenant-quality profile in this submarket — average credit score on applications, eviction rate, late-payment / NSF rate, and stable-employment percentage? A property-management company in the area should have these aggregated.
- How much new for-sale + rental construction is in the pipeline within 1–3 miles? Heavy new supply typically softens prices + rents 12–24 months out; constrained supply supports both.
Investment metrics
- 1% rule
- 1.00% ✗
- Cap rate
- 6.72%
- Cash-on-cash
- 1.54%
- DSCR
- 1.07
- GRM
- 8.3
CMA / ARV
- ARV (median comp)
- $283,326
- List price
- $180,000
- Delta
- -36.47%
- Verdict
- UNDERPRICED
- Comps
- 20 within 1.0 mi
Show comp detail 12 sales within ~0.75 mi
| Address | Dist | Beds/Ba | Sqft | Sold | Price | $/sf | Match |
|---|---|---|---|---|---|---|---|
| 5723 Windfall Ln | 0.11mi | 2/2.5 (-1) | 1,372 (0%) | 2mo | $100,000 | $73 | 88 |
| 5793 Wind Gate Ln | 0.06mi | 3/2.5 | 1,272 (-7%) | 1mo | $165,000 | $130 | 84 |
| 2335 Haran Dr #51 | 0.19mi | 3/2.5 | 1,418 (+3%) | 4mo | $299,990 | $212 | 82 |
| 2343 Haran Dr #47 | 0.21mi | 3/2.5 | 1,418 (+3%) | 4mo | $299,990 | $212 | 82 |
| 2353 Haran Dr #43 | 0.22mi | 3/2.5 | 1,418 (+3%) | 3mo | $255,000 | $180 | 81 |
| 2360 Haran Dr #34 | 0.22mi | 3/2.5 | 1,418 (+3%) | 6mo | $289,990 | $205 | 79 |
| 2351 Haran Dr #44 | 0.22mi | 3/2.5 | 1,418 (+3%) | 7mo | $289,990 | $205 | 78 |
| 2355 Haran Dr #42 | 0.23mi | 3/2.5 | 1,418 (+3%) | 8mo | $294,990 | $208 | 78 |
| 2349 Haran Dr #45 | 0.22mi | 3/2.5 | 1,418 (+3%) | 9mo | $299,990 | $212 | 77 |
| 2237 Wind Rose Ct | 0.03mi | 2/2.5 (-1) | 1,272 (-7%) | 6mo | $170,000 | $134 | 77 |
| 5553 Strathmoor Manor Cir | 0.37mi | 3/2.5 | 1,340 (-2%) | 8mo | $160,727 | $120 | 72 |
| 5853 Greystone Dr | 0.15mi | 3/2.5 | 1,539 (+12%) | 3mo | $268,000 | $174 | 70 |
Match score weights: distance 35% · size 25% · config 20% · recency 20%. Top-matched comps best support the ARV.
Projected returns pro-forma
-3.0% appreciation · 1.18% rent growth · sell at horizon
- IRR
- -16.0%
- Equity multiple
- 0.44×
- Total profit
- $-28,182
- Equity at exit
- $26,839
- IRR
- -11.5%
- Equity multiple
- 0.37×
- Total profit
- $-31,641
- Equity at exit
- $15,563
Cash invested: $50,400 (down + closing). Projections, not guarantees.
Landlord ↔ Tenant lean methodology
- Overall (STATE)
- 90 Strongly Landlord-Friendly
- State Georgia
- 90 Strongly Landlord-Friendly · R+3
- County
- — inherits STATE
- City
- — inherits STATE
ZIP-level market 30058
- Home prices YoY
- -21.4%
- Rents YoY
- 1.2%
- Active inventory
- 435
- Price-to-rent
- 8.3×
Monthly cashflow live
- Estimated rent
- $1,800 high interval (Pro) →
- Mortgage (P&I)
- −$944
- Tax from tax record
- −$314 /mo · $3,767/yr
- Insurance
- −$75
- HOA
- −$24
- Vacancy / Maint / Mgmt
- −$378
- Net cashflow
- $65
Break-even live
Sensitivity live
| Price | -10% $167 | -5% $116 | +0% $65 | +5% $14 | +10% $-37 |
|---|---|---|---|---|---|
| Rent | -10% $-77 | -5% $-6 | +0% $65 | +5% $136 | +10% $207 |
| Rate | -1.0pp $155 | -0.5pp $111 | base $65 | +0.5pp $18 | +1.0pp $-29 |
UW: 25.0% down · 7.5% · 30yr · 1.5% tax · 5.0% vac · 8.0% maint · 8.0% mgmt
Financing live
Cash to close
- Down payment
- $45,000
- Closing costs
- $5,400
- Reserves months
- —
- Total cash needed
- —
Loan-product check · same deal, 3 products live
Conventional
25% down · 7.5% · 30yr
- Down + closing
- —
- Monthly P&I
- —
- Monthly cashflow
- —
- DSCR
- —
- Eligible?
- —
Personal DTI + credit; lowest rate.
DSCR
20% down · 8.5% · 30yr
- Down + closing
- —
- Monthly P&I
- —
- Monthly cashflow
- —
- DSCR
- —
- Eligible?
- —
No personal income docs; deal must DSCR.
Hard money
10% down · 12.0% · 12mo
- Down + closing
- —
- Monthly P&I
- —
- Monthly cashflow
- —
- DSCR
- —
- Eligible?
- —
Short-term bridge; refi at stabilization.
Rent comps 40 comps
| Address | Beds | Baths | Sqft | Rent | $/sqft | DOM | Units | Dist |
|---|---|---|---|---|---|---|---|---|
| 5812 Wind Gate Ln Lithonia, GA | 3.0 | 2.5 | 1372 | $1,700 | $1.24 | 44d | 1 | 0.08mi |
| 5739 Windfall Ln Lithonia, GA | 2.0 | 2.5 | 1342 | $1,625 | $1.21 | 13d | 1 | 0.11mi |
| 5720 Windfall Ln Lithonia, GA | 2.0 | 2.5 | 1372 | $1,500 | $1.09 | 44d | 1 | 0.14mi |
| 5883 Old Wellborn Trce Lithonia, GA | 3.0 | 2.0 | 1444 | $1,745 | $1.21 | 13d | 1 | 0.14mi |
| 5712 Windfall Ln Lithonia, GA | 2.0 | 2.5 | 1372 | $1,631 | $1.19 | 0d | 1 | 0.15mi |
| 5687 Windfall Ln Lithonia, GA | 2.0 | 2.0 | 1372 | $1,395 | $1.02 | 25d | 1 | 0.17mi |
| 5687 Windfall Ln Lithonia, GA | 2.0 | 2.0 | 1372 | $1,395 | $1.02 | 0d | 1 | 0.17mi |
| 5788 Calle Vista Dr Lithonia, GA | 3.0 | 2.5 | 1593 | $2,300 | $1.44 | 19d | 1 | 0.17mi |
| 5885 Wellborn Trl Lithonia, GA | 3.0 | 2.0 | 1635 | $1,950 | $1.19 | 25d | 1 | 0.18mi |
| 5663 Windfall Ln Lithonia, GA | 3.0 | 2.5 | 1272 | $1,650 | $1.30 | 25d | 1 | 0.20mi |
| 5663 Windfall Ln Lithonia, GA | 3.0 | 2.5 | 1272 | $1,650 | $1.30 | 44d | 1 | 0.20mi |
| 5749 Strathmoor Manor Cir Lithonia, GA | 2.0 | 1.5 | 1046 | $1,350 | $1.29 | 0d | 1 | 0.27mi |
| 5749 Strathmoor Manor Cir Lithonia, GA | 2.0 | 1.5 | 1046 | $1,350 | $1.29 | 6d | 1 | 0.27mi |
| 5791 Strathmoor Manor Cir Lithonia, GA | 2.0 | 2.5 | 1428 | $1,600 | $1.12 | 22d | 1 | 0.28mi |
| 5791 Strathmoor Manor Cir Lithonia, GA | 2.0 | 2.5 | 1428 | $1,600 | $1.12 | 0d | 1 | 0.28mi |
| 5811 Strathmoor Manor Cir Lithonia, GA | 2.0 | 1.5 | 1044 | $1,560 | $1.49 | 13d | 1 | 0.29mi |
| 5946 Crescent Ridge Ct Lithonia, GA | 3.0 | 2.0 | 1278 | $1,725 | $1.35 | 6d | 1 | 0.29mi |
| 5792 Strathmoor Manor Cir Lithonia, GA | 2.0 | 2.5 | 1428 | $1,700 | $1.19 | 44d | 1 | 0.31mi |
| 5798 Strathmoor Manor Cir Lithonia, GA | 3.0 | 2.5 | 1347 | $1,575 | $1.17 | 44d | 1 | 0.31mi |
| 5876 Strathmoor Manor Cir Unit 1 Lithonia, GA | 3.0 | 2.5 | 1400 | $1,295 | $0.93 | 25d | 1 | 0.32mi |
| 5823 Strathmoor Manor Cir Lithonia, GA | 3.0 | 2.5 | 1348 | $1,925 | $1.43 | 25d | 1 | 0.32mi |
| 2286 Strathmoor Manor Dr Lithonia, GA | 3.0 | 2.5 | 1348 | $1,675 | $1.24 | 2d | 1 | 0.34mi |
| 5863 Strathmoor Manor Cir Lithonia, GA | 3.0 | 2.5 | 1347 | $1,650 | $1.22 | 3d | 1 | 0.36mi |
| 6012 Wellborn Trl Lithonia, GA | 3.0 | 2.0 | 1510 | $1,760 | $1.17 | 2d | 1 | 0.40mi |
| 2136 Sara Ashley Way Lithonia, GA | 3.0 | 2.0 | 1590 | $2,200 | $1.38 | 0d | 1 | 0.45mi |
| 5625 Strathmoor Manor Cir Lithonia, GA | 3.0 | 2.5 | 1336 | $1,550 | $1.16 | 0d | 1 | 0.48mi |
| 5625 Strathmoor Manor Cir Lithonia, GA | 3.0 | 2.5 | 1336 | $1,550 | $1.16 | 3d | 1 | 0.48mi |
| 5550 Wellborn Creek Dr Lithonia, GA | 3.0 | 2.5 | 1850 | $2,085 | $1.13 | 2d | 1 | 0.50mi |
| 2325 Woodcrest Walk Lithonia, GA | 1.0–2.0 | 1.0–2.0 | 788 | $1,414 | $1.79 | 0d | 19 | 0.56mi |
| 5972 Wellborn Trce Lithonia, GA | 3.0 | 2.0 | 1820 | $1,000 | $0.55 | 13d | 1 | 0.61mi |
| 2379 Hillvale Cir Lithonia, GA | 3.0 | 2.0 | 1368 | $1,790 | $1.31 | 6d | 1 | 0.70mi |
| 2267 Cherokee Valley Dr Lithonia, GA | 3.0 | 2.0 | 1176 | $1,691 | $1.44 | 6d | 1 | 0.71mi |
| 2073 Raintree Pl Lithonia, GA | 3.0 | 2.5 | 1439 | $2,000 | $1.39 | 4d | 1 | 0.71mi |
| 2073 Raintree Pl Lithonia, GA | 3.0 | 2.5 | 1439 | $1,850 | $1.29 | 0d | 1 | 0.71mi |
| 2093 Drake Ct Lithonia, GA | 3.0 | 2.0 | 1168 | $1,604 | $1.37 | 0d | 1 | 0.73mi |
| 6162 Dana Ct Lithonia, GA | 4.0 | 3.0 | 1792 | $2,055 | $1.15 | 6d | 1 | 0.80mi |
| 6164 Saint Christophers Ct Lithonia, GA | 3.0 | 2.5 | 1340 | $1,730 | $1.29 | 21d | 1 | 0.84mi |
| 5663 Saint Thomas Dr Lithonia, GA | 4.0 | 2.0 | 1230 | $1,595 | $1.30 | 13d | 1 | 0.85mi |
| 5536 Downs Way Lithonia, GA | 3.0 | 2.0 | 1400 | $1,600 | $1.14 | 44d | 1 | 0.88mi |
| 6158 Raintree Bnd Lithonia, GA | 3.0 | 2.0 | 1429 | $1,856 | $1.30 | 6d | 1 | 0.89mi |
HOA detail
- Monthly dues
- $24 · $288/yr
Listing history 18 events
-
2026-06-18days on market $180,000 Active 77 DOM
-
2026-06-17days on market $180,000 Active 76 DOM
-
2026-06-16days on market $180,000 Active 75 DOM
-
2026-06-15days on market $180,000 Active 74 DOM
-
2026-06-13days on market $180,000 Active 72 DOM
-
2026-06-09days on market $180,000 Active 68 DOM
-
2026-06-08days on market $180,000 Active 67 DOM
-
2026-06-07days on market $180,000 Active 66 DOM
-
2026-06-04days on market $180,000 Active 63 DOM
-
2026-06-03days on market $180,000 Active 62 DOM
-
2026-06-02days on market $180,000 Active 61 DOM
-
2026-06-01days on market $180,000 Active 60 DOM
-
2026-05-31days on market $180,000 Active 59 DOM
-
2026-03-27$180,000 New 788-char remark
Show marketing remark (788 chars)
Perfectly situated near major commuter routes and everyday conveniences, this townhouse delivers the comfort, efficiency, and longterm value that both homeowners and investors look for. The home offers a clean, moveinready environment that minimizes upfront maintenance and supports a strong appeal. The functional layout provides versatility for daily living, while the bright living area creates a warm, inviting space to unwind after a long day. The kitchen's practical design supports easy meal prep and longterm durability. Neutral finishes throughout allow for effortless personalization, whether you're creating your own sanctuary or preparing the property for something special! Its proximity to shopping, parks, schools, and major highways enhances both lifestyle conveniences.
-
2025-12-15historical $1,600
-
2025-11-27$1,600
-
2015-09-09soldstatus $76,500
-
2000-03-01soldstatus $87,900
ⓘ Source: listings_history table (triggers on properties + properties_extension) + one-shot
backfill from property_details.listing_events for pre-trigger history.
Tax reassessment forecast GA · Resets to sale price
- Current annual tax
- $3,767 · $314/mo
- Projected year-2 tax
- $3,767 · $314/mo
- Expected delta
- $0/yr ($0/mo · 0.0%)
ⓘ Screening estimate from a state-policy table — verify with the county assessor before closing.
Climate risk First Street
- Flood 1/10 Low FEMA zone X (unshaded) · 0% chance over 30 yrs
- Wildfire 1/10 Low
- Heat 5/10 Major 7 d/yr ≥105°F today · 17 d/yr by 30 yrs out
- Wind 5/10 Major 26% chance of damaging wind over 30 yrs
- Air quality 5/10 Major 7 unhealthy d/yr today · 10 by 30 yrs out
Nearby sold comps map
Loading sold comps map…
Walkable amenities ~0.75 mi
Loading nearby amenities…
Taxation est. · year 1
- Rental income
- $21,595
- − Mortgage interest
- −$10,083
- − Property taxes
- −$3,767
- − Insurance
- −$900
- − Repairs & maintenance
- −$1,728
- − Management
- −$1,728
- − HOA
- −$288
- − Depreciation
- −$5,236
- Taxable loss
- −$2,135
- Est. tax savings @ 24.0%
- +$512
- After-tax cash flow
- $1,290/yr
For passive investors: Depreciation is non-cash, so a rental often shows a tax loss while cash-flowing — sheltering income. Rental losses are passive: they offset passive income freely, and up to $25,000/yr can offset ordinary (W-2) income if you actively participate and your MAGI is under $100k (phasing out to $0 by $150k); unused losses carry forward. On sale, claimed depreciation is recaptured at up to 25%, and gains may owe capital-gains tax (a 1031 exchange can defer both). Figures are a year-1 estimate at your 24.0% rate — not tax advice; consult a CPA.
Schools (NCES district)
- District
- Dekalb County
- NCES district ID
- 1301740
- Math proficiency
- 19% ▼ -12.00%
- Reading proficiency
- 28% ▼ -7.00%
- Median HH income
- $51,448
- Composite
- 20.92/100
- National rank
- #8482
- State rank
- #125 of 174 in GA
Livability — Redan
- Score
- 64/100
- State rank
- #274
- US rank
- #14766
Category grades
Schools grade is shown separately in the Schools card above.
Census & demographics
- Census place
- Redan, GA
- County
- Dekalb County · 782,738 people
- City population
- 29,279
- Metro
- Atlanta-Sandy Springs-Alpharetta, GA
- Population (ZIP)
- 62,614
- Household income
- $61,684
- Rent vs Own
- Severe rent burden
- 3471.0
Population outlook (DeKalb County) Hauer SSP2
- Today (2025)
- 839,977 people
- By 2030
- 891,768 · +6.2%
- By 2040
- 988,894 · +17.7%
- By 2050
- 1,074,583 · +27.9%
- By 2075
- 1,245,026 · +48.2%
- By 2100
- 1,303,135 · +55.1%
Race, ethnicity, and origin ACS 2023
- Neighborhood character
- Predominantly Black (91%)
- Race & ethnicity
- Black 91% Hispanic / Latino 3% White 3% Two or more races 3%
- Common ancestry
- Hispanic 0%
- Foreign-born
- 12% · Canada, United Kingdom
- Languages at home
- 93% English-only · Spanish 2% French/Haitian/Cajun 1%
Political lean MEDSL · DeKalb
- 2024 margin
- Solid D (+64.8) · D 81.9% · R 17.1% · Other 1.0%
- 2008→2024 swing
- +6.1pp toward D · 2008: 58.6pp · 2024: 64.8pp
- All cycles
- 2024: D+64.8 2020: D+67.4 2016: D+64.8 2012: D+56.8 2008: D+58.6
Not yet ingested
- Civics
- —
Market trends
- HPI YoY
- ▼ -60.90%
- Current HPI
- 224.0366
- Rent YoY
- ▲ 1.18%
- Metro
- Atlanta-Sandy Springs-Alpharetta, GA
- State GDP YoY
- ▲ 2.66%
- F500 in state
- 28
Industry mix (Fortune 500 HQ in GA)
| Industry | F500 HQs | Revenue |
|---|---|---|
| Paper / Packaging | 2 | $29B |
|
||
| Retail | 1 | $160B |
|
||
| Transportation / Logistics | 1 | $91B |
|
||
| Airlines | 1 | $62B |
|
||
| Consumer Goods | 1 | $47B |
|
||
| Utilities | 1 | $25B |
|
||
Price history
+104.8% since first listed5 events — show timeline
- 2026-03-27 Listed $180,000 GAMLS
- 2025-12-15 Rental Removed $1,600 BUILDIUM
- 2025-11-27 Listed for Rent $1,600 BUILDIUM
- 2015-09-09 Sold (Public Records) $76,500 Public Records
- 2000-03-01 Sold (Public Records) $87,900 Public Records
Property tax history
+7.8%/yrLatest (2025): $3,767 · -6.8% YoY. Source: county tax records.
Cash-flow waterfall
monthlySold comps — $/sqft
last 12 mo · ≤1 miLoading sold comps…