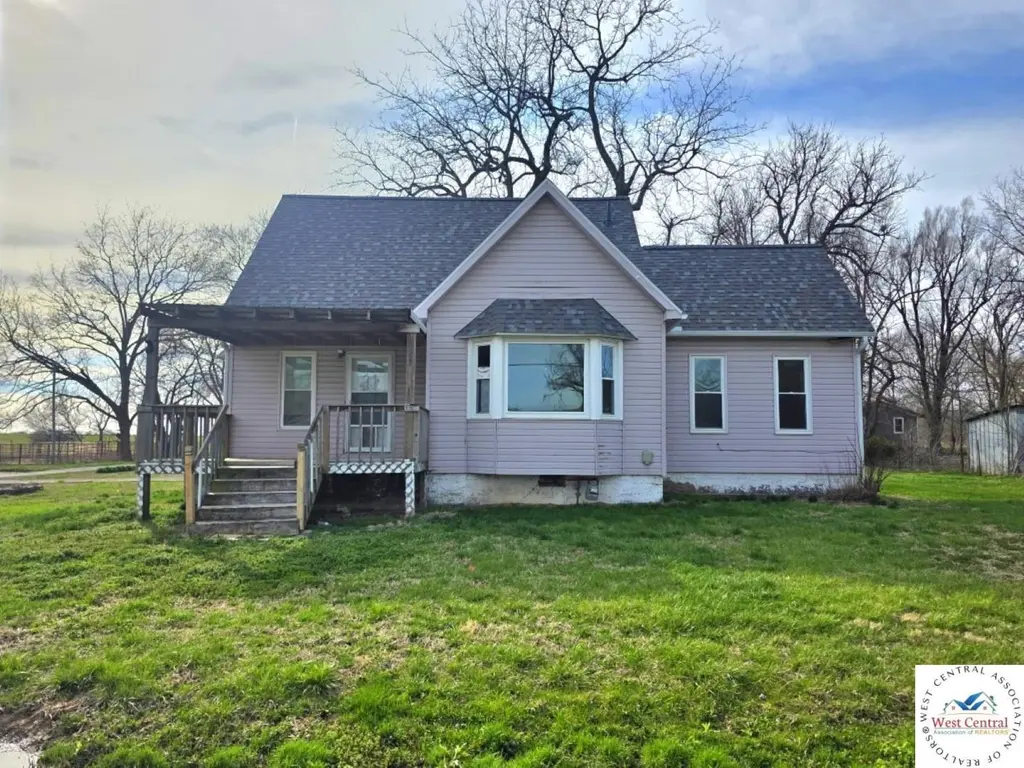
422 S Graham St · Leeton, MO
Flood risk No data
- FEMA flood zone
- —
- Chance of flooding over 30 yrs
- —
- Est. flood insurance / yr
- —
Fire risk No data
- Est. fire insurance / yr
- —
Heat risk No data
- Hot days now (above threshold)
- —
- Hot days in 30 yrs
- —
Wind risk No data
- Chance of severe wind over 30 yrs
- —
Air-quality risk No data
- Unhealthy air days now
- —
- Unhealthy air days in 30 yrs
- —
Risk factors via First Street. Map © Google.
Why this score? — see what drove the B+ grade
The composite is a weighted blend of 9 inputs, each scored 0–100. Each bar is that input's sub-score; the figure is the points it added to the 100-point composite (weight × sub-score).
- Cash flow +30.0/30.0
- 1% rule +10.0/10.0
- DSCR +10.0/10.0
- Appreciation +7.7/10.0
- ARV discount +7.5/15.0
- Schools +4.8/10.0
- Livability +2.9/5.0
- Rent growth +2.5/5.0
- Condition / age +2.5/5.0
$57,900
🖨 Deal sheet 📄 Offer letter ✓ Due diligence
Listing remarks
Looking for an opportunity to renovate and create a home that reflects your own style and vision? This 1.5-story home offers 3 bedrooms, 1 bathroom, and is situated on an impressive four city lots, providing plenty of room to expand, garden, build, or simply enjoy the extra space. Located on the edge of town, this property offers a peaceful setting while still being conveniently close to local amenities. The large lot includes separate utility connections, presenting an excellent opportunity for a future garage, workshop, or additional outbuilding. Whether you're an investor, DIY enthusiast, or buyer searching for an affordable property with potential, this home is ready for a new owner to
Key facts
- Future garage
- Peaceful setting
- Workshop
Tags
Property features AI
Finance
- HOA & community: No association fees
Exterior
- Parking: Carport and off-street parking
- Utilities: Public water; Public sewer
- Home design: Single-family residence; 1.5-story home; Faces east; Located inside city limits
- Construction: Vinyl siding; Composition roof; Approximately 101+ years old
- Exterior features: City lot on a corner; level; Paved public road access
Interior
- Kitchen: Open kitchen/dining layout
- Bedrooms: Three bedrooms — two on the main level and one on the upper level
- Flooring: Laminate and wood flooring
- Bathrooms: One full bathroom
- Heating & cooling: Forced air heating; Electric cooling
- Interior features: Kit/dining combo; Crawl space basement
- Laundry & utility: Laundry located in bathroom
Neighborhood map
What this means for you Summary
Snapshot
- This is a 3-bed/1.0-bath other listed at $58k.
Deal economics
- At list price, monthly cash flow is $582 ($7k/yr) — positive.
- The deal already cash-flows at list — no discount required.
- Meets the 1% rule at list price ($1k rent vs $58k).
Location & tenants
- Location reads 58/100 on livability (#587 in MO) — a working-class tenant base; expect higher turnover. Strengths: cost of living A+, housing A+; Watch: employment D+, crime F, amenities F.
- Leeton R-X (rural): math 55% / reading 55% proficiency, ranked #67 of 535 in MO (top 12%) — acceptable for families but not a draw, mixed tenant base, ~2y average lease.
- Zoned schools: Leeton Elem. (math 34% / reading 34%, grade F, #676 of 1,115 statewide, top 66%, 165 students, 46% FRL); Leeton High (math 24% / reading 75%, grade D+, #117 of 521 statewide, top 23%, 106 students, 47% FRL).
- Zoned-school proficiency averages 42% at this address vs 55% district-wide (-13 pts) — the specific schools serving this property underperform the Leeton R-X average; the district grade overstates school quality for this exact location.
- Market conditions: 13 active listings in the ZIP; 80 units permitted in Johnson County in 2024 (27 in 5+ unit buildings).
Forward outlook
- In year one you build about $3k of equity ($400 loan paydown + $3k appreciation (5.3% local appreciation)).
- Johnson County population projected at +6% by 2050 — modest demand growth; plan on rents tracking national, not racing it.
- At projected returns (5.3% appreciation + 3.0% rent growth), your $16k cash investment doubles in ~2 years — after that, you're playing with house money.
- By year 9, paydown + projected appreciation supports a ~$31k cash-out refi (75% LTV) — recoverable capital for the next deal without selling this one.
Negotiation context
- Only 3 days on market — expect competitive offers; lowballing is unlikely to land.
- 9 sale attempts since 7y ago with the ask held roughly flat each time — persistent listings suggest the price (not the market) is what's stuck; bring a comps-based counter.
Risks & watch-outs
- Watch-outs: built in 1920 — expect roof / HVAC / electrical / plumbing capex.
Questions for the listing agent
- Built in 1920 — when were the roof, HVAC, electrical panel, plumbing, and water heater last replaced?
- Is there a deadline driving the sale (1031 exchange, divorce, estate, relocation)? That informs how much negotiation room exists.
- Schools are B-rated — typically a magnet for longer-tenancy family renters. What's the average tenant stay here, and is there a school-zone premium baked into asking?
- Crime grade is F in this area — have there been break-ins, vandalism, or insurance claims at this property in the last 3 years? What carrier currently insures it and at what premium?
- What's the average days-on-market for RENTAL listings here right now (not sales)? A rising rental-DOM trend means longer vacancies and softer asking-rent achievability than the comps imply.
- What's the recent tenant-quality profile in this submarket — average credit score on applications, eviction rate, late-payment / NSF rate, and stable-employment percentage? A property-management company in the area should have these aggregated.
- How much new for-sale + rental construction is in the pipeline within 1–3 miles? Heavy new supply typically softens prices + rents 12–24 months out; constrained supply supports both.
Investment metrics
- 1% rule
- 2.09% ✓
- Cap rate
- 18.36%
- Cash-on-cash
- 43.09%
- DSCR
- 2.92
- GRM
- 4.0
CMA / ARV
- ARV (median comp)
- $181,047
- List price
- $57,900
- Delta
- -64.15%
- Verdict
- UNDERPRICED
- Comps
- 20 within 1.0 mi
Projected returns pro-forma
5.31% appreciation · 3.0% rent growth · sell at horizon
- IRR
- 51.6%
- Equity multiple
- 4.17×
- Total profit
- $51,468
- Equity at exit
- $33,923
- IRR
- 49.1%
- Equity multiple
- 8.59×
- Total profit
- $123,078
- Equity at exit
- $59,488
Cash invested: $16,212 (down + closing). Projections, not guarantees.
Landlord ↔ Tenant lean methodology
- Overall (STATE)
- 81 Strongly Landlord-Friendly
- State Missouri
- 81 Strongly Landlord-Friendly · R+10
- County
- — inherits STATE
- City
- — inherits STATE
ZIP-level market 64761
- Home prices YoY
- 2.5%
- Active inventory
- 13
- Price-to-rent
- 4.0×
Monthly cashflow live
- Estimated rent
- $1,211 medium interval (Pro) →
- Mortgage (P&I)
- −$304
- Tax from tax record
- −$46 /mo · $558/yr
- Insurance
- −$24
- HOA
- −$0
- Vacancy / Maint / Mgmt
- −$254
- Net cashflow
- $582
Break-even live
UW: 25.0% down · 7.5% · 30yr · 1.5% tax · 5.0% vac · 8.0% maint · 8.0% mgmt
Financing live
Cash to close
- Down payment
- $14,475
- Closing costs
- $1,737
- Reserves months
- —
- Total cash needed
- —
Loan-product check · same deal, 3 products live
Conventional
25% down · 7.5% · 30yr
- Down + closing
- —
- Monthly P&I
- —
- Monthly cashflow
- —
- DSCR
- —
- Eligible?
- —
Personal DTI + credit; lowest rate.
DSCR
20% down · 8.5% · 30yr
- Down + closing
- —
- Monthly P&I
- —
- Monthly cashflow
- —
- DSCR
- —
- Eligible?
- —
No personal income docs; deal must DSCR.
Hard money
10% down · 12.0% · 12mo
- Down + closing
- —
- Monthly P&I
- —
- Monthly cashflow
- —
- DSCR
- —
- Eligible?
- —
Short-term bridge; refi at stabilization.
Listing history 44 events
-
2026-06-19days on market $57,900 Active 3 DOM
-
2026-06-18days on market $57,900 Active 2 DOM
-
2026-06-17remarks 699-char remark
-
2026-06-17pricedays on market $57,900 Active 1 DOM
-
2026-06-08days on market $64,900 Active 82 DOM
-
2026-06-07days on market $64,900 Active 81 DOM
-
2026-06-05days on market $64,900 Active 78 DOM
-
2026-06-03days on market $64,900 Active 77 DOM
-
2026-06-02days on market $64,900 Active 76 DOM
-
2026-06-01days on market $64,900 Active 75 DOM
-
2026-05-31days on market $64,900 Active 74 DOM
-
2026-05-30days on market $64,900 Active 73 DOM
-
2026-03-10$64,900 Active 536-char remark
-
2026-01-31historical
-
2025-12-12price $64,900
-
2025-12-12price $64,900
-
2025-11-10status Active
-
2025-11-08historical
-
2025-10-21price $69,900
-
2025-10-21price $69,900
-
2025-09-09price $82,900
-
2025-09-09price $82,900
-
2025-07-31price $88,900
-
2025-07-31price $88,900
-
2025-06-14$69,900 Active
-
2025-06-13$93,900 Active
-
2025-06-13$93,900 Active
-
2023-08-17soldstatus Closed
-
2023-08-17soldstatus
-
2023-06-29status Pending
-
2023-06-20price $104,500
-
2023-05-17price $110,000
-
2023-04-18price $116,000
-
2023-03-17$120,000 Active
-
2022-06-17historical
-
2022-05-01price $11,900
-
2022-03-17$14,900 Active
-
2019-10-30soldstatus Sold
-
2019-10-30soldstatus
-
2019-09-13status Pending
-
2019-09-06$72,500 Active
-
1988-04-01soldstatus
-
1980-09-01soldstatus
-
1980-05-01soldstatus
ⓘ Source: listings_history table (triggers on properties + properties_extension) + one-shot
backfill from property_details.listing_events for pre-trigger history.
Tax reassessment forecast MO · Resets to sale price
- Current annual tax
- $558 · $46/mo
- Projected year-2 tax
- $562 · $47/mo
- Expected delta
- +$4/yr ($0/mo · 0.7%)
ⓘ Screening estimate from a state-policy table — verify with the county assessor before closing.
Nearby sold comps map
Loading sold comps map…
Walkable amenities ~0.75 mi
Loading nearby amenities…
Taxation est. · year 1
- Rental income
- $14,526
- − Mortgage interest
- −$3,243
- − Property taxes
- −$558
- − Insurance
- −$290
- − Repairs & maintenance
- −$1,162
- − Management
- −$1,162
- − Depreciation
- −$1,684
- Taxable income
- $6,428
- Est. tax owed @ 24.0%
- −$1,543
- After-tax cash flow
- $5,443/yr
For passive investors: Depreciation is non-cash, so a rental often shows a tax loss while cash-flowing — sheltering income. Rental losses are passive: they offset passive income freely, and up to $25,000/yr can offset ordinary (W-2) income if you actively participate and your MAGI is under $100k (phasing out to $0 by $150k); unused losses carry forward. On sale, claimed depreciation is recaptured at up to 25%, and gains may owe capital-gains tax (a 1031 exchange can defer both). Figures are a year-1 estimate at your 24.0% rate — not tax advice; consult a CPA.
Schools (NCES district)
- District
- Leeton R-X
- NCES district ID
- 2918360
- Math proficiency
- 55% ▬ 0.00%
- Reading proficiency
- 55% ▼ -5.00%
- Median HH income
- $46,506
- Composite
- 48.41/100
- National rank
- #4662
- State rank
- #67 of 535 in MO
Livability — Leeton
- Score
- 58/100
- State rank
- #587
- US rank
- #20850
Category grades
Schools grade is shown separately in the Schools card above.
Census & demographics
- Census place
- Leeton, MO
- Population (ZIP)
- 1,555
Population outlook (Johnson County) Hauer SSP2
- Today (2025)
- 55,794 people
- By 2030
- 56,861 · +1.9%
- By 2040
- 58,239 · +4.4%
- By 2050
- 59,168 · +6.0%
- By 2075
- 62,222 · +11.5%
- By 2100
- 60,118 · +7.7%
Race, ethnicity, and origin ACS 2023
- Neighborhood character
- Predominantly White (93%)
- Race & ethnicity
- White 93% Two or more races 5% Hispanic / Latino 1%
- Common ancestry
- Serbian 7% Romanian 2% Lithuanian 2%
- Foreign-born
- 0%
Political lean MEDSL · Johnson
- 2024 margin
- Solid R (+39.6) · D 29.5% · R 69.1% · Other 1.4%
- 2008→2024 swing
- -27.3pp toward R · 2008: -12.2pp · 2024: -39.6pp
- All cycles
- 2024: R+39.6 2020: R+36.8 2016: R+36.9 2012: R+24.2 2008: R+12.2
Not yet ingested
- Civics
- —
Market trends
- HPI YoY
- ▲ 5.31%
- Current HPI
- 220.482
- Rent YoY
- —
- Metro
- —
- State GDP YoY
- ▲ 1.84%
- F500 in state
- 20
Industry mix (Fortune 500 HQ in MO)
| Industry | F500 HQs | Revenue |
|---|---|---|
| Healthcare | 1 | $163B |
|
||
| Insurance | 1 | $21B |
|
||
| Industrial Technology | 1 | $17B |
|
||
| Retail | 1 | $16B |
|
||
| Industrial Distribution | 1 | $10B |
|
||
| Utilities | 1 | $9B |
|
||
Price history
-20.1% since first listed33 events — show timeline
- 2026-06-16 Listed $57,900 Heartland MLS as Distributed by MLS Grid
- 2026-03-10 Listed $64,900 WCAR
- 2026-01-31 Listing Removed — Heartland MLS as Distributed by MLS Grid
- 2025-12-12 Price Changed $64,900 WCAR
- 2025-12-12 Price Changed $64,900 Heartland MLS as Distributed by MLS Grid
- 2025-11-10 Relisted — Heartland MLS as Distributed by MLS Grid
- 2025-11-08 Listing Removed — Heartland MLS as Distributed by MLS Grid
- 2025-10-21 Price Changed $69,900 WCAR
- 2025-10-21 Price Changed $69,900 Heartland MLS as Distributed by MLS Grid
- 2025-09-09 Price Changed $82,900 WCAR
- 2025-09-09 Price Changed $82,900 Heartland MLS as Distributed by MLS Grid
- 2025-07-31 Price Changed $88,900 WCAR
- 2025-07-31 Price Changed $88,900 Heartland MLS as Distributed by MLS Grid
- 2025-06-14 Listed $69,900 WCAR
- 2025-06-13 Listed $93,900 WCAR
- 2025-06-13 Listed $93,900 Heartland MLS as Distributed by MLS Grid
- 2023-08-17 Sold (Public Records) — Public Records
- 2023-08-17 Sold (MLS) — Heartland MLS as Distributed by MLS Grid
- 2023-06-29 Pending — Heartland MLS as Distributed by MLS Grid
- 2023-06-20 Price Changed $104,500 Heartland MLS as Distributed by MLS Grid
- 2023-05-17 Price Changed $110,000 Heartland MLS as Distributed by MLS Grid
- 2023-04-18 Price Changed $116,000 Heartland MLS as Distributed by MLS Grid
- 2023-03-17 Listed $120,000 Heartland MLS as Distributed by MLS Grid
- 2022-06-17 Listing Removed — Heartland MLS as Distributed by MLS Grid
- 2022-05-01 Price Changed $11,900 Heartland MLS as Distributed by MLS Grid
- 2022-03-17 Listed $14,900 Heartland MLS as Distributed by MLS Grid
- 2019-10-30 Sold (Public Records) — Public Records
- 2019-10-30 Sold (MLS) — Heartland MLS as Distributed by MLS Grid
- 2019-09-13 Pending — Heartland MLS as Distributed by MLS Grid
- 2019-09-06 Listed $72,500 Heartland MLS as Distributed by MLS Grid
- 1988-04-01 Sold (Public Records) — Public Records
- 1980-09-01 Sold (Public Records) — Public Records
- 1980-05-01 Sold (Public Records) — Public Records
Property tax history
+1.9%/yrLatest (2025): $558 · +2.2% YoY. Source: county tax records.
Cash-flow waterfall
monthlySold comps — $/sqft
last 12 mo · ≤1 miLoading sold comps…