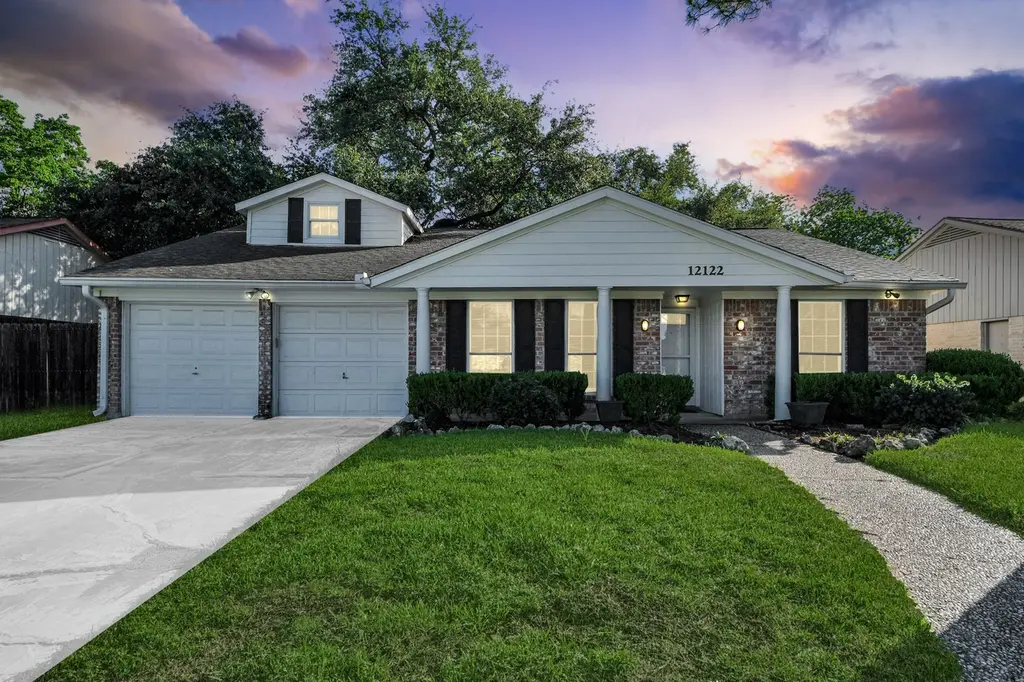
12122 Dorrance Ln · Meadows Place, TX
Flood risk 2/10 · Minimal
- FEMA flood zone
- X (unshaded)
- Chance of flooding over 30 yrs
- 0.09%
- Est. flood insurance / yr
- $507 – $1,088
Fire risk 1/10 · Minimal
- Est. fire insurance / yr
- $1,222 – $2,270
Heat risk 9/10 · Severe
- Hot days now (above 111°F)
- 7 days/yr
- Hot days in 30 yrs
- 23 days/yr
Wind risk 9/10 · Severe
- Chance of severe wind over 30 yrs
- 99.0%
Air-quality risk 2/10 · Minimal
- Unhealthy air days now
- 2 days/yr
- Unhealthy air days in 30 yrs
- 2 days/yr
Risk factors via First Street. Map © Google.
Why this score? — see what drove the D grade
The composite is a weighted blend of 9 inputs, each scored 0–100. Each bar is that input's sub-score; the figure is the points it added to the 100-point composite (weight × sub-score).
- ARV discount +15.0/15.0
- Cash flow +7.8/30.0
- Schools +4.5/10.0
- Livability +3.9/5.0
- 1% rule +3.3/10.0
- Condition / age +2.5/5.0
- Rent growth +2.1/5.0
- DSCR +1.9/10.0
- Appreciation +0.0/10.0
$230,000
🖨 Deal sheet 📄 Offer letter ✓ Due diligence
Listing remarks
This 3-bedroom, 2-bath home offers 1,828 sq ft with a traditional layout, including a formal living area that opens to a spacious family room with custom built-ins—ready for your vision. A bonus attic room provides flexible space for an office, playroom, or guest area. The expansive, shaded backyard is ideal for outdoor living and entertaining. Nestled in Meadows Place, known for its strong community feel and prime location, residents enjoy parks and playgrounds, a stocked catch-and-release lake, tennis and pickleball courts, a pool, and a community center. Convenient access to Southwest Fwy, Beltway 8, and the Westpark Tollway. Shopping, dining, and entertainment are just minutes awa
Key facts
- Formal living area
- Bonus attic room
- Custom built-ins
Tags
Property features AI
Finance
- Other: Seller disclosure available
Exterior
- Parking: Attached 2-car garage
- Utilities: Public water; Public sewer
- Home design: Residential property; Built in 1974; Single-level main living with a second-floor bonus room; Slab foundation
- Construction: Brick and wood siding exterior; Composition roof
- Exterior features: Located in a subdivision
Interior
- Kitchen: Kitchen on the first floor (approx. 10 x 7); Breakfast nook on the first floor (approx. 10 x 5); Dining room on the first floor (approx. 13 x 11)
- Bedrooms: Primary bedroom on the first floor (approx. 15 x 12); Bedroom on the first floor (approx. 13 x 10); Bedroom on the first floor (approx. 11 x 10); Bonus room on the second floor (approx. 18 x 13)
- Bathrooms: 2 full bathrooms
- Heating & cooling: Central heating (electric); Central air conditioning (electric and gas)
- Interior features: One fireplace; 8 total rooms
Neighborhood map
What this means for you Summary
Snapshot
- This is a 3-bed/2.0-bath single-family listed at $230k.
Deal economics
- At list price, monthly cash flow is $-253 ($-3k/yr) — negative.
- To cash-flow at today's rent, offer at most $185k (19.4% below list).
- To meet the 1% rule (rent ≥ 1% of price), the offer needs to be $192k (16.6% below list).
- Recommended offer: $185k (19.4% below list) — sets the bar for cash-flow.
Location & tenants
- Location reads 77/100 on livability (#80 in TX, #2,804 nationally) — a middle-class / working-renter tenant base. Strengths: employment A+, cost of living A+, housing A+; Watch: amenities F, commute F.
- Fort Bend ISD (suburban): math 44% / reading 53% proficiency, ranked #140 of 826 in TX (top 17%) — families likely to look elsewhere, expect single-tenant / working-renter base with shorter leases.
- Zoned schools: Dulles Middle (math 39% / reading 48%, grade D, #530 of 1,662 statewide, top 32%, 1,359 students, 56% FRL); Dulles H S (math 53% / reading 66%, grade C+, #275 of 1,632 statewide, top 19%, 2,364 students, 45% FRL) — zoned schools average 50% FRL vs 35% district-wide (16 pts higher); higher-poverty schools than district average — tighter screening recommended.
- Market conditions: Rents soft (-1.7%/yr); 57 active listings in the ZIP; 12 comparable units currently listed for rent nearby; rentals leasing fast (median 12d on market — plan ~1-2 weeks tenant-placement turnaround); solid renter incomes; 12,093 units permitted in Fort Bend County in 2024 (815 in 5+ unit buildings).
- This rent runs 30% of the median local income ($76k/yr) — at the standard rent-burdened threshold; future hikes will face affordability resistance.
Forward outlook
- Local home prices are declining (-3.0%/yr); year-one equity from $2k of loan paydown is wiped out by about $7k of value loss. Plan a longer hold.
- Fort Bend County population projected at +75% by 2050 — long-run rental-demand tailwind backs the buy-and-hold thesis.
Negotiation context
- Only 11 days on market — expect competitive offers; lowballing is unlikely to land.
Risks & watch-outs
- Climate carrying-cost: severe wind risk, 99% chance of damaging wind over 30y; extreme-heat days projected 7→23/yr by 2055 (HVAC capex compounding) — expect insurance premiums to compound above CPI over the hold.
Questions for the listing agent
- What do current leases actually rent for vs. the listed asking? Can we see a recent rent roll and the last 12 months of T-12 income?
- Built in 1974 — when were the roof, HVAC, electrical panel, plumbing, and water heater last replaced?
- Is there a deadline driving the sale (1031 exchange, divorce, estate, relocation)? That informs how much negotiation room exists.
- Schools are B-rated — typically a magnet for longer-tenancy family renters. What's the average tenant stay here, and is there a school-zone premium baked into asking?
- The area grade is low — what's the realistic commute time and amenity access for the typical tenant pool here? Any planned neighborhood developments (good or bad) we should know about?
- What's the average days-on-market for RENTAL listings here right now (not sales)? A rising rental-DOM trend means longer vacancies and softer asking-rent achievability than the comps imply.
- What's the recent tenant-quality profile in this submarket — average credit score on applications, eviction rate, late-payment / NSF rate, and stable-employment percentage? A property-management company in the area should have these aggregated.
- How much new for-sale + rental construction is in the pipeline within 1–3 miles? Heavy new supply typically softens prices + rents 12–24 months out; constrained supply supports both.
Investment metrics
- 1% rule
- 0.83% ✗
- Cap rate
- 4.97%
- Cash-on-cash
- -4.71%
- DSCR
- 0.79
- GRM
- 10.0
CMA / ARV
- ARV (median comp)
- $288,571
- List price
- $230,000
- Delta
- -20.30%
- Verdict
- UNDERPRICED
- Comps
- 20 within 1.0 mi
Show comp detail 12 sales within ~0.75 mi
| Address | Dist | Beds/Ba | Sqft | Sold | Price | $/sf | Match |
|---|---|---|---|---|---|---|---|
| 12122 Dorrance Ln | 0.00mi | 3/2.0 | 1,828 (0%) | 0mo | $230,000 | $126 | 100 |
| 12114 Dorrance Ln | 0.03mi | 4/2.0 (+1) | 1,824 (-0%) | 4mo | $319,900 | $175 | 90 |
| 12023 Scottsdale Dr | 0.15mi | 3/2.0 | 1,824 (-0%) | 5mo | $275,000 | $151 | 89 |
| 12239 Meadowhollow Dr | 0.29mi | 4/2.0 (+1) | 1,841 (+1%) | 1mo | $309,000 | $168 | 80 |
| 11826 Monticeto Ln | 0.56mi | 3/2.0 | 1,824 (-0%) | 0mo | $329,900 | $181 | 73 |
| 11835 Brook Meadows Ln | 0.54mi | 3/2.0 | 1,838 (+0%) | 1mo | $330,000 | $180 | 73 |
| 11906 Meadowdale Dr | 0.43mi | 4/2.0 (+1) | 1,853 (+1%) | 1mo | $334,900 | $181 | 72 |
| 11415 Chariot Dr | 0.61mi | 3/2.0 | 1,779 (-3%) | 4mo | $238,500 | $134 | 64 |
| 11510 Caesar Dr | 0.59mi | 3/2.0 | 1,705 (-7%) | 4mo | $268,000 | $157 | 58 |
| 11814 Monticeto Ln | 0.56mi | 3/2.0 | 1,632 (-11%) | 0mo | $279,900 | $172 | 56 |
| 10654 Chapel Hill Dr | 0.69mi | 3/2.5 | 1,949 (+7%) | 2mo | $223,100 | $114 | 53 |
| 10647 Chapel Hill Dr | 0.65mi | 4/2.5 (+1) | 1,950 (+7%) | 4mo | $169,000 | $87 | 48 |
Match score weights: distance 35% · size 25% · config 20% · recency 20%. Top-matched comps best support the ARV.
Projected returns pro-forma
-3.0% appreciation · 0.0% rent growth · sell at horizon
- IRR
- -28.1%
- Equity multiple
- 0.09×
- Total profit
- $-58,864
- Equity at exit
- $34,294
- IRR
- -46.7%
- Equity multiple
- -0.45×
- Total profit
- $-93,171
- Equity at exit
- $19,886
Cash invested: $64,400 (down + closing). Projections, not guarantees.
Landlord ↔ Tenant lean methodology
- Overall (STATE)
- 87 Strongly Landlord-Friendly
- State Texas
- 87 Strongly Landlord-Friendly · R+5
- County
- — inherits STATE
- City
- — inherits STATE
ZIP-level market 77477
- Home prices YoY
- -12.2%
- Rents YoY
- -1.7%
- Active inventory
- 57
- Price-to-rent
- 10.0×
Monthly cashflow live
- Estimated rent
- $1,919 high interval (Pro) →
- Mortgage (P&I)
- −$1,206
- Tax from tax record
- −$467 /mo · $5,605/yr
- Insurance
- −$96
- HOA
- −$0
- Vacancy / Maint / Mgmt
- −$403
- Net cashflow
- $-253
Break-even live
UW: 25.0% down · 7.5% · 30yr · 1.5% tax · 5.0% vac · 8.0% maint · 8.0% mgmt
Financing live
Cash to close
- Down payment
- $57,500
- Closing costs
- $6,900
- Reserves months
- —
- Total cash needed
- —
Loan-product check · same deal, 3 products live
Conventional
25% down · 7.5% · 30yr
- Down + closing
- —
- Monthly P&I
- —
- Monthly cashflow
- —
- DSCR
- —
- Eligible?
- —
Personal DTI + credit; lowest rate.
DSCR
20% down · 8.5% · 30yr
- Down + closing
- —
- Monthly P&I
- —
- Monthly cashflow
- —
- DSCR
- —
- Eligible?
- —
No personal income docs; deal must DSCR.
Hard money
10% down · 12.0% · 12mo
- Down + closing
- —
- Monthly P&I
- —
- Monthly cashflow
- —
- DSCR
- —
- Eligible?
- —
Short-term bridge; refi at stabilization.
Rent comps 12 comps
| Address | Beds | Baths | Sqft | Rent | $/sqft | DOM | Units | Dist |
|---|---|---|---|---|---|---|---|---|
| 10618 Nobility Dr Houston, TX | 4.0 | 2.5 | 2087 | $1,900 | $0.91 | 43d | 1 | 0.81mi |
| 12826 Careywood Dr Sugar Land, TX | 3.0 | 2.0 | 1836 | $2,200 | $1.20 | 11d | 1 | 1.04mi |
| 12506 Panther Place Dr Houston, TX | 3.0 | 2.5 | 1730 | $1,825 | $1.05 | 43d | 1 | 1.05mi |
| 11418 Creekhurst Dr Houston, TX | 3.0 | 2.0 | 1740 | $1,697 | $0.98 | 43d | 1 | 1.11mi |
| 10343 Huntington Place Dr Houston, TX | 3.0 | 3.0 | 1472 | $1,649 | $1.12 | 22d | 1 | 1.24mi |
| 10919 Stancliff Rd Unit 3174 Houston, TX | 3.0 | 2.0 | 1239 | $1,923 | $1.55 | 10d | 1 | 1.33mi |
| 10919 Stancliff Rd Unit 3148 Houston, TX | 3.0 | 2.0 | 1239 | $1,891 | $1.53 | 3d | 1 | 1.33mi |
| 10919 Stancliff Rd Unit 10952 Houston, TX | 3.0 | 2.0 | 1346 | $1,974 | $1.47 | 43d | 1 | 1.33mi |
| 10919 Stancliff Rd Unit 3047 Houston, TX | 3.0 | 2.0 | 1239 | $1,934 | $1.56 | 11d | 1 | 1.33mi |
| 13100 W Bellfort Ave Houston, TX | 1.0–3.0 | 1.0–2.0 | 1021 | $2,152 | $2.11 | 1d | 28 | 1.35mi |
| 9734 Clifton Park Dr Houston, TX | 3.0 | 2.5 | 1800 | $1,774 | $0.99 | 5d | 4 | 1.36mi |
| 2414 Chelston Ct Sugar Land, TX | 3.0 | 2.0 | 1736 | $2,198 | $1.27 | 3d | 1 | 1.44mi |
Listing history 3 events
-
2026-05-17status Pending 701-char remark
-
2026-05-08status Pending 701-char remark
-
2026-05-05$230,000 Active 701-char remark
ⓘ Source: listings_history table (triggers on properties + properties_extension) + one-shot
backfill from property_details.listing_events for pre-trigger history.
Tax reassessment forecast TX · Resets to sale price
- Current annual tax
- $5,605 · $467/mo
- Projected year-2 tax
- $5,605 · $467/mo
- Expected delta
- $0/yr ($0/mo · 0.0%)
ⓘ Screening estimate from a state-policy table — verify with the county assessor before closing.
Climate risk First Street
- Flood 2/10 Low FEMA zone X (unshaded) · 9% chance over 30 yrs
- Wildfire 1/10 Low
- Heat 9/10 Extreme 7 d/yr ≥111°F today · 23 d/yr by 30 yrs out
- Wind 9/10 Extreme 99% chance of damaging wind over 30 yrs
- Air quality 2/10 Low 2 unhealthy d/yr today · 2 by 30 yrs out
Nearby sold comps map
Loading sold comps map…
Walkable amenities ~0.75 mi
Loading nearby amenities…
Taxation est. · year 1
- Rental income
- $23,029
- − Mortgage interest
- −$12,884
- − Property taxes
- −$5,605
- − Insurance
- −$1,150
- − Repairs & maintenance
- −$1,842
- − Management
- −$1,842
- − Depreciation
- −$6,691
- Taxable loss
- −$6,984
- Est. tax savings @ 24.0%
- +$1,676
- After-tax cash flow
- $-1,359/yr
For passive investors: Depreciation is non-cash, so a rental often shows a tax loss while cash-flowing — sheltering income. Rental losses are passive: they offset passive income freely, and up to $25,000/yr can offset ordinary (W-2) income if you actively participate and your MAGI is under $100k (phasing out to $0 by $150k); unused losses carry forward. On sale, claimed depreciation is recaptured at up to 25%, and gains may owe capital-gains tax (a 1031 exchange can defer both). Figures are a year-1 estimate at your 24.0% rate — not tax advice; consult a CPA.
Schools (NCES district)
- District
- Fort Bend ISD
- NCES district ID
- 4819650
- Math proficiency
- 44% ▼ -15.00%
- Reading proficiency
- 53% ▼ -4.00%
- Median HH income
- $82,360
- Composite
- 44.61/100
- National rank
- #2779
- State rank
- #140 of 826 in TX
Livability — Meadows Place
- Score
- 77/100
- State rank
- #80
- US rank
- #2804
Category grades
Schools grade is shown separately in the Schools card above.
Census & demographics
- Census place
- Meadows Place, TX
- County
- Fort Bend County · 836,777 people
- Metro
- Houston-The Woodlands-Sugar Land, TX
- Population (ZIP)
- 33,752
- Household income
- $75,744
- Rent vs Own
- Severe rent burden
- 1461.0
Population outlook (Fort Bend County) Hauer SSP2
- Today (2025)
- 1,004,526 people
- By 2030
- 1,153,104 · +14.8%
- By 2040
- 1,453,718 · +44.7%
- By 2050
- 1,753,781 · +74.6%
- By 2075
- 2,455,772 · +144.5%
- By 2100
- 2,930,528 · +191.7%
Race, ethnicity, and origin ACS 2023
- Neighborhood character
- Highly diverse neighborhood (Simpson 0.76)
- Race & ethnicity
- Black 28% Hispanic / Latino 26% Asian 24% White 18% Two or more races 12% Native American 1%
- Hispanic origin (detail)
- Mexican 20%
- Common ancestry
- Romanian 1% Lithuanian 1% Italian 1%
- Foreign-born
- 33% · Canada, China, Vietnam
- Languages at home
- 54% English-only · Spanish 20% Other Indo-European 7% Other Asian/Pacific 7%
Political lean MEDSL · Fort Bend
- 2024 margin
- Toss-up / Even · D 49.5% · R 47.9% · Other 2.6%
- 2008→2024 swing
- +4.0pp toward D · 2008: -2.4pp · 2024: 1.6pp
- All cycles
- 2024: D+1.6 2020: D+10.6 2016: D+6.6 2012: R+6.8 2008: R+2.4
Not yet ingested
- Civics
- —
Market trends
- HPI YoY
- ▼ -37.74%
- Current HPI
- 271.6488
- Rent YoY
- ▼ -1.68%
- Metro
- Houston-The Woodlands-Sugar Land, TX
- State GDP YoY
- ▲ 3.95%
- F500 in state
- 110
Industry mix (Fortune 500 HQ in TX)
| Industry | F500 HQs | Revenue |
|---|---|---|
| Energy | 16 | $1,198B |
|
||
| Technology | 5 | $198B |
|
||
| Engineering / Construction | 4 | $72B |
|
||
| Energy Services | 3 | $60B |
|
||
| Utilities | 3 | $41B |
|
||
| Healthcare | 2 | $330B |
|
||
Price history
4 events — show timeline
- 2026-06-08 Sold (MLS) — HARMLS
- 2026-05-17 Pending — HARMLS
- 2026-05-08 Pending — HARMLS
- 2026-05-05 Listed $230,000 HARMLS
Property tax history
+3.1%/yrLatest (2025): $5,605 · -10.6% YoY. Source: county tax records.
Cash-flow waterfall
monthlySold comps — $/sqft
last 12 mo · ≤1 miLoading sold comps…