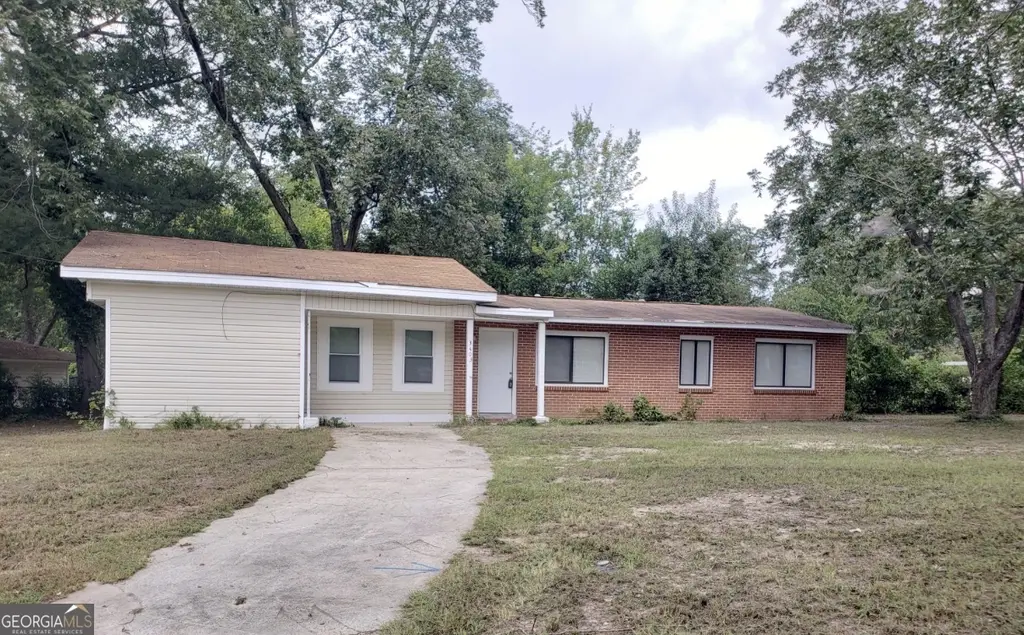
3403 Tamplin Ter · Macon-Bibb County, GA
Flood risk 1/10 · Minimal
- FEMA flood zone
- X (unshaded)
- Chance of flooding over 30 yrs
- 0.0%
- Est. flood insurance / yr
- $507 – $1,088
Fire risk 1/10 · Minimal
- Est. fire insurance / yr
- $963 – $1,789
Heat risk 7/10 · Major
- Hot days now (above 109°F)
- 7 days/yr
- Hot days in 30 yrs
- 17 days/yr
Wind risk 6/10 · Moderate
- Chance of severe wind over 30 yrs
- 66.0%
Air-quality risk 3/10 · Minor
- Unhealthy air days now
- 3 days/yr
- Unhealthy air days in 30 yrs
- 4 days/yr
Risk factors via First Street. Map © Google.
Why this score? — see what drove the B- grade
The composite is a weighted blend of 9 inputs, each scored 0–100. Each bar is that input's sub-score; the figure is the points it added to the 100-point composite (weight × sub-score).
- Cash flow +27.4/30.0
- ARV discount +13.7/15.0
- DSCR +9.6/10.0
- 1% rule +6.7/10.0
- Rent growth +3.8/5.0
- Livability +2.5/5.0
- Condition / age +2.5/5.0
- Schools +1.2/10.0
- Appreciation +0.0/10.0
$100,000
🖨 Deal sheet 📄 Offer letter ✓ Due diligence
Listing remarks MLS
ATTENTION INVESTORS!! Occupied property with longterm tenant. 3 Bedroom/1Bath with large bonus room that could be 4th Bedroom. New Roof (2025), Large level backyard yard. Near Southwest High School and and Macon Mall. Occupied, Do Not disturb tenant. Call listing agent for more details.
Key facts
- Large bonus room
- Large level backyard
- New roof
Tags
Neighborhood map
What this means for you Summary
Snapshot
- This is a 3-bed/1.0-bath single-family listed at $100k.
Deal economics
- At list price, monthly cash flow is $294 ($4k/yr) — positive.
- The deal already cash-flows at list — no discount required.
- Meets the 1% rule at list price ($1k rent vs $100k).
- Recommended offer: $97k (3.0% below list) — sets the bar for market timing.
- Cap rate 9.8% vs local median 5.4% in Macon-Bibb County — top-decile yield for the area; either an underpriced asset or a hidden risk that comps aren't pricing in. Stress-test before assuming the spread holds.
Location & tenants
- Location reads: area grade B — affects rentability + tenant quality, not the cash-flow math above.
- Bibb County (urban): math 11% / reading 18% proficiency, ranked #161 of 174 in GA (top 92%) — low school quality limits family demand, transient renter base, plan for 1-2y turnover; 75% free/reduced lunch — lower-income household profile, screen leases tightly.
- Market conditions: Rents rising fast (+5.0%/yr); 207 active listings in the ZIP; 33 comparable units currently listed for rent nearby; rentals lingering (median 44d on market — plan ~5-8 weeks vacancy on turnover, expect pricing pressure); 58% of comp listings sitting > 30 days — soft ceiling on asking rent; lower-income renter base — watch delinquency; 154 units permitted in Bibb County in 2024 (0 in 5+ unit buildings).
- At $1,165/mo this rent would consume 47% of the median local household income ($30k/yr) (locally 1335% of renters already pay >50% of income on rent) — very limited rent-growth headroom before tenants either downsize or default.
Forward outlook
- Local home prices are declining (-3.0%/yr); year-one equity from $691 of loan paydown is wiped out by about $3k of value loss. Plan a longer hold.
- Bibb County population projected at -12% by 2050 — secular population decline; favor cash flow + early exit over multi-decade hold.
- At projected returns (-3.0% appreciation + 5.0% rent growth), your $28k cash investment doubles in ~8 years — after that, you're playing with house money.
Negotiation context
- It's been on market 51 days — a 3% lower offer ($97k) is reasonable based on typical stale-listing flexibility.
- 7 sale attempts since 3y ago; this cycle's ask has dropped $8k (7%) from the opening price — seller is motivated, your offer sets the floor, not the list.
- Current owner paid $85k; 18% above their basis — modest negotiation headroom, anchor on the comps not their cost.
Risks & watch-outs
- Watch-outs: built in 1956 — expect roof / HVAC / electrical / plumbing capex.
- Climate carrying-cost: major wind risk, 66% chance of damaging wind over 30y; extreme-heat days projected 7→17/yr by 2055 (HVAC capex compounding) — expect insurance premiums to compound above CPI over the hold.
Questions for the listing agent
- It's been on market 51 days. Have you received any prior offers? Is the seller open to a 3% concession, seller financing, or rate buy-down credit?
- Built in 1956 — when were the roof, HVAC, electrical panel, plumbing, and water heater last replaced?
- Is there a deadline driving the sale (1031 exchange, divorce, estate, relocation)? That informs how much negotiation room exists.
- What's the average days-on-market for RENTAL listings here right now (not sales)? A rising rental-DOM trend means longer vacancies and softer asking-rent achievability than the comps imply.
- What's the recent tenant-quality profile in this submarket — average credit score on applications, eviction rate, late-payment / NSF rate, and stable-employment percentage? A property-management company in the area should have these aggregated.
- How much new for-sale + rental construction is in the pipeline within 1–3 miles? Heavy new supply typically softens prices + rents 12–24 months out; constrained supply supports both.
Investment metrics
- 1% rule
- 1.17% ✓
- Cap rate
- 9.82%
- Cash-on-cash
- 12.59%
- DSCR
- 1.56
- GRM
- 7.2
CMA / ARV
- ARV (median comp)
- $115,898
- List price
- $100,000
- Delta
- -13.72%
- Verdict
- UNDERPRICED
- Comps
- 9 within 2.0 mi
Show comp detail 12 sales within ~0.75 mi
| Address | Dist | Beds/Ba | Sqft | Sold | Price | $/sf | Match |
|---|---|---|---|---|---|---|---|
| 3357 Placid Pl | 0.24mi | 4/2.0 (+1) | 1,373 (-3%) | 2mo | $150,000 | $109 | 74 |
| 1464 Williamson Rd | 0.22mi | 3/1.0 | 1,300 (-8%) | 4mo | $64,000 | $49 | 72 |
| 3339 Markwood Dr | 0.35mi | 3/2.0 | 1,345 (-5%) | 6mo | $133,000 | $99 | 66 |
| 1504 Berkshire Dr | 0.49mi | 3/2.0 | 1,455 (+3%) | 6mo | $117,000 | $80 | 64 |
| 1801 Winston Dr | 0.73mi | 3/1.0 | 1,432 (+1%) | 2mo | $86,900 | $61 | 62 |
| 3935 Travis Blvd | 0.50mi | 3/2.0 | 1,344 (-5%) | 4mo | $115,000 | $86 | 61 |
| 3970 Emory Dr | 0.69mi | 3/2.0 | 1,394 (-2%) | 1mo | $27,000 | $19 | 60 |
| 3819 Frances Dr | 0.40mi | 4/1.0 (+1) | 1,293 (-9%) | 6mo | $68,000 | $53 | 57 |
| 1664 Randall Rd | 0.22mi | 3/2.0 | 1,212 (-14%) | 5mo | $70,000 | $58 | 57 |
| 1792 Winston Dr | 0.71mi | 3/1.0 | 1,323 (-7%) | 2mo | $93,500 | $71 | 54 |
| 1820 Sussex Dr | 0.71mi | 3/1.5 | 1,590 (+12%) | 3mo | $85,000 | $53 | 42 |
| 4055 Emory Dr | 0.74mi | 3/1.0 | 1,216 (-14%) | 2mo | $58,000 | $48 | 40 |
Match score weights: distance 35% · size 25% · config 20% · recency 20%. Top-matched comps best support the ARV.
Projected returns pro-forma
-3.0% appreciation · 5.03% rent growth · sell at horizon
- IRR
- 4.4%
- Equity multiple
- 1.18×
- Total profit
- $4,917
- Equity at exit
- $14,910
- IRR
- 15.6%
- Equity multiple
- 2.38×
- Total profit
- $38,676
- Equity at exit
- $8,646
Cash invested: $28,000 (down + closing). Projections, not guarantees.
Landlord ↔ Tenant lean methodology
- Overall (STATE)
- 90 Strongly Landlord-Friendly
- State Georgia
- 90 Strongly Landlord-Friendly · R+3
- County
- — inherits STATE
- City
- — inherits STATE
ZIP-level market 31206
- Rents YoY
- 5.0%
- Active inventory
- 207
- Price-to-rent
- 7.2×
Monthly cashflow live
- Estimated rent
- $1,165 high interval (Pro) →
- Mortgage (P&I)
- −$524
- Tax from tax record
- −$60 /mo · $726/yr
- Insurance
- −$42
- HOA
- −$0
- Vacancy / Maint / Mgmt
- −$245
- Net cashflow
- $294
Break-even live
UW: 25.0% down · 7.5% · 30yr · 1.5% tax · 5.0% vac · 8.0% maint · 8.0% mgmt
Financing live
Cash to close
- Down payment
- $25,000
- Closing costs
- $3,000
- Reserves months
- —
- Total cash needed
- —
Loan-product check · same deal, 3 products live
Conventional
25% down · 7.5% · 30yr
- Down + closing
- —
- Monthly P&I
- —
- Monthly cashflow
- —
- DSCR
- —
- Eligible?
- —
Personal DTI + credit; lowest rate.
DSCR
20% down · 8.5% · 30yr
- Down + closing
- —
- Monthly P&I
- —
- Monthly cashflow
- —
- DSCR
- —
- Eligible?
- —
No personal income docs; deal must DSCR.
Hard money
10% down · 12.0% · 12mo
- Down + closing
- —
- Monthly P&I
- —
- Monthly cashflow
- —
- DSCR
- —
- Eligible?
- —
Short-term bridge; refi at stabilization.
Rent comps 33 comps
| Address | Beds | Baths | Sqft | Rent | $/sqft | DOM | Units | Dist |
|---|---|---|---|---|---|---|---|---|
| 3685 Rice Mill Rd Macon, GA | 3.0 | 1.0 | 1152 | $1,450 | $1.26 | 43d | 1 | 0.26mi |
| 3837 Spencer Cir Macon, GA | 3.0 | 1.0 | 1080 | $1,300 | $1.20 | 43d | 1 | 0.30mi |
| 3080 Rice Mill Rd Macon, GA | 3.0 | 1.0 | 1100 | $950 | $0.86 | 43d | 1 | 0.36mi |
| 3080 Rice Mill Rd Unit C-1 Macon, GA | 3.0 | 1.5 | 1100 | $925 | $0.84 | 21d | 1 | 0.36mi |
| 1164 Newberg Ave Macon, GA | 3.0 | 1.0 | 1100 | $1,195 | $1.09 | 43d | 1 | 0.41mi |
| 3238 Somerset Dr Macon, GA | 3.0 | 1.0 | 1100 | $975 | $0.89 | 13d | 1 | 0.45mi |
| 3149 Somerset Dr Macon, GA | 2.0 | 1.0 | 897 | $745 | $0.83 | 43d | 1 | 0.47mi |
| 3823 Saint Charles Pl Macon, GA | 3.0 | 1.0 | 1020 | $1,150 | $1.13 | 43d | 1 | 0.48mi |
| 1575 Winston Dr Macon, GA | 3.0 | 2.0 | 1215 | $1,350 | $1.11 | 21d | 1 | 0.65mi |
| 4028 Saint Charles Pl Macon, GA | 3.0 | 1.0 | 900 | $800 | $0.89 | 21d | 1 | 0.70mi |
| 1148 N Beddingfield Dr Macon, GA | 3.0 | 1.0 | 1076 | $825 | $0.77 | 43d | 1 | 0.75mi |
| 1868 Sussex Dr Macon, GA | 3.0 | 2.0 | 1450 | $1,500 | $1.03 | 43d | 1 | 0.78mi |
| 1289 Rocky Creek Rd Macon, GA | 2.0 | 1.0 | 1404 | $750 | $0.53 | 43d | 1 | 0.83mi |
| 837 Newberg Ave Macon, GA | 3.0 | 1.0 | 966 | $750 | $0.78 | 43d | 1 | 0.87mi |
| 1156 Triple Hill Dr Macon, GA | 2.0 | 1.0 | 980 | $875 | $0.89 | 13d | 1 | 0.88mi |
| 1332 Hillridge Dr Macon, GA | 3.0 | 2.0 | 1050 | $1,050 | $1.00 | 13d | 1 | 0.91mi |
| 1240 Rocky Creek Rd Unit A Macon, GA | 4.0 | 1.0 | 1342 | $1,090 | $0.81 | 21d | 1 | 0.91mi |
| 2445 Lowe St Macon, GA | 2.0 | 1.0 | 940 | $890 | $0.95 | 43d | 1 | 0.94mi |
| 3733 Lindsey Dr Macon, GA | 3.0 | 2.0 | 1645 | $1,350 | $0.82 | 13d | 1 | 1.02mi |
| 846 Bedingfield Ave Macon, GA | 3.0 | 1.5 | 1187 | $975 | $0.82 | 43d | 1 | 1.03mi |
| 4052 Mikado Ave Macon, GA | 3.0 | 1.0 | 1624 | $1,300 | $0.80 | 13d | 1 | 1.09mi |
| 832 Richmond St Macon, GA | 3.0 | 1.0 | 1364 | $925 | $0.68 | 21d | 1 | 1.12mi |
| 947 Troupe St Macon, GA | 2.0 | 2.0 | 1699 | $1,200 | $0.71 | 21d | 1 | 1.13mi |
| 947 Troupe St Unit B Macon, GA | 2.0 | 2.0 | 1699 | $1,200 | $0.71 | 43d | 1 | 1.13mi |
| 3423 Flamingo Dr Macon, GA | 3.0 | 1.0 | 1048 | $895 | $0.85 | 43d | 1 | 1.20mi |
| 3257 Ohara Dr S Macon, GA | 3.0 | 1.0 | 1352 | $1,125 | $0.83 | 21d | 1 | 1.23mi |
| 3709 Flamingo Dr Macon, GA | 3.0 | 1.0 | 1360 | $1,300 | $0.96 | 43d | 1 | 1.24mi |
| 645 Rutherford Ave Macon, GA | 4.0 | 2.0 | 1481 | $1,395 | $0.94 | 43d | 1 | 1.28mi |
| 728 Key St Macon, GA | 4.0 | 1.5 | 1210 | $1,200 | $0.99 | 21d | 1 | 1.39mi |
| 558 Cleveland St Macon, GA | 2.0 | 1.0 | 924 | $925 | $1.00 | 43d | 1 | 1.40mi |
| 4322 Mikado Ave Macon, GA | 3.0 | 2.0 | 1344 | $1,230 | $0.92 | 21d | 1 | 1.43mi |
| 1782 Eveline Ave Macon, GA | 3.0 | 1.0 | 900 | $1,050 | $1.17 | 43d | 1 | 1.43mi |
| 806 Armory Dr Unit B Macon, GA | 3.0 | 1.0 | 1100 | $975 | $0.89 | 43d | 1 | 1.50mi |
Listing history 21 events
-
2026-03-31historical
-
2026-03-19price $100,000
-
2026-01-29price $104,000
-
2025-12-05$100,000 New 287-char remark
Show marketing remark (287 chars)
ATTENTION INVESTORS!! Occupied property with longterm tenant. 3 Bedroom/1Bath with large bonus room that could be 4th Bedroom. New Roof (2025), Large level backyard yard. Near Southwest High School and and Macon Mall. Occupied, Do Not disturb tenant. Call listing agent for more details.
-
2025-12-05$108,000 New
Show marketing remark (287 chars)
ATTENTION INVESTORS!! Occupied property with longterm tenant. 3 Bedroom/1Bath with large bonus room that could be 4th Bedroom. New Roof (2025), Large level backyard yard. Near Southwest High School and and Macon Mall. Occupied, Do Not disturb tenant. Call listing agent for more details.
-
2025-03-03status Pending
-
2025-03-03soldstatus $85,000
-
2025-02-28soldstatus $85,000 Closed
-
2025-02-28soldstatus $83,000 Sold
-
2025-02-19status Under Contract
-
2025-02-19historical Active Under Contract
-
2024-12-22status Active
-
2024-12-22status Back On Market
-
2024-11-11status Under Contract
-
2024-11-11historical Active Under Contract
-
2024-09-29$90,000 Active
-
2024-09-29$90,000 New
-
2023-10-01historical $1,100
-
2023-09-16price $1,100
-
2023-09-10$1,200
-
2005-04-20soldstatus $47,100
ⓘ Source: listings_history table (triggers on properties + properties_extension) + one-shot
backfill from property_details.listing_events for pre-trigger history.
Tax reassessment forecast GA · Resets to sale price
- Current annual tax
- $726 · $60/mo
- Projected year-2 tax
- $920 · $77/mo
- Expected delta
- +$194/yr (+$16/mo · 26.7%)
ⓘ Screening estimate from a state-policy table — verify with the county assessor before closing.
Climate risk First Street
- Flood 1/10 Low FEMA zone X (unshaded) · 0% chance over 30 yrs
- Wildfire 1/10 Low
- Heat 7/10 Severe 7 d/yr ≥109°F today · 17 d/yr by 30 yrs out
- Wind 6/10 Major 66% chance of damaging wind over 30 yrs
- Air quality 3/10 Moderate 3 unhealthy d/yr today · 4 by 30 yrs out
Nearby sold comps map
Loading sold comps map…
Walkable amenities ~0.75 mi
Loading nearby amenities…
Taxation est. · year 1
- Rental income
- $13,981
- − Mortgage interest
- −$5,602
- − Property taxes
- −$726
- − Insurance
- −$500
- − Repairs & maintenance
- −$1,118
- − Management
- −$1,118
- − Depreciation
- −$2,909
- Taxable income
- $2,008
- Est. tax owed @ 24.0%
- −$482
- After-tax cash flow
- $3,044/yr
For passive investors: Depreciation is non-cash, so a rental often shows a tax loss while cash-flowing — sheltering income. Rental losses are passive: they offset passive income freely, and up to $25,000/yr can offset ordinary (W-2) income if you actively participate and your MAGI is under $100k (phasing out to $0 by $150k); unused losses carry forward. On sale, claimed depreciation is recaptured at up to 25%, and gains may owe capital-gains tax (a 1031 exchange can defer both). Figures are a year-1 estimate at your 24.0% rate — not tax advice; consult a CPA.
Schools (NCES district)
- District
- Bibb County
- NCES district ID
- 1300420
- Math proficiency
- 11% ▼ -14.00%
- Reading proficiency
- 18% ▼ -11.00%
- Median HH income
- $37,426
- Composite
- 12.13/100
- National rank
- #9654
- State rank
- #161 of 174 in GA
Livability — Macon-Bibb County
No livability data for this city. (Only ~50 U.S. cities are tracked.)
Census & demographics
- Census place
- Macon-Bibb County, GA
- County
- Bibb County · 164,332 people
- City population
- 143,186
- Metro
- Macon-Bibb County, GA
- Population (ZIP)
- 24,310
- Household income
- $30,042
- Rent vs Own
- Severe rent burden
- 1335.0
Population outlook (Bibb County) Hauer SSP2
- Today (2025)
- 148,772 people
- By 2030
- 145,904 · -1.9%
- By 2040
- 139,404 · -6.3%
- By 2050
- 131,603 · -11.5%
- By 2075
- 111,050 · -25.4%
- By 2100
- 83,346 · -44.0%
Race, ethnicity, and origin ACS 2023
- Neighborhood character
- Predominantly Black (76%)
- Race & ethnicity
- Black 76% White 12% Hispanic / Latino 8% Two or more races 4%
- Hispanic origin (detail)
- Mexican 5% Puerto Rican 1%
- Common ancestry
- Lithuanian 1% Italian 1%
- Foreign-born
- 4% · Canada
- Languages at home
- 91% English-only · Spanish 8%
Political lean MEDSL · Bibb
- 2024 margin
- Strong D (+22.4) · D 61.0% · R 38.5%
- 2008→2024 swing
- +4.4pp toward D · 2008: 18.0pp · 2024: 22.4pp
- All cycles
- 2024: D+22.4 2020: D+23.8 2016: D+20.2 2012: D+20.0 2008: D+18.0
Not yet ingested
- Civics
- —
Market trends
- HPI YoY
- ▼ -80.17%
- Current HPI
- 148.6765
- Rent YoY
- ▲ 5.03%
- Metro
- Macon-Bibb County, GA
- State GDP YoY
- ▲ 2.66%
- F500 in state
- 28
Industry mix (Fortune 500 HQ in GA)
| Industry | F500 HQs | Revenue |
|---|---|---|
| Paper / Packaging | 2 | $29B |
|
||
| Retail | 1 | $160B |
|
||
| Transportation / Logistics | 1 | $91B |
|
||
| Airlines | 1 | $62B |
|
||
| Consumer Goods | 1 | $47B |
|
||
| Utilities | 1 | $25B |
|
||
Price history
+112.3% since first listed21 events — show timeline
- 2026-03-31 Listing Removed — GAMLS
- 2026-03-19 Price Changed $100,000 GAMLS
- 2026-01-29 Price Changed $104,000 GAMLS
- 2025-12-05 Listed $108,000 GAMLS
- 2025-12-05 Listed $100,000 GAMLS
- 2025-03-03 Pending — FMLS
- 2025-03-03 Sold (Public Records) $85,000 Public Records
- 2025-02-28 Sold (MLS) $83,000 GAMLS
- 2025-02-28 Sold (MLS) $85,000 FMLS
- 2025-02-19 Pending — GAMLS
- 2025-02-19 Contingent — FMLS
- 2024-12-22 Relisted — FMLS
- 2024-12-22 Relisted — GAMLS
- 2024-11-11 Pending — GAMLS
- 2024-11-11 Contingent — FMLS
- 2024-09-29 Listed $90,000 GAMLS
- 2024-09-29 Listed $90,000 FMLS
- 2023-10-01 Rental Removed $1,100 APPFOLIO
- 2023-09-16 Price Changed $1,100 APPFOLIO
- 2023-09-10 Listed for Rent $1,200 APPFOLIO
- 2005-04-20 Sold (Public Records) $47,100 Public Records
Property tax history
+8.8%/yrLatest (2025): $726 · -1.3% YoY. Source: county tax records.
Cash-flow waterfall
monthlySold comps — $/sqft
last 12 mo · ≤1 miLoading sold comps…