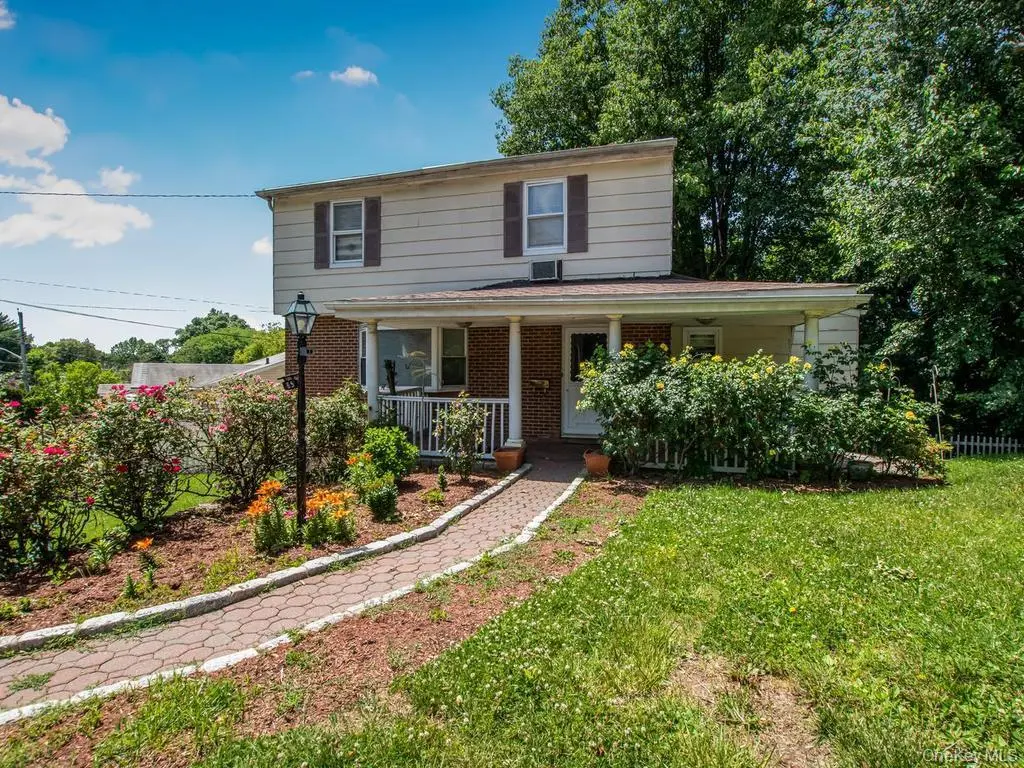
65 Sunset Dr · Yonkers, NY
Flood risk 1/10 · Minimal
- FEMA flood zone
- X (unshaded)
- Chance of flooding over 30 yrs
- 0.0%
- Est. flood insurance / yr
- $473 – $860
Fire risk 2/10 · Minimal
- Est. fire insurance / yr
- $691 – $1,283
Heat risk 6/10 · Moderate
- Hot days now (above 99°F)
- 7 days/yr
- Hot days in 30 yrs
- 14 days/yr
Wind risk 6/10 · Moderate
- Chance of severe wind over 30 yrs
- 27.0%
Air-quality risk 3/10 · Minor
- Unhealthy air days now
- 3 days/yr
- Unhealthy air days in 30 yrs
- 4 days/yr
Risk factors via First Street. Map © Google.
Why this score? — see what drove the D+ grade
The composite is a weighted blend of 9 inputs, each scored 0–100. Each bar is that input's sub-score; the figure is the points it added to the 100-point composite (weight × sub-score).
- ARV discount +15.0/15.0
- Cash flow +12.7/30.0
- Rent growth +5.0/5.0
- Schools +4.1/10.0
- DSCR +3.8/10.0
- Livability +3.4/5.0
- Condition / age +2.5/5.0
- 1% rule +2.4/10.0
- Appreciation +0.0/10.0
$499,000
🖨 Deal sheet (PDF) 📄 Offer letter ✓ Due diligence
Listing remarks
* * SUBJECT TO SHORT SALE/BANK APPROVAL * * . No Access at the moment, Please do not disturb current residents. Will advise on possible showing schedule. Opportunity for an Single Family in a highly desired area of Yonkers. Tremendous potential.
Key facts
- 0.23 acre lot
- Garage
- Built 1957
Property features AI
Exterior
- Parking: Driveway; Garage (1 garage space)
- Utilities: Con-Edison electric service; Public sewer; Electricity connected; Natural gas connected; Sewer connected; Water connected; Trash collection public
- Home design: Single family residence; Property listed as fixer/actual condition
- Construction: Brick and frame construction
- Exterior features: Brick and frame construction; Not waterfront
Interior
- Kitchen: Gas oven; Refrigerator
- Bedrooms: 6 rooms total
- Bathrooms: 2 full bathrooms
- Heating & cooling: Natural gas heating; Central air; Wall/window unit(s)
- Interior features: Natural woodwork; Open kitchen; Storage; Walk-through kitchen; Full walk-out basement
- Laundry & utility: Utilities connected: electricity, natural gas, water, sewer; Trash collection (public)
Neighborhood map
What this means for you Summary
Snapshot
- This is a 3-bed/2.0-bath single-family listed at $499k.
Deal economics
- At list price, monthly cash flow is $-59 ($-704/yr) — negative.
- To cash-flow at today's rent, offer at most $489k (2.1% below list).
- To meet the 1% rule (rent ≥ 1% of price), the offer needs to be $367k (26.4% below list).
- Recommended offer: $367k (26.4% below list) — sets the bar for 1% rule.
Location & tenants
- Location reads 68/100 on livability (#528 in NY) — a middle-class / working-renter tenant base. Strengths: employment A, commute B; Watch: amenities F, cost of living F.
- Yonkers City School District (suburban): math 41% / reading 54% proficiency, ranked #413 of 590 in NY (top 70%) — families likely to look elsewhere, expect single-tenant / working-renter base with shorter leases; 64% free/reduced lunch — lower-income household profile, screen leases tightly.
- Zoned schools: Yonkers Early Childhood Academy (327 students, 72% FRL); Yonkers Middle School (math 17% / reading 37%, grade F, #587 of 729 statewide, top 81%, 601 students, 88% FRL); Yonkers High School (math 92% / reading 88%, grade A+, #238 of 1,100 statewide, top 23%, 1,060 students, 76% FRL) — zoned schools average 79% FRL vs 64% district-wide (15 pts higher); higher-poverty schools than district average — tighter screening recommended.
- Market conditions: Rents rising fast (+21.0%/yr); 166 active listings in the ZIP; 20 comparable units currently listed for rent nearby; rentals lingering (median 46d on market — plan ~5-8 weeks vacancy on turnover, expect pricing pressure); 55% of comp listings sitting > 30 days — soft ceiling on asking rent; solid renter incomes; 954 units permitted in Westchester County in 2024 (649 in 5+ unit buildings).
- This rent runs 41% of the median local income ($107k/yr) — at the standard rent-burdened threshold; future hikes will face affordability resistance.
Forward outlook
- Local home prices are declining (-3.0%/yr); year-one equity from $3k of loan paydown is wiped out by about $15k of value loss. Plan a longer hold.
- Westchester County population projected at +10% by 2050 — modest demand growth; plan on rents tracking national, not racing it.
Negotiation context
- Only 1 days on market — expect competitive offers; lowballing is unlikely to land.
- 5 sale attempts since 21y ago with the ask held roughly flat each time — persistent listings suggest the price (not the market) is what's stuck; bring a comps-based counter.
- Current owner paid $195k; list at $499k implies a 156% gain — meaningful room to come down on a strong offer.
Risks & watch-outs
- Watch-outs: built in 1957 — expect roof / HVAC / electrical / plumbing capex.
- Climate carrying-cost: major wind risk, 27% chance of damaging wind over 30y; extreme-heat days projected 7→14/yr by 2055 (HVAC capex compounding) — expect insurance premiums to compound above CPI over the hold.
Questions for the listing agent
- What do current leases actually rent for vs. the listed asking? Can we see a recent rent roll and the last 12 months of T-12 income?
- Built in 1957 — when were the roof, HVAC, electrical panel, plumbing, and water heater last replaced?
- Is there a deadline driving the sale (1031 exchange, divorce, estate, relocation)? That informs how much negotiation room exists.
- The area grade is low — what's the realistic commute time and amenity access for the typical tenant pool here? Any planned neighborhood developments (good or bad) we should know about?
- What's the average days-on-market for RENTAL listings here right now (not sales)? A rising rental-DOM trend means longer vacancies and softer asking-rent achievability than the comps imply.
- What's the recent tenant-quality profile in this submarket — average credit score on applications, eviction rate, late-payment / NSF rate, and stable-employment percentage? A property-management company in the area should have these aggregated.
- How much new for-sale + rental construction is in the pipeline within 1–3 miles? Heavy new supply typically softens prices + rents 12–24 months out; constrained supply supports both.
Investment metrics
- 1% rule
- 0.74% ✗
- Cap rate
- 6.15%
- Cash-on-cash
- -0.50%
- DSCR
- 0.98
- GRM
- 11.3
CMA / ARV
- ARV (on-the-fly)
- $761,040
- Comps found
- 12
Show comp detail 12 sales within ~0.75 mi
| Address | Dist | Beds/Ba | Sqft | Sold | Price | $/sf | Match |
|---|---|---|---|---|---|---|---|
| 383 Saint Johns Ave | 0.22mi | 3/1.5 | 1,738 (+4%) | 7mo | $725,000 | $417 | 76 |
| 38 Seminary Ave | 0.35mi | 3/1.5 | 1,708 (+2%) | 6mo | $762,000 | $446 | 74 |
| 120 Seminary Ave | 0.49mi | 4/2.0 (+1) | 1,748 (+4%) | 2mo | $785,000 | $449 | 64 |
| 28 Clayton Pl | 0.28mi | 3/2.0 | 1,480 (-12%) | 8mo | $797,000 | $539 | 60 |
| 54 Staunton St | 0.68mi | 3/2.5 | 1,754 (+4%) | 2mo | $795,000 | $453 | 57 |
| 85 aka 87 Lefferts Rd | 0.72mi | 3/2.0 | 1,626 (-3%) | 6mo | $677,777 | $417 | 56 |
| 103 Seminary Ave | 0.44mi | 3/1.5 | 1,909 (+14%) | 3mo | $815,000 | $427 | 52 |
| 135 Midland Ter | 0.51mi | 3/3.0 | 1,912 (+14%) | 1mo | $860,000 | $450 | 48 |
| 84 Page Ave | 0.57mi | 3/1.5 | 1,440 (-14%) | 2mo | $718,000 | $499 | 46 |
| 238 Kimball Ter | 0.70mi | 3/2.0 | 1,476 (-12%) | 2mo | $715,000 | $484 | 46 |
| 71 Saint Johns Ave | 0.75mi | 2/2.0 (-1) | 1,468 (-13%) | 0mo | $712,000 | $485 | 39 |
| 14 aka 26 Huber Pl | 0.67mi | 4/1.5 (+1) | 1,440 (-14%) | 2mo | $660,000 | $458 | 36 |
Match score weights: distance 35% · size 25% · config 20% · recency 20%. Top-matched comps best support the ARV.
Projected returns pro-forma
-3.0% appreciation · 8.0% rent growth · sell at horizon
- IRR
- -12.5%
- Equity multiple
- 0.53×
- Total profit
- $-65,444
- Equity at exit
- $74,403
- IRR
- 2.1%
- Equity multiple
- 1.18×
- Total profit
- $25,483
- Equity at exit
- $43,144
Cash invested: $139,720 (down + closing). Projections, not guarantees.
Landlord ↔ Tenant lean methodology
- Overall (CITY)
- 5 Strongly Tenant-Friendly
- State New York
- 15 Strongly Tenant-Friendly · D+10
- County
- — inherits STATE
- City Yonkers
- 5 Strongly Tenant-Friendly · D+20
ZIP-level market 10704
- Rents YoY
- 21.0%
- Active inventory
- 166
- Price-to-rent
- 11.3×
Monthly cashflow live
- Estimated rent
- $3,670 high interval (Pro) →
- Mortgage (P&I)
- −$2,617
- Tax from tax record
- −$133 /mo · $1,601/yr
- Insurance
- −$208
- HOA
- −$0
- Vacancy / Maint / Mgmt
- −$771
- Net cashflow
- $-59
Break-even live
Sensitivity live
| Price | -10% $224 | -5% $83 | +0% $-59 | +5% $-200 | +10% $-341 |
|---|---|---|---|---|---|
| Rent | -10% $-349 | -5% $-204 | +0% $-59 | +5% $86 | +10% $231 |
| Rate | -1.0pp $193 | -0.5pp $68 | base $-59 | +0.5pp $-188 | +1.0pp $-319 |
UW: 25.0% down · 7.5% · 30yr · 1.5% tax · 5.0% vac · 8.0% maint · 8.0% mgmt
Financing live
Cash to close
- Down payment
- $124,750
- Closing costs
- $14,970
- Reserves months
- —
- Total cash needed
- —
Loan-product check · same deal, 3 products live
Conventional
25% down · 7.5% · 30yr
- Down + closing
- —
- Monthly P&I
- —
- Monthly cashflow
- —
- DSCR
- —
- Eligible?
- —
Personal DTI + credit; lowest rate.
DSCR
20% down · 8.5% · 30yr
- Down + closing
- —
- Monthly P&I
- —
- Monthly cashflow
- —
- DSCR
- —
- Eligible?
- —
No personal income docs; deal must DSCR.
Hard money
10% down · 12.0% · 12mo
- Down + closing
- —
- Monthly P&I
- —
- Monthly cashflow
- —
- DSCR
- —
- Eligible?
- —
Short-term bridge; refi at stabilization.
Rent comps 20 comps
| Address | Beds | Baths | Sqft | Rent | $/sqft | DOM | Units | Dist |
|---|---|---|---|---|---|---|---|---|
| 36 Dunwoodie St Unit 1 Yonkers, NY | 3.0 | 1.0 | 1300 | $3,500 | $2.69 | 45d | 1 | 0.19mi |
| 14 Chamberlain Ave Unit 1 Yonkers, NY | 2.0 | 2.0 | 1150 | $4,200 | $3.65 | 12d | 1 | 0.46mi |
| 184 Trenchard St Yonkers, NY | 2.0 | 1.0 | 1876 | $2,550 | $1.36 | 45d | 1 | 0.82mi |
| 6 Belden Ave Unit 1 Yonkers, NY | 3.0 | 2.0 | 1450 | $3,500 | $2.41 | 26d | 1 | 0.82mi |
| 11 Garfield St Unit 2 Yonkers, NY | 2.0 | 1.0 | 1250 | $2,250 | $1.80 | 17d | 1 | 0.88mi |
| 169 Tibbetts Rd Unit 1st Fl Yonkers, NY | 3.0 | 1.0 | 1550 | $3,300 | $2.13 | 46d | 1 | 0.99mi |
| 495 Kimball Ave Unit First Floor Yonkers, NY | 2.0 | 1.0 | 1100 | $3,000 | $2.73 | 45d | 1 | 1.06mi |
| 52 Lewis Pkwy Unit 1545731P Yonkers, NY | 3.0 | 2.0 | 1496 | $5,806 | $3.88 | 17d | 1 | 1.11mi |
| 155 Vernon Ave Yonkers, NY | 2.0 | 1.0 | 2226 | $2,700 | $1.21 | 45d | 1 | 1.18mi |
| 62 Gibson Pl Yonkers, NY | 4.0 | 4.0 | 2100 | $4,700 | $2.24 | 45d | 1 | 1.22mi |
| 497 Van Cortlandt Park Ave Yonkers, NY | 4.0 | 1.0 | 1200 | $3,500 | $2.92 | 45d | 1 | 1.25mi |
| 37 Troy Ln Unit 1 Yonkers, NY | 4.0 | 1.5 | 1500 | $4,200 | $2.80 | 9d | 1 | 1.25mi |
| 4 Ritters Ln Unit 1FL Yonkers, NY | 3.0 | 1.0 | 1100 | $3,300 | $3.00 | 45d | 1 | 1.27mi |
| 80 Elliott Ave Unit 3rd Floor Yonkers, NY | 4.0 | 1.0 | 1500 | $4,100 | $2.73 | 45d | 1 | 1.30mi |
| 65 Caroline Ave Unit 1L Yonkers, NY | 3.0 | 1.0 | 1050 | $2,700 | $2.57 | 45d | 1 | 1.30mi |
| 116 Alexander Ave Yonkers, NY | 2.0 | 2.0 | 1200 | $3,000 | $2.50 | 1d | 1 | 1.32mi |
| 65 Hunts Bridge Rd Yonkers, NY | 3.0 | 1.0 | 1600 | $3,500 | $2.19 | 16d | 1 | 1.33mi |
| 18 Bronxville Glen Dr Unit 11 Yonkers, NY | 2.0 | 2.5 | 1650 | $4,500 | $2.73 | 0d | 1 | 1.38mi |
| 11 Lawrence St Unit 1L Yonkers, NY | 4.0 | 1.0 | 2000 | $3,400 | $1.70 | 21d | 1 | 1.38mi |
| 433 Palmer Rd Unit Second Fl Yonkers, NY | 3.0 | 1.5 | 1400 | $3,500 | $2.50 | 45d | 1 | 1.44mi |
Listing history 2 events
-
2026-06-18remarks 248-char remark
-
2026-06-18$499,000 Active 1 DOM
ⓘ Source: listings_history table (triggers on properties + properties_extension) + one-shot
backfill from property_details.listing_events for pre-trigger history.
Tax reassessment forecast NY · Partial reset (capped growth)
- Current annual tax
- $1,601 · $133/mo
- Projected year-2 tax
- $5,017 · $418/mo
- Expected delta
- +$3,416/yr (+$285/mo · 213.5%)
ⓘ Screening estimate from a state-policy table — verify with the county assessor before closing.
Climate risk First Street
- Flood 1/10 Low FEMA zone X (unshaded) · 0% chance over 30 yrs
- Wildfire 2/10 Low
- Heat 6/10 Major 7 d/yr ≥99°F today · 14 d/yr by 30 yrs out
- Wind 6/10 Major 27% chance of damaging wind over 30 yrs
- Air quality 3/10 Moderate 3 unhealthy d/yr today · 4 by 30 yrs out
Nearby sold comps map
Loading sold comps map…
Walkable amenities ~0.75 mi
Loading nearby amenities…
Taxation est. · year 1
- Rental income
- $44,042
- − Mortgage interest
- −$27,952
- − Property taxes
- −$1,601
- − Insurance
- −$2,495
- − Repairs & maintenance
- −$3,523
- − Management
- −$3,523
- − Depreciation
- −$14,516
- Taxable loss
- −$9,568
- Est. tax savings @ 24.0%
- +$2,296
- After-tax cash flow
- $1,593/yr
For passive investors: Depreciation is non-cash, so a rental often shows a tax loss while cash-flowing — sheltering income. Rental losses are passive: they offset passive income freely, and up to $25,000/yr can offset ordinary (W-2) income if you actively participate and your MAGI is under $100k (phasing out to $0 by $150k); unused losses carry forward. On sale, claimed depreciation is recaptured at up to 25%, and gains may owe capital-gains tax (a 1031 exchange can defer both). Figures are a year-1 estimate at your 24.0% rate — not tax advice; consult a CPA.
Schools (NCES district)
- District
- Yonkers City School District
- NCES district ID
- 3631920
- Math proficiency
- 41% ▼ -1.00%
- Reading proficiency
- 54% ▲ 14.00%
- Median HH income
- $58,042
- Composite
- 41.43/100
- National rank
- #3471
- State rank
- #413 of 590 in NY
Livability — Yonkers
- Score
- 68/100
- State rank
- #528
- US rank
- #9394
Category grades
Schools grade is shown separately in the Schools card above.
Census & demographics
- Census place
- Yonkers, NY
- County
- Westchester County · 709,332 people
- City population
- 212,407
- Metro
- New York-Newark-Jersey City, NY-NJ-PA
- Population (ZIP)
- 31,921
- Household income
- $106,786
- Rent vs Own
- Severe rent burden
- 1078.0
Population outlook (Westchester County) Hauer SSP2
- Today (2025)
- 1,028,035 people
- By 2030
- 1,051,636 · +2.3%
- By 2040
- 1,098,520 · +6.9%
- By 2050
- 1,136,044 · +10.5%
- By 2075
- 1,196,925 · +16.4%
- By 2100
- 1,175,147 · +14.3%
Race, ethnicity, and origin ACS 2023
- Neighborhood character
- Diverse neighborhood (Simpson 0.64)
- Race & ethnicity
- White 50% Hispanic / Latino 32% Two or more races 15% Black 7% Asian 5%
- Hispanic origin (detail)
- Mexican 1% Puerto Rican 11% Cuban 2% Dominican 9%
- Common ancestry
- Romanian 2% Subsaharan African 2% Scotch-Irish 2%
- Foreign-born
- 32% · Canada, Jamaica, China
- Languages at home
- 54% English-only · Spanish 25% Other Indo-European 13% Russian/Polish/Slavic 2%
Political lean MEDSL · Westchester
- 2024 margin
- Strong D (+26.3) · D 63.1% · R 36.9%
- 2008→2024 swing
- -1.3pp toward R · 2008: 27.6pp · 2024: 26.3pp
- All cycles
- 2024: D+26.3 2020: D+36.3 2016: D+32.8 2012: D+22.2 2008: D+27.6
Not yet ingested
- Civics
- —
Market trends
- HPI YoY
- ▼ -466.66%
- Current HPI
- 293.4414
- Rent YoY
- ▲ 21.03%
- Metro
- New York-Newark-Jersey City, NY-NJ-PA
- State GDP YoY
- ▲ 2.60%
- F500 in state
- 92
Industry mix (Fortune 500 HQ in NY)
| Industry | F500 HQs | Revenue |
|---|---|---|
| Financial Services | 10 | $950B |
|
||
| Consumer Goods | 9 | $162B |
|
||
| Insurance | 4 | $225B |
|
||
| Telecommunications | 2 | $144B |
|
||
| Pharmaceuticals | 2 | $112B |
|
||
| Media / Entertainment | 2 | $69B |
|
||
Price history
+148.3% since first listed11 events — show timeline
- 2026-06-18 Listed $499,000 OneKey® MLS as Distributed by MLS Grid
- 2018-01-18 Listing Removed — OneKey® MLS as Distributed by MLS Grid
- 2018-01-16 Relisted — OneKey® MLS as Distributed by MLS Grid
- 2017-09-28 Contingent — OneKey® MLS as Distributed by MLS Grid
- 2017-09-25 Listed $299,000 OneKey® MLS as Distributed by MLS Grid
- 2008-08-30 Delisted — HGMLS
- 2008-04-11 Listed — HGMLS
- 2005-12-31 Delisted — HGMLS
- 2005-06-07 Listed — HGMLS
- 1997-09-02 Sold (Public Records) $195,000 Public Records
- 1994-02-18 Sold (Public Records) $201,000 Public Records
Property tax history
-27.9%/yrLatest (2025): $1,601 · +0.5% YoY. Source: county tax records.
Cash-flow waterfall
monthlySold comps — $/sqft
last 12 mo · ≤1 miLoading sold comps…