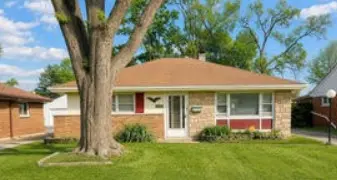
15527 Rose Dr · South Holland, IL
Flood risk 2/10 · Minimal
- FEMA flood zone
- X (unshaded)
- Chance of flooding over 30 yrs
- 0.05%
- Est. flood insurance / yr
- $473 – $860
Fire risk 1/10 · Minimal
- Est. fire insurance / yr
- $804 – $1,492
Heat risk 3/10 · Minor
- Hot days now (above 101°F)
- 7 days/yr
- Hot days in 30 yrs
- 15 days/yr
Wind risk 2/10 · Minimal
- Chance of severe wind over 30 yrs
- —
Air-quality risk 4/10 · Minor
- Unhealthy air days now
- 4 days/yr
- Unhealthy air days in 30 yrs
- 5 days/yr
Risk factors via First Street. Map © Google.
Why this score? — see what drove the C grade
The composite is a weighted blend of 9 inputs, each scored 0–100. Each bar is that input's sub-score; the figure is the points it added to the 100-point composite (weight × sub-score).
- Cash flow +22.2/30.0
- ARV discount +8.7/15.0
- 1% rule +8.4/10.0
- DSCR +7.1/10.0
- Livability +3.9/5.0
- Rent growth +2.5/5.0
- Condition / age +2.5/5.0
- Schools +0.7/10.0
- Appreciation +0.0/10.0
$155,000
🖨 Deal sheet 📄 Offer letter ✓ Due diligence
Listing remarks MLS
Gorgeous ranch home. Spacious kitchen with lots of cabinets. Newer carpet, all appliances stay. 30x9 covered porch, fenced yard, shed and much more.
Key facts
- Solid brick
- One story ranch
- Newly purchased oven
Tags
Neighborhood map
What this means for you Summary
Snapshot
- This is a 2-bed/1.0-bath single-family listed at $155k.
Deal economics
- At list price, monthly cash flow is $252 ($3k/yr) — positive.
- The deal already cash-flows at list — no discount required.
- Meets the 1% rule at list price ($2k rent vs $155k).
- Recommended offer: $153k (1.5% below list) — sets the bar for market timing.
Location & tenants
- Location reads 77/100 on livability (#167 in IL, #3,071 nationally) — a middle-class / working-renter tenant base. Strengths: commute A+, housing A+, cost of living A; Watch: crime C-, amenities C-, schools D+.
- Thornton Twp Hsd 205 (suburban): math 7% / reading 8% proficiency, ranked #594 of 620 in IL (top 96%) — low school quality limits family demand, transient renter base, plan for 1-2y turnover.
- Market conditions: 135 active listings in the ZIP; 14 comparable units currently listed for rent nearby; rentals at typical pace (median 19d on market — plan ~3-4 weeks tenant-placement turnaround); 6,272 units permitted in Cook County in 2024 (4,658 in 5+ unit buildings).
Forward outlook
- Local home prices are declining (-3.0%/yr); year-one equity from $1k of loan paydown is wiped out by about $5k of value loss. Plan a longer hold.
Negotiation context
- It's been on market 17 days — a 2% lower offer ($153k) is reasonable based on typical stale-listing flexibility.
- 2 sale attempts since 23y ago; this cycle's ask is 3% above the opening price — seller raised mid-cycle; expect resistance to lowballs.
- Current owner paid $100k; list at $155k implies a 55% gain — meaningful room to come down on a strong offer.
Risks & watch-outs
- Watch-outs: property tax is 3.9% of price; built in 1959 — expect roof / HVAC / electrical / plumbing capex.
Questions for the listing agent
- Built in 1959 — when were the roof, HVAC, electrical panel, plumbing, and water heater last replaced?
- Property tax is high relative to price — has the assessment been appealed recently, and will the sale trigger a re-assessment?
- Is there a deadline driving the sale (1031 exchange, divorce, estate, relocation)? That informs how much negotiation room exists.
- Schools are D-rated, which usually means shorter tenancies and higher turnover. Who's the typical renter profile here, and what's been the actual vacancy rate?
- What's the average days-on-market for RENTAL listings here right now (not sales)? A rising rental-DOM trend means longer vacancies and softer asking-rent achievability than the comps imply.
- What's the recent tenant-quality profile in this submarket — average credit score on applications, eviction rate, late-payment / NSF rate, and stable-employment percentage? A property-management company in the area should have these aggregated.
- How much new for-sale + rental construction is in the pipeline within 1–3 miles? Heavy new supply typically softens prices + rents 12–24 months out; constrained supply supports both.
Investment metrics
- 1% rule
- 1.34% ✓
- Cap rate
- 8.24%
- Cash-on-cash
- 6.96%
- DSCR
- 1.31
- GRM
- 6.2
CMA / ARV
- ARV (on-the-fly)
- $159,355
- Comps found
- 12
Show comp detail 12 sales within ~0.75 mi
| Address | Dist | Beds/Ba | Sqft | Sold | Price | $/sf | Match |
|---|---|---|---|---|---|---|---|
| 15509 Rose Dr | 0.04mi | 2/1.0 | 1,100 (+8%) | 0mo | $135,000 | $123 | 84 |
| 15519 Ellis Ave | 0.36mi | 2/2.0 | 1,024 (+1%) | 4mo | $133,000 | $130 | 75 |
| 15503 Park Ln | 0.19mi | 3/2.0 (+1) | 968 (-5%) | 0mo | $170,000 | $176 | 74 |
| 717 E 154th St | 0.14mi | 3/1.0 (+1) | 1,120 (+10%) | 2mo | $177,000 | $158 | 70 |
| 15944 School St | 0.58mi | 2/1.0 | 1,008 (-1%) | 4mo | $175,000 | $174 | 68 |
| 15539 Minerva Ave | 0.48mi | 3/1.5 (+1) | 1,050 (+3%) | 2mo | $134,000 | $128 | 63 |
| 15722 Woodlawn East Ave | 0.63mi | 3/1.5 (+1) | 1,015 (0%) | 1mo | $101,000 | $100 | 63 |
| 15223 Cottage Grove Ave | 0.37mi | 3/1.0 (+1) | 1,099 (+8%) | 3mo | $172,000 | $157 | 61 |
| 15519 Gouwens Ln | 0.07mi | 3/2.0 (+1) | 1,153 (+14%) | 5mo | $216,000 | $187 | 60 |
| 1340 Prince Dr | 0.74mi | 3/2.0 (+1) | 1,066 (+5%) | 2mo | $160,000 | $150 | 47 |
| 619 E 152nd St | 0.54mi | 3/1.5 (+1) | 1,146 (+13%) | 1mo | $153,000 | $134 | 46 |
| 14927 Cottage Grove Ave | 0.72mi | 3/2.0 (+1) | 1,095 (+8%) | 1mo | $250,000 | $228 | 44 |
Match score weights: distance 35% · size 25% · config 20% · recency 20%. Top-matched comps best support the ARV.
Projected returns pro-forma
-3.0% appreciation · 3.0% rent growth · sell at horizon
- IRR
- -5.5%
- Equity multiple
- 0.80×
- Total profit
- $-8,859
- Equity at exit
- $23,111
- IRR
- 4.3%
- Equity multiple
- 1.32×
- Total profit
- $13,838
- Equity at exit
- $13,402
Cash invested: $43,400 (down + closing). Projections, not guarantees.
Landlord ↔ Tenant lean methodology
- Overall (STATE)
- 43 Moderately Tenant-Leaning
- State Illinois
- 43 Moderately Tenant-Leaning · D+7
- County
- — inherits STATE
- City
- — inherits STATE
ZIP-level market 60473
- Active inventory
- 135
- Price-to-rent
- 6.2×
Monthly cashflow live
- Estimated rent
- $2,069 high interval (Pro) →
- Mortgage (P&I)
- −$813
- Tax from tax record
- −$506 /mo · $6,068/yr
- Insurance
- −$65
- HOA
- −$0
- Vacancy / Maint / Mgmt
- −$435
- Net cashflow
- $252
Break-even live
UW: 25.0% down · 7.5% · 30yr · 1.5% tax · 5.0% vac · 8.0% maint · 8.0% mgmt
Financing live
Cash to close
- Down payment
- $38,750
- Closing costs
- $4,650
- Reserves months
- —
- Total cash needed
- —
Loan-product check · same deal, 3 products live
Conventional
25% down · 7.5% · 30yr
- Down + closing
- —
- Monthly P&I
- —
- Monthly cashflow
- —
- DSCR
- —
- Eligible?
- —
Personal DTI + credit; lowest rate.
DSCR
20% down · 8.5% · 30yr
- Down + closing
- —
- Monthly P&I
- —
- Monthly cashflow
- —
- DSCR
- —
- Eligible?
- —
No personal income docs; deal must DSCR.
Hard money
10% down · 12.0% · 12mo
- Down + closing
- —
- Monthly P&I
- —
- Monthly cashflow
- —
- DSCR
- —
- Eligible?
- —
Short-term bridge; refi at stabilization.
Rent comps 14 comps
| Address | Beds | Baths | Sqft | Rent | $/sqft | DOM | Units | Dist |
|---|---|---|---|---|---|---|---|---|
| 15324 Doctor Martin Luther King Junior Dr Unit 1B Dolton, IL | 1.0 | 1.0 | 725 | $985 | $1.36 | 19d | 1 | 0.51mi |
| 15238 Doctor Martin Luther King Junior Dr Unit 2W Dolton, IL | 2.0 | 1.0 | 800 | $1,500 | $1.88 | 10d | 1 | 0.55mi |
| 14916 Langley Ave Dolton, IL | 3.0 | 1.5 | 1418 | $2,500 | $1.76 | 24d | 1 | 0.74mi |
| 16001 Avalon Ave South Holland, IL | 3.0 | 2.0 | 1136 | $3,330 | $2.93 | 6d | 1 | 0.86mi |
| 14817 Champlain Ave Dolton, IL | 2.0 | 1.0 | 980 | $2,430 | $2.48 | 22d | 1 | 0.87mi |
| 1450 E 154th Pl Dolton, IL | 1.0 | 1.0 | 800 | $1,250 | $1.56 | 24d | 1 | 0.88mi |
| 16246 Dobson Ave South Holland, IL | 3.0 | 2.0 | 1250 | $3,170 | $2.54 | 2d | 1 | 0.99mi |
| 14716 Dorchester Ave Dolton, IL | 3.0 | 2.0 | 1250 | $2,800 | $2.24 | 19d | 1 | 1.28mi |
| 14502 Cottage Grove Ave Unit 1S Dolton, IL | 1.0 | 1.0 | 900 | $1,425 | $1.58 | 8d | 1 | 1.31mi |
| 14500 Cottage Grove Ave Unit 3 Dolton, IL | 2.0 | 1.0 | 1000 | $1,475 | $1.48 | 24d | 1 | 1.31mi |
| 14738 Blackstone Ave Dolton, IL | 3.0 | 1.0 | 1017 | $2,400 | $2.36 | 10d | 1 | 1.32mi |
| 14844 Wabash Ave Dolton, IL | 3.0 | 1.5 | 1277 | $2,320 | $1.82 | 24d | 1 | 1.40mi |
| 660 Clyde Ave Calumet City, IL | 3.0 | 1.5 | 1400 | $1,750 | $1.25 | 3d | 1 | 1.45mi |
| 14610 Blackstone Ave Dolton, IL | 3.0 | 1.0 | 1017 | $2,400 | $2.36 | 6d | 1 | 1.47mi |
Listing history 18 events
-
2026-06-18days on market $155,000 Active 17 DOM
-
2026-06-17days on market $155,000 Active 16 DOM
-
2026-06-16days on market $155,000 Active 15 DOM
-
2026-06-15days on market $155,000 Active 14 DOM
-
2026-06-13days on market $155,000 Active 12 DOM
-
2026-06-13days on market $155,000 Active 11 DOM
-
2026-06-09days on market $155,000 Active 8 DOM
-
2026-06-08days on market $155,000 Active 7 DOM
-
2026-06-07days on market $155,000 Active 6 DOM
-
2026-06-04days on market $155,000 Active 3 DOM
-
2026-06-03days on market $155,000 Active 2 DOM
-
2026-06-02price $155,000 Active 1 DOM
-
2026-05-27$150,000 Active
-
2003-09-18soldstatus $100,000
-
2003-06-07$99,900 148-char remark
Show marketing remark (148 chars)
Gorgeous ranch home. Spacious kitchen with lots of cabinets. Newer carpet, all appliances stay. 30x9 covered porch, fenced yard, shed and much more.
-
2000-06-05soldstatus $80,000
-
1994-01-21soldstatus $63,000
-
1979-08-15soldstatus $47,000
ⓘ Source: listings_history table (triggers on properties + properties_extension) + one-shot
backfill from property_details.listing_events for pre-trigger history.
Tax reassessment forecast IL · Partial reset (capped growth)
- Current annual tax
- $6,068 · $506/mo
- Projected year-2 tax
- $6,068 · $506/mo
- Expected delta
- $0/yr ($0/mo · 0.0%)
ⓘ Screening estimate from a state-policy table — verify with the county assessor before closing.
Climate risk First Street
- Flood 2/10 Low FEMA zone X (unshaded) · 5% chance over 30 yrs
- Wildfire 1/10 Low
- Heat 3/10 Moderate 7 d/yr ≥101°F today · 15 d/yr by 30 yrs out
- Wind 2/10 Low
- Air quality 4/10 Moderate 4 unhealthy d/yr today · 5 by 30 yrs out
Nearby sold comps map
Loading sold comps map…
Walkable amenities ~0.75 mi
Loading nearby amenities…
Taxation est. · year 1
- Rental income
- $24,834
- − Mortgage interest
- −$8,682
- − Property taxes
- −$6,068
- − Insurance
- −$775
- − Repairs & maintenance
- −$1,987
- − Management
- −$1,987
- − Depreciation
- −$4,509
- Taxable income
- $825
- Est. tax owed @ 24.0%
- −$198
- After-tax cash flow
- $2,823/yr
For passive investors: Depreciation is non-cash, so a rental often shows a tax loss while cash-flowing — sheltering income. Rental losses are passive: they offset passive income freely, and up to $25,000/yr can offset ordinary (W-2) income if you actively participate and your MAGI is under $100k (phasing out to $0 by $150k); unused losses carry forward. On sale, claimed depreciation is recaptured at up to 25%, and gains may owe capital-gains tax (a 1031 exchange can defer both). Figures are a year-1 estimate at your 24.0% rate — not tax advice; consult a CPA.
Schools (NCES district)
- District
- Thornton Twp Hsd 205
- NCES district ID
- 1738970
- Math proficiency
- 7% ▬ 0.00%
- Reading proficiency
- 8% ▼ -2.00%
- Median HH income
- $43,392
- Composite
- 6.92/100
- National rank
- #9976
- State rank
- #594 of 620 in IL
Livability — South Holland
- Score
- 77/100
- State rank
- #167
- US rank
- #3071
Category grades
Schools grade is shown separately in the Schools card above.
Census & demographics
- Census place
- South Holland, IL
- City population
- 21,407
- Population (ZIP)
- 21,407
Population outlook (Cook County) Hauer SSP2
- Today (2025)
- 5,347,519 people
- By 2030
- 5,357,703 · +0.2%
- By 2040
- 5,324,924 · -0.4%
- By 2050
- 5,230,762 · -2.2%
- By 2075
- 4,785,735 · -10.5%
- By 2100
- 4,188,836 · -21.7%
Race, ethnicity, and origin ACS 2023
- Neighborhood character
- Predominantly Black (75%)
- Race & ethnicity
- Black 75% White 10% Hispanic / Latino 10% Two or more races 3% Asian 1%
- Hispanic origin (detail)
- Mexican 9% Puerto Rican 1%
- Common ancestry
- Iranian 3% Romanian 2%
- Foreign-born
- 6% · Canada, China
- Languages at home
- 87% English-only · Spanish 8% Other Asian/Pacific 1% Russian/Polish/Slavic 1%
Political lean MEDSL · Cook
- 2024 margin
- Solid D (+42.0) · D 70.4% · R 28.4% · Other 1.2%
- 2008→2024 swing
- -11.4pp toward R · 2008: 53.4pp · 2024: 42.0pp
- All cycles
- 2024: D+42.0 2020: D+50.3 2016: D+53.0 2012: D+49.4 2008: D+53.4
Not yet ingested
- Civics
- —
Market trends
- HPI YoY
- ▼ -114.36%
- Current HPI
- 201.2479
- Rent YoY
- —
- Metro
- —
- State GDP YoY
- ▲ 1.59%
- F500 in state
- 60
Industry mix (Fortune 500 HQ in IL)
| Industry | F500 HQs | Revenue |
|---|---|---|
| Insurance | 4 | $201B |
|
||
| Consumer Goods | 4 | $87B |
|
||
| Industrial Machinery | 3 | $64B |
|
||
| Healthcare | 2 | $55B |
|
||
| Retail / Pharmacy | 1 | $148B |
|
||
| Agriculture / Food | 1 | $86B |
|
||
Price history
+219.1% since first listed6 events — show timeline
- 2026-05-27 Listed $150,000 MRED as Distributed by MLS Grid
- 2003-09-18 Sold (Public Records) $100,000 Public Records
- 2003-06-07 Listed $99,900 NIRA MLS as Distributed by MLS Grid
- 2000-06-05 Sold (Public Records) $80,000 Public Records
- 1994-01-21 Sold (Public Records) $63,000 Public Records
- 1979-08-15 Sold (Public Records) $47,000 Public Records
Property tax history
+9.2%/yrLatest (2023): $6,068 · +5.2% YoY. Source: county tax records.
Cash-flow waterfall
monthlySold comps — $/sqft
last 12 mo · ≤1 miLoading sold comps…