130 Schilling Dr · Moses Lake North, WA
Flood risk 1/10 · Minimal
- FEMA flood zone
- X (unshaded)
- Chance of flooding over 30 yrs
- 0.0%
- Est. flood insurance / yr
- $507 – $1,088
Fire risk 4/10 · Minor
- Est. fire insurance / yr
- $604 – $1,122
Heat risk 4/10 · Minor
- Hot days now (above 96°F)
- 7 days/yr
- Hot days in 30 yrs
- 14 days/yr
Wind risk 1/10 · Minimal
- Chance of severe wind over 30 yrs
- —
Air-quality risk 9/10 · Severe
- Unhealthy air days now
- 18 days/yr
- Unhealthy air days in 30 yrs
- 18 days/yr
Risk factors via First Street. Map © Google.
Why this score? — see what drove the B- grade
The composite is a weighted blend of 9 inputs, each scored 0–100. Each bar is that input's sub-score; the figure is the points it added to the 100-point composite (weight × sub-score).
- Cash flow +30.0/30.0
- DSCR +10.0/10.0
- 1% rule +8.3/10.0
- ARV discount +7.5/15.0
- Schools +3.9/10.0
- Livability +3.2/5.0
- Condition / age +2.5/5.0
- Rent growth +2.1/5.0
- Appreciation +0.0/10.0
$125,000
🖨 Deal sheet (PDF) 📄 Offer letter ✓ Due diligence
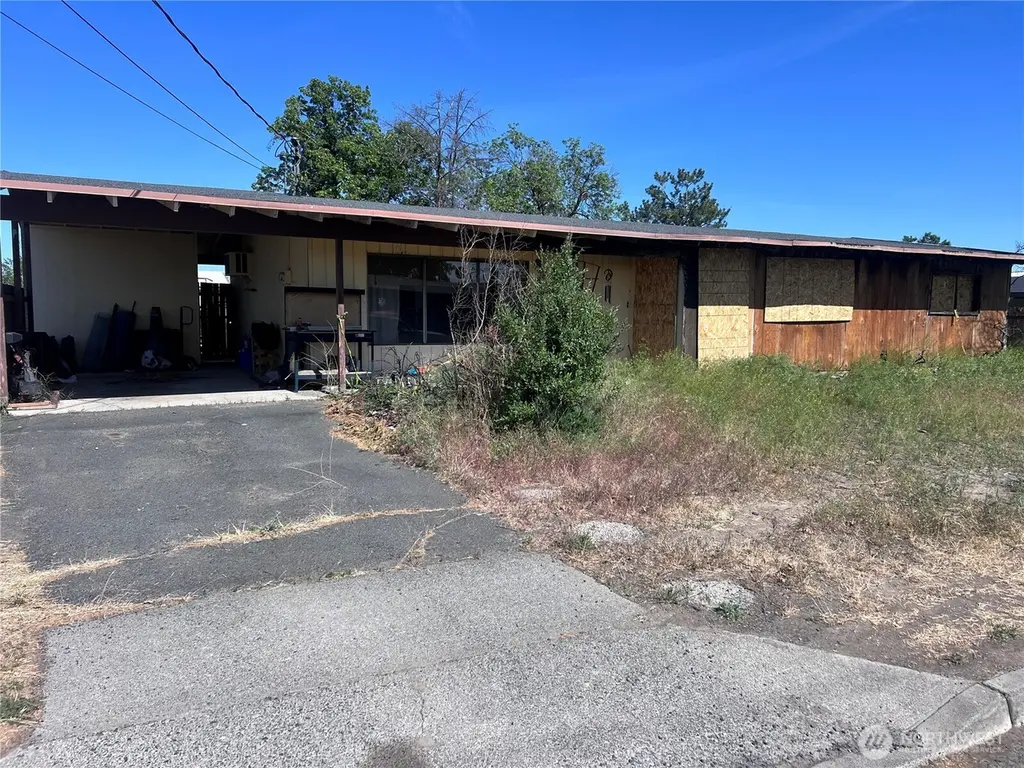
Listing remarks
Opportunity knocks! Fire-damaged home on a generous ½-acre lot with a 930 +/- sq ft detached shop. Prime location near Highway 17 and the local schools. Perfect chance for investors, builders, or trades people to rebuild and create instant equity. Utilities on site. Sold AS-IS priced for quick sale.
Key facts
- ½-acre lot
- Utilities on site
- Detached shop
Tags
Property features AI
Finance
- Financial info: Listing terms: Cash or rehab loan
Exterior
- Parking: Attached carport (4 covered/carport spaces); RV parking
- Security: Partially fenced
- Utilities: Public water (City of Moses Lake); Sewer connected (City of Moses Lake); Electric service (Grant County PUD)
- Home design: Single-family residence; One-story; Built on lot; Entry on main level; Has view
- Construction: Brick and wood construction; Composition roof; Poured concrete foundation; Built 1,437 finished square feet
- Exterior features: Brick and wood exterior; Patio; Shop; Outbuildings; RV parking; Partially fenced; Curbs, paved and sidewalk; Level lot
Interior
- Kitchen: Kitchen with eating space
- Bedrooms: Three bedrooms (all on main level); Primary bedroom (main level)
- Bathrooms: One full bathroom (main level) with tub; One three-quarter bathroom (main level)
- Heating & cooling: Baseboard heating; Wall unit cooling
- Interior features: Dining room; Entry hall; Living room; Kitchen with eating space; Utility room; Partially fenced
- Laundry & utility: Utility room (main level)
Neighborhood map
What this means for you Summary
Snapshot
- This is a 3-bed/2.0-bath single-family listed at $125k.
Deal economics
- At list price, monthly cash flow is $501 ($6k/yr) — positive.
- The deal already cash-flows at list — no discount required.
- Meets the 1% rule at list price ($2k rent vs $125k).
- Cap rate 11.1% vs local median 1.8% in Moses Lake North — top-decile yield for the area; either an underpriced asset or a hidden risk that comps aren't pricing in. Stress-test before assuming the spread holds.
Location & tenants
- Location reads 65/100 on livability (#351 in WA) — a middle-class / working-renter tenant base. Strengths: cost of living A+, housing A+, health & safety A+; Watch: crime C-, amenities F, commute F.
- Moses Lake School District (town): math 38% / reading 48% proficiency, ranked #198 of 291 in WA (top 68%) — families likely to look elsewhere, expect single-tenant / working-renter base with shorter leases.
- Zoned schools: Larson Heights Elementary (337 students, 87% FRL); Endeavor Middle School (267 students, 96% FRL); Moses Lake High School (1,984 students, 64% FRL) — zoned schools average 82% FRL vs 53% district-wide (29 pts higher); higher-poverty schools than district average — tighter screening recommended.
- Market conditions: Rents soft (-1.7%/yr); 589 active listings in the ZIP; 8 comparable units currently listed for rent nearby; rentals lingering (median 45d on market — plan ~5-8 weeks vacancy on turnover, expect pricing pressure); 100% of comp listings sitting > 30 days — soft ceiling on asking rent; 559 units permitted in Grant County in 2024 (35 in 5+ unit buildings).
Forward outlook
- Local home prices are declining (-3.0%/yr); year-one equity from $864 of loan paydown is wiped out by about $4k of value loss. Plan a longer hold.
- Grant County population projected at +16% by 2050 — long-run rental-demand tailwind backs the buy-and-hold thesis.
- At projected returns (-3.0% appreciation + 0.0% rent growth), your $35k cash investment doubles in ~10 years — after that, you're playing with house money.
Negotiation context
- Only 7 days on market — expect competitive offers; lowballing is unlikely to land.
- 2 sale attempts since 7y ago with the ask held roughly flat each time — persistent listings suggest the price (not the market) is what's stuck; bring a comps-based counter.
Questions for the listing agent
- Built in 1961 — when were the roof, HVAC, electrical panel, plumbing, and water heater last replaced?
- Is there a deadline driving the sale (1031 exchange, divorce, estate, relocation)? That informs how much negotiation room exists.
- Schools are F-rated, which usually means shorter tenancies and higher turnover. Who's the typical renter profile here, and what's been the actual vacancy rate?
- What's the average days-on-market for RENTAL listings here right now (not sales)? A rising rental-DOM trend means longer vacancies and softer asking-rent achievability than the comps imply.
- What's the recent tenant-quality profile in this submarket — average credit score on applications, eviction rate, late-payment / NSF rate, and stable-employment percentage? A property-management company in the area should have these aggregated.
- How much new for-sale + rental construction is in the pipeline within 1–3 miles? Heavy new supply typically softens prices + rents 12–24 months out; constrained supply supports both.
Investment metrics
- 1% rule
- 1.33% ✓
- Cap rate
- 11.10%
- Cash-on-cash
- 17.17%
- DSCR
- 1.76
- GRM
- 6.3
CMA / ARV
- ARV (median comp)
- $254,122
- List price
- $125,000
- Delta
- -50.81%
- Verdict
- UNDERPRICED
- Comps
- 20 within 1.0 mi
Show comp detail 12 sales within ~0.75 mi
| Address | Dist | Beds/Ba | Sqft | Sold | Price | $/sf | Match |
|---|---|---|---|---|---|---|---|
| 130 Schilling Dr | 0.00mi | 3/2.0 | 1,437 (0%) | 1mo | $132,700 | $92 | 99 |
| 9021 McConnell Dr Unit A | 0.25mi | 3/1.5 | 1,454 (+1%) | 1mo | $250,000 | $172 | 83 |
| 9016 Bong Loop Dr Unit B | 0.30mi | 3/1.5 | 1,454 (+1%) | 3mo | $265,000 | $182 | 80 |
| 9023 McConnell Dr Unit B | 0.24mi | 3/1.5 | 1,454 (+1%) | 9mo | $207,000 | $142 | 77 |
| 9011 Bong Loop Unit B | 0.33mi | 3/1.5 | 1,454 (+1%) | 12mo | $255,000 | $175 | 71 |
| 1233 Vandenburg Loop | 0.15mi | 4/2.0 (+1) | 1,338 (-7%) | 14mo | $270,000 | $202 | 65 |
| 9010 Bong Loop | 0.36mi | 4/2.0 (+1) | 1,502 (+4%) | 12mo | $213,000 | $142 | 61 |
| 407 Offut Dr | 0.57mi | 3/2.0 | 1,350 (-6%) | 10mo | $295,000 | $219 | 55 |
| 449 Offutt Dr | 0.54mi | 3/2.0 | 1,560 (+9%) | 10mo | $150,000 | $96 | 52 |
| 1214 Arnold Dr | 0.56mi | 4/1.0 (+1) | 1,364 (-5%) | 6mo | $265,000 | $194 | 51 |
| 1244 Adair St | 0.63mi | 3/2.0 | 1,256 (-13%) | 8mo | $297,000 | $236 | 43 |
| 1217 Lowry St | 0.61mi | 4/2.0 (+1) | 1,276 (-11%) | 12mo | $194,850 | $153 | 37 |
Match score weights: distance 35% · size 25% · config 20% · recency 20%. Top-matched comps best support the ARV.
Projected returns pro-forma
-3.0% appreciation · 0.0% rent growth · sell at horizon
- IRR
- 5.2%
- Equity multiple
- 1.19×
- Total profit
- $6,767
- Equity at exit
- $18,638
- IRR
- 11.8%
- Equity multiple
- 1.80×
- Total profit
- $28,147
- Equity at exit
- $10,808
Cash invested: $35,000 (down + closing). Projections, not guarantees.
Landlord ↔ Tenant lean methodology
- Overall (STATE)
- 28 Tenant-Leaning
- State Washington
- 28 Tenant-Leaning · D+8
- County
- — inherits STATE
- City
- — inherits STATE
ZIP-level market 98837
- Rents YoY
- -1.7%
- Active inventory
- 589
- Price-to-rent
- 6.3×
Monthly cashflow live
- Estimated rent
- $1,657 high interval (Pro) →
- Mortgage (P&I)
- −$656
- Tax from tax record
- −$101 /mo · $1,213/yr
- Insurance
- −$52
- HOA
- −$0
- Vacancy / Maint / Mgmt
- −$348
- Net cashflow
- $501
Break-even live
Sensitivity live
| Price | -10% $571 | -5% $536 | +0% $501 | +5% $465 | +10% $430 |
|---|---|---|---|---|---|
| Rent | -10% $370 | -5% $435 | +0% $501 | +5% $566 | +10% $632 |
| Rate | -1.0pp $564 | -0.5pp $532 | base $501 | +0.5pp $468 | +1.0pp $435 |
UW: 25.0% down · 7.5% · 30yr · 1.5% tax · 5.0% vac · 8.0% maint · 8.0% mgmt
Financing live
Cash to close
- Down payment
- $31,250
- Closing costs
- $3,750
- Reserves months
- —
- Total cash needed
- —
Loan-product check · same deal, 3 products live
Conventional
25% down · 7.5% · 30yr
- Down + closing
- —
- Monthly P&I
- —
- Monthly cashflow
- —
- DSCR
- —
- Eligible?
- —
Personal DTI + credit; lowest rate.
DSCR
20% down · 8.5% · 30yr
- Down + closing
- —
- Monthly P&I
- —
- Monthly cashflow
- —
- DSCR
- —
- Eligible?
- —
No personal income docs; deal must DSCR.
Hard money
10% down · 12.0% · 12mo
- Down + closing
- —
- Monthly P&I
- —
- Monthly cashflow
- —
- DSCR
- —
- Eligible?
- —
Short-term bridge; refi at stabilization.
Rent comps 8 comps
| Address | Beds | Baths | Sqft | Rent | $/sqft | DOM | Units | Dist |
|---|---|---|---|---|---|---|---|---|
| 1232 Vandenburg Ave Moses Lake, WA | 2.0 | 1.0 | 960 | $1,250 | $1.30 | 45d | 1 | 0.14mi |
| 8915 Travis Dr Unit B Moses Lake, WA | 3.0 | 1.0 | 1144 | $1,100 | $0.96 | 45d | 1 | 0.29mi |
| 205 March Dr NE Unit Labs Moses Lake, WA | 3.0 | 1.5 | 1440 | $1,750 | $1.22 | 45d | 1 | 0.38mi |
| 207 March Dr NE Moses Lake, WA | 3.0 | 1.5 | 1220 | $1,850 | $1.52 | 45d | 1 | 0.39mi |
| 7622 McDougal Ave NE Unit 3 Moses Lake, WA | 3.0 | 2.5 | 1810 | $2,300 | $1.27 | 45d | 1 | 0.49mi |
| 7560 McDougal Ave NE Unit C Moses Lake, WA | 2.0 | 2.0 | 1360 | $1,950 | $1.43 | 45d | 1 | 0.52mi |
| 1422 E Craig St Moses Lake, WA | 2.0–4.0 | 1.0–2.0 | 980 | $1,138 | $1.16 | 46d | 1 | 0.90mi |
| 4727 Owens Rd NE #24 Moses Lake, WA | 2.0 | 1.0 | 900 | $1,200 | $1.33 | 45d | 1 | 1.10mi |
Listing history 7 events
-
2026-05-18status Pending
-
2026-05-11$125,000 Active
-
2019-10-15soldstatus $139,900 Sold
-
2019-10-15soldstatus $139,900
-
2019-09-26status Pending
-
2019-09-25status Pending Inspection
-
2019-09-13$139,900 Active
ⓘ Source: listings_history table (triggers on properties + properties_extension) + one-shot
backfill from property_details.listing_events for pre-trigger history.
Tax reassessment forecast WA · Resets to sale price
- Current annual tax
- $1,213 · $101/mo
- Projected year-2 tax
- $1,225 · $102/mo
- Expected delta
- +$12/yr (+$1/mo · 1.0%)
ⓘ Screening estimate from a state-policy table — verify with the county assessor before closing.
Climate risk First Street
- Flood 1/10 Low FEMA zone X (unshaded) · 0% chance over 30 yrs
- Wildfire 4/10 Moderate
- Heat 4/10 Moderate 7 d/yr ≥96°F today · 14 d/yr by 30 yrs out
- Wind 1/10 Low
- Air quality 9/10 Extreme 18 unhealthy d/yr today · 18 by 30 yrs out
Nearby sold comps map
Loading sold comps map…
Walkable amenities ~0.75 mi
Loading nearby amenities…
Taxation est. · year 1
- Rental income
- $19,890
- − Mortgage interest
- −$7,002
- − Property taxes
- −$1,213
- − Insurance
- −$625
- − Repairs & maintenance
- −$1,591
- − Management
- −$1,591
- − Depreciation
- −$3,636
- Taxable income
- $4,231
- Est. tax owed @ 24.0%
- −$1,015
- After-tax cash flow
- $4,993/yr
For passive investors: Depreciation is non-cash, so a rental often shows a tax loss while cash-flowing — sheltering income. Rental losses are passive: they offset passive income freely, and up to $25,000/yr can offset ordinary (W-2) income if you actively participate and your MAGI is under $100k (phasing out to $0 by $150k); unused losses carry forward. On sale, claimed depreciation is recaptured at up to 25%, and gains may owe capital-gains tax (a 1031 exchange can defer both). Figures are a year-1 estimate at your 24.0% rate — not tax advice; consult a CPA.
Schools (NCES district)
- District
- Moses Lake School District
- NCES district ID
- 5305220
- Math proficiency
- 38% ▬ 0.00%
- Reading proficiency
- 48% ▼ -1.00%
- Median HH income
- $49,033
- Composite
- 39.17/100
- National rank
- #8232
- State rank
- #198 of 291 in WA
Livability — Moses Lake North
- Score
- 65/100
- State rank
- #351
- US rank
- #13402
Category grades
Schools grade is shown separately in the Schools card above.
Census & demographics
- Census place
- Moses Lake North, WA
- County
- Grant County · 61,643 people
- Metro
- Moses Lake, WA
- Population (ZIP)
- 49,455
- Household income
- $74,586
- Rent vs Own
- Severe rent burden
- 1064.0
Population outlook (Grant County) Hauer SSP2
- Today (2025)
- 99,356 people
- By 2030
- 102,107 · +2.8%
- By 2040
- 108,318 · +9.0%
- By 2050
- 114,712 · +15.5%
- By 2075
- 131,376 · +32.2%
- By 2100
- 146,163 · +47.1%
Race, ethnicity, and origin ACS 2023
- Neighborhood character
- Diverse neighborhood (Simpson 0.55)
- Race & ethnicity
- White 58% Hispanic / Latino 33% Two or more races 15% Black 2% Asian 1%
- Hispanic origin (detail)
- Mexican 30%
- Common ancestry
- Portuguese 3% Subsaharan African 2% Lithuanian 2%
- Foreign-born
- 10% · Canada
- Languages at home
- 76% English-only · Spanish 21% Russian/Polish/Slavic 2%
Political lean MEDSL · Grant
- 2024 margin
- Solid R (+37.5) · D 30.0% · R 67.4% · Other 2.6%
- 2008→2024 swing
- -9.9pp toward R · 2008: -27.5pp · 2024: -37.5pp
- All cycles
- 2024: R+37.5 2020: R+34.4 2016: R+37.9 2012: R+32.6 2008: R+27.5
Not yet ingested
- Civics
- —
Market trends
- HPI YoY
- ▼ -384.29%
- Current HPI
- 208.4574
- Rent YoY
- ▼ -1.72%
- Metro
- Moses Lake, WA
- State GDP YoY
- ▲ 4.65%
- F500 in state
- 22
Industry mix (Fortune 500 HQ in WA)
| Industry | F500 HQs | Revenue |
|---|---|---|
| Retail | 2 | $269B |
|
||
| Technology / Retail | 1 | $638B |
|
||
| Technology | 1 | $245B |
|
||
| Telecommunications | 1 | $38B |
|
||
| Food / Beverage | 1 | $36B |
|
||
| Automotive / Trucks | 1 | $34B |
|
||
Price history
-4.9% since first listed9 events — show timeline
- 2026-05-29 Sold (Public Records) $133,000 Public Records
- 2026-05-29 Sold (MLS) $132,700 NWMLS as Distributed by MLS Grid
- 2026-05-18 Pending — NWMLS as Distributed by MLS Grid
- 2026-05-11 Listed $125,000 NWMLS as Distributed by MLS Grid
- 2019-10-15 Sold (Public Records) $139,900 Public Records
- 2019-10-15 Sold (MLS) $139,900 NWMLS as Distributed by MLS Grid
- 2019-09-26 Pending — NWMLS as Distributed by MLS Grid
- 2019-09-25 Pending — NWMLS as Distributed by MLS Grid
- 2019-09-13 Listed $139,900 NWMLS as Distributed by MLS Grid
Property tax history
-1.0%/yrLatest (2026): $1,213 · +0.0% YoY. Source: county tax records.
Cash-flow waterfall
monthlySold comps — $/sqft
last 12 mo · ≤1 miLoading sold comps…