 🏷️ Likely Rental
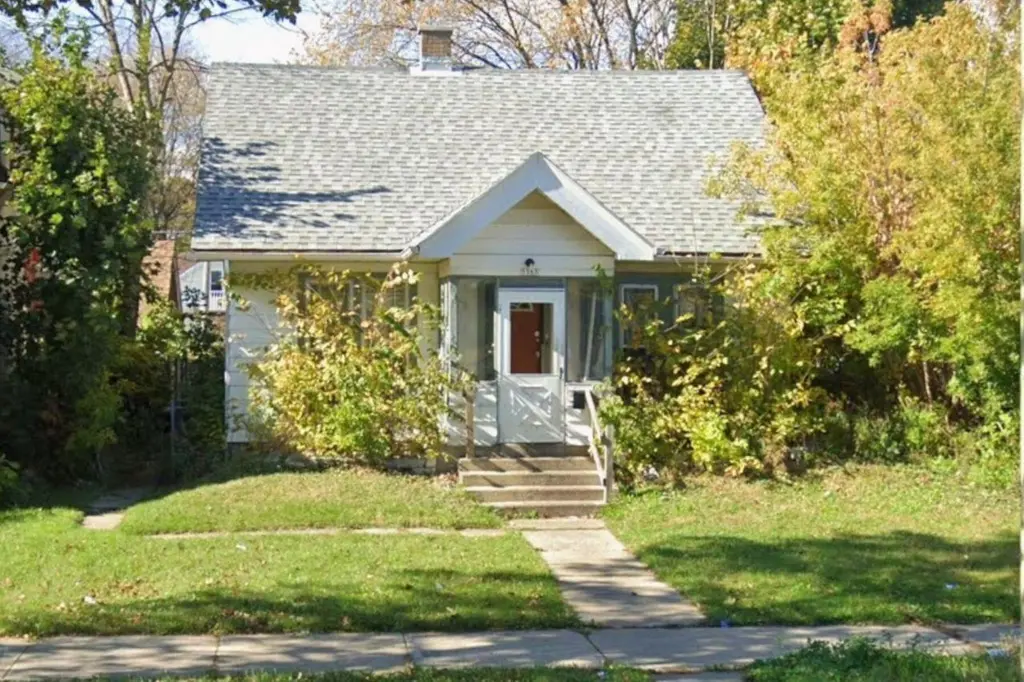
5565 N 35th St · Milwaukee, WI
Flood risk 1/10 · Minimal
- FEMA flood zone
- X (unshaded)
- Chance of flooding over 30 yrs
- 0.0%
- Est. flood insurance / yr
- $473 – $860
Fire risk 1/10 · Minimal
- Est. fire insurance / yr
- $636 – $1,182
Heat risk 2/10 · Minimal
- Hot days now (above 98°F)
- 7 days/yr
- Hot days in 30 yrs
- 13 days/yr
Wind risk 2/10 · Minimal
- Chance of severe wind over 30 yrs
- —
Air-quality risk 2/10 · Minimal
- Unhealthy air days now
- 2 days/yr
- Unhealthy air days in 30 yrs
- 2 days/yr
Risk factors via First Street. Map © Google.
Why this score? — see what drove the B+ grade
The composite is a weighted blend of 9 inputs, each scored 0–100. Each bar is that input's sub-score; the figure is the points it added to the 100-point composite (weight × sub-score).
- Cash flow +30.0/30.0
- ARV discount +15.0/15.0
- 1% rule +10.0/10.0
- DSCR +10.0/10.0
- Rent growth +4.7/5.0
- Livability +4.0/5.0
- Condition / age +2.5/5.0
- Schools +1.2/10.0
- Appreciation +0.0/10.0
$99,900
🖨 Deal sheet 📄 Offer letter ✓ Due diligence
Listing remarks MLS
Investment opportunity. Currently occupied 5 bedroom home. Rent is $800/month.
Key facts
- Parking spaces
- Full basement
- 5,227 sq ft lot
Tags
Property features AI
Finance
- Other: Seller and tenant personal property excluded
Exterior
- Parking: 1 parking space
- Utilities: Municipal water; Municipal sewer; Natural gas
- Home design: Single-family home; 1.5-story design; Less than 1/2 acre lot (0.12 acre); Zoned LB2
- Construction: Aluminum/steel exterior; Year built from assessor/public record
- Exterior features: Patio; Sidewalks
Interior
- Kitchen: Kitchen on main level (14 x 10)
- Bedrooms: Master bedroom on main level (15 x 11); Bedroom 2 on main level (11 x 11); Bedroom 3 on upper level (11 x 11); Bedroom 4 on upper level (12 x 10); Bedroom 5 on upper level (12 x 11)
- Bathrooms: Full bath with tub only; Full bath with shower over tub
- Heating & cooling: Forced air heating (natural gas)
- Interior features: Cable/satellite available; Full block basement
Neighborhood map
What this means for you Summary
Snapshot
- This is a 5-bed/1.0-bath single-family listed at $100k.
Deal economics
- At list price, monthly cash flow is $781 ($9k/yr) — positive.
- The deal already cash-flows at list — no discount required.
- Meets the 1% rule at list price ($2k rent vs $100k).
- Cap rate 15.7% vs local median 5.1% in Milwaukee — top-decile yield for the area; either an underpriced asset or a hidden risk that comps aren't pricing in. Stress-test before assuming the spread holds.
Location & tenants
- Location reads 81/100 on livability (#55 in WI, #1,534 nationally) — a professional / high-income tenant draw. Strengths: amenities A+, commute A+, cost of living A+; Watch: employment D+, schools F, crime F.
- Milwaukee School District (urban): math 10% / reading 18% proficiency, ranked #337 of 342 in WI (top 98%) — low school quality limits family demand, transient renter base, plan for 1-2y turnover; 77% free/reduced lunch — lower-income household profile, screen leases tightly.
- Market conditions: Rents rising fast (+8.6%/yr); 168 active listings in the ZIP; 4 comparable units currently listed for rent nearby; rentals at typical pace (median 24d on market — plan ~3-4 weeks tenant-placement turnaround); 1,017 units permitted in Milwaukee County in 2024 (803 in 5+ unit buildings).
- At $1,999/mo this rent would consume 49% of the median local household income ($48k/yr) (locally 3390% of renters already pay >50% of income on rent) — very limited rent-growth headroom before tenants either downsize or default.
Forward outlook
- Local home prices are declining (-3.0%/yr); year-one equity from $691 of loan paydown is wiped out by about $3k of value loss. Plan a longer hold.
- Milwaukee County population projected at +4% by 2050 — modest demand growth; plan on rents tracking national, not racing it.
- At projected returns (-3.0% appreciation + 8.0% rent growth), your $28k cash investment doubles in ~4 years — after that, you're playing with house money.
Negotiation context
- Only 1 days on market — expect competitive offers; lowballing is unlikely to land.
- 4 sale attempts since 13y ago with the ask held roughly flat each time — persistent listings suggest the price (not the market) is what's stuck; bring a comps-based counter.
Risks & watch-outs
- Watch-outs: property tax is 2.8% of price; built in 1926 — expect roof / HVAC / electrical / plumbing capex.
Questions for the listing agent
- Built in 1926 — when were the roof, HVAC, electrical panel, plumbing, and water heater last replaced?
- Property tax is high relative to price — has the assessment been appealed recently, and will the sale trigger a re-assessment?
- Is there a deadline driving the sale (1031 exchange, divorce, estate, relocation)? That informs how much negotiation room exists.
- Schools are F-rated, which usually means shorter tenancies and higher turnover. Who's the typical renter profile here, and what's been the actual vacancy rate?
- Crime grade is F in this area — have there been break-ins, vandalism, or insurance claims at this property in the last 3 years? What carrier currently insures it and at what premium?
- What's the average days-on-market for RENTAL listings here right now (not sales)? A rising rental-DOM trend means longer vacancies and softer asking-rent achievability than the comps imply.
- What's the recent tenant-quality profile in this submarket — average credit score on applications, eviction rate, late-payment / NSF rate, and stable-employment percentage? A property-management company in the area should have these aggregated.
- How much new for-sale + rental construction is in the pipeline within 1–3 miles? Heavy new supply typically softens prices + rents 12–24 months out; constrained supply supports both.
Investment metrics
- 1% rule
- 2.00% ✓
- Cap rate
- 15.68%
- Cash-on-cash
- 33.52%
- DSCR
- 2.49
- GRM
- 4.2
CMA / ARV
- ARV (on-the-fly)
- $170,980
- Comps found
- 12
Show comp detail 12 sales within ~0.75 mi
| Address | Dist | Beds/Ba | Sqft | Sold | Price | $/sf | Match |
|---|---|---|---|---|---|---|---|
| 5312 N 36th St | 0.33mi | 4/2.0 (-1) | 1,638 (-1%) | 1mo | $201,000 | $123 | 73 |
| 5410 N 37th St | 0.22mi | 4/2.0 (-1) | 1,642 (-1%) | 12mo | $95,000 | $58 | 68 |
| 5542 N 40th St | 0.28mi | 4/1.5 (-1) | 1,695 (+2%) | 11mo | $175,000 | $103 | 67 |
| 5403 N 37th St | 0.25mi | 4/1.5 (-1) | 1,498 (-10%) | 4mo | $129,000 | $86 | 62 |
| 5479 N 36th St | 0.12mi | 4/1.5 (-1) | 1,807 (+9%) | 13mo | $190,000 | $105 | 62 |
| 5561 N 40th St | 0.30mi | 4/3.0 (-1) | 1,586 (-4%) | 6mo | $200,000 | $126 | 60 |
| 5402 N 41st St | 0.40mi | 4/1.5 (-1) | 1,522 (-8%) | 4mo | $145,000 | $95 | 57 |
| 5377 N 39th St | 0.34mi | 4/1.0 (-1) | 1,495 (-10%) | 13mo | $149,900 | $100 | 52 |
| 5936 N 42nd St | 0.61mi | 4/2.0 (-1) | 1,750 (+5%) | 2mo | $220,000 | $126 | 52 |
| 6025 N 35th St | 0.58mi | 4/2.0 (-1) | 1,505 (-9%) | 2mo | $112,000 | $74 | 47 |
| 5862 N 37th St | 0.39mi | 4/1.5 (-1) | 1,900 (+14%) | 8mo | $227,000 | $119 | 44 |
| 3726 W Fairmount Ave | 0.73mi | 4/1.0 (-1) | 1,411 (-15%) | 7mo | $75,000 | $53 | 30 |
Match score weights: distance 35% · size 25% · config 20% · recency 20%. Top-matched comps best support the ARV.
Projected returns pro-forma
-3.0% appreciation · 8.0% rent growth · sell at horizon
- IRR
- 34.8%
- Equity multiple
- 2.58×
- Total profit
- $44,241
- Equity at exit
- $14,895
- IRR
- 44.3%
- Equity multiple
- 6.40×
- Total profit
- $151,086
- Equity at exit
- $8,638
Cash invested: $27,972 (down + closing). Projections, not guarantees.
Landlord ↔ Tenant lean methodology
- Overall (STATE)
- 73 Landlord-Friendly
- State Wisconsin
- 73 Landlord-Friendly · R+2
- County
- — inherits STATE
- City
- — inherits STATE
ZIP-level market 53209
- Rents YoY
- 8.6%
- Active inventory
- 168
- Price-to-rent
- 4.2×
Monthly cashflow live
- Estimated rent
- $1,999 medium interval (Pro) →
- Mortgage (P&I)
- −$524
- Tax from tax record
- −$232 /mo · $2,789/yr
- Insurance
- −$42
- HOA
- −$0
- Vacancy / Maint / Mgmt
- −$420
- Net cashflow
- $781
Break-even live
UW: 25.0% down · 7.5% · 30yr · 1.5% tax · 5.0% vac · 8.0% maint · 8.0% mgmt
Financing live
Cash to close
- Down payment
- $24,975
- Closing costs
- $2,997
- Reserves months
- —
- Total cash needed
- —
Loan-product check · same deal, 3 products live
Conventional
25% down · 7.5% · 30yr
- Down + closing
- —
- Monthly P&I
- —
- Monthly cashflow
- —
- DSCR
- —
- Eligible?
- —
Personal DTI + credit; lowest rate.
DSCR
20% down · 8.5% · 30yr
- Down + closing
- —
- Monthly P&I
- —
- Monthly cashflow
- —
- DSCR
- —
- Eligible?
- —
No personal income docs; deal must DSCR.
Hard money
10% down · 12.0% · 12mo
- Down + closing
- —
- Monthly P&I
- —
- Monthly cashflow
- —
- DSCR
- —
- Eligible?
- —
Short-term bridge; refi at stabilization.
Rent comps 4 comps
| Address | Beds | Baths | Sqft | Rent | $/sqft | DOM | Units | Dist |
|---|---|---|---|---|---|---|---|---|
| 4334 W Eggert Pl Milwaukee, WI | 4.0 | 1.0 | 1077 | $1,695 | $1.57 | 24d | 1 | 0.77mi |
| 4340 W Eggert Pl Milwaukee, WI | 4.0 | 1.0 | 1066 | $1,695 | $1.59 | 24d | 1 | 0.77mi |
| 5073 N 48th St Milwaukee, WI | 4.0 | 1.0 | 1152 | $1,595 | $1.38 | 15d | 1 | 1.02mi |
| 2225 W Mill Rd Glendale, WI | 4.0 | 2.0 | 1945 | $2,495 | $1.28 | 24d | 1 | 1.34mi |
Listing history 2 events
-
2026-06-18remarks 535-char remark
-
2026-06-18$99,900 Pending 1 DOM
ⓘ Source: listings_history table (triggers on properties + properties_extension) + one-shot
backfill from property_details.listing_events for pre-trigger history.
Tax reassessment forecast WI · Partial reset (capped growth)
- Current annual tax
- $2,789 · $232/mo
- Projected year-2 tax
- $2,789 · $232/mo
- Expected delta
- $0/yr ($0/mo · 0.0%)
ⓘ Screening estimate from a state-policy table — verify with the county assessor before closing.
Climate risk First Street
- Flood 1/10 Low FEMA zone X (unshaded) · 0% chance over 30 yrs
- Wildfire 1/10 Low
- Heat 2/10 Low 7 d/yr ≥98°F today · 13 d/yr by 30 yrs out
- Wind 2/10 Low
- Air quality 2/10 Low 2 unhealthy d/yr today · 2 by 30 yrs out
Nearby sold comps map
Loading sold comps map…
Walkable amenities ~0.75 mi
Loading nearby amenities…
Taxation est. · year 1
- Rental income
- $23,990
- − Mortgage interest
- −$5,596
- − Property taxes
- −$2,789
- − Insurance
- −$500
- − Repairs & maintenance
- −$1,919
- − Management
- −$1,919
- − Depreciation
- −$2,906
- Taxable income
- $8,361
- Est. tax owed @ 24.0%
- −$2,007
- After-tax cash flow
- $7,370/yr
For passive investors: Depreciation is non-cash, so a rental often shows a tax loss while cash-flowing — sheltering income. Rental losses are passive: they offset passive income freely, and up to $25,000/yr can offset ordinary (W-2) income if you actively participate and your MAGI is under $100k (phasing out to $0 by $150k); unused losses carry forward. On sale, claimed depreciation is recaptured at up to 25%, and gains may owe capital-gains tax (a 1031 exchange can defer both). Figures are a year-1 estimate at your 24.0% rate — not tax advice; consult a CPA.
Schools (NCES district)
- District
- Milwaukee School District
- NCES district ID
- 5509600
- Math proficiency
- 10% ▼ -5.00%
- Reading proficiency
- 18% ▬ 0.00%
- Median HH income
- $36,339
- Composite
- 11.61/100
- National rank
- #9696
- State rank
- #337 of 342 in WI
Livability — Milwaukee
- Score
- 81/100
- State rank
- #55
- US rank
- #1534
Category grades
Schools grade is shown separately in the Schools card above.
Census & demographics
- Census place
- Milwaukee, WI
- County
- Milwaukee County · 926,379 people
- City population
- 573,768
- Metro
- Milwaukee-Waukesha, WI
- Population (ZIP)
- 45,170
- Household income
- $48,486
- Rent vs Own
- Severe rent burden
- 3390.0
Population outlook (Milwaukee County) Hauer SSP2
- Today (2025)
- 995,758 people
- By 2030
- 1,009,124 · +1.3%
- By 2040
- 1,028,128 · +3.3%
- By 2050
- 1,040,066 · +4.4%
- By 2075
- 1,057,849 · +6.2%
- By 2100
- 1,039,774 · +4.4%
Race, ethnicity, and origin ACS 2023
- Neighborhood character
- Predominantly Black (66%)
- Race & ethnicity
- Black 66% White 22% Hispanic / Latino 5% Two or more races 5% Asian 2%
- Hispanic origin (detail)
- Mexican 2% Puerto Rican 3%
- Common ancestry
- Romanian 3% Portuguese 1% Iranian 1%
- Foreign-born
- 3% · Canada
- Languages at home
- 92% English-only · Spanish 4% Other Asian/Pacific 1% Russian/Polish/Slavic 1%
Political lean MEDSL · Milwaukee
- 2024 margin
- Solid D (+38.5) · D 68.3% · R 29.8% · Other 1.8%
- 2008→2024 swing
- +2.7pp toward D · 2008: 35.9pp · 2024: 38.5pp
- All cycles
- 2024: D+38.5 2020: D+39.9 2016: D+37.5 2012: D+34.6 2008: D+35.9
Not yet ingested
- Civics
- —
Market trends
- HPI YoY
- ▼ -194.98%
- Current HPI
- 172.4275
- Rent YoY
- ▲ 8.61%
- Metro
- Milwaukee-Waukesha, WI
- State GDP YoY
- ▲ 2.10%
- F500 in state
- 20
Industry mix (Fortune 500 HQ in WI)
| Industry | F500 HQs | Revenue |
|---|---|---|
| Industrial Machinery | 4 | $23B |
|
||
| Industrial Technology | 2 | $36B |
|
||
| Insurance | 1 | $36B |
|
||
| Professional Services | 1 | $19B |
|
||
| Utilities | 1 | $9B |
|
||
| Consumer Goods | 1 | $3B |
|
||
Price history
+234.1% since first listed13 events — show timeline
- 2026-06-18 Pending — METROMLS
- 2026-06-18 Listed $99,900 METROMLS
- 2019-07-29 Sold (Public Records) $280,000 Public Records
- 2014-10-30 Sold (Public Records) $310,000 Public Records
- 2014-07-23 Sold (Public Records) $120,000 Public Records
- 2014-06-16 Listing Removed — METROMLS
- 2014-06-16 Listed $32,000 METROMLS
- 2014-06-09 Sold (MLS) $25,000 METROMLS
- 2013-02-10 Listing Removed — METROMLS
- 2013-02-10 Listed $56,857 METROMLS
- 2013-02-09 Listing Removed — METROMLS
- 2013-02-09 Listed $56,700 METROMLS
- 1992-04-01 Sold (Public Records) $29,900 Public Records
Property tax history
+9.0%/yrLatest (2024): $2,789 · -25.6% YoY. Source: county tax records.
Cash-flow waterfall
monthlySold comps — $/sqft
last 12 mo · ≤1 miLoading sold comps…