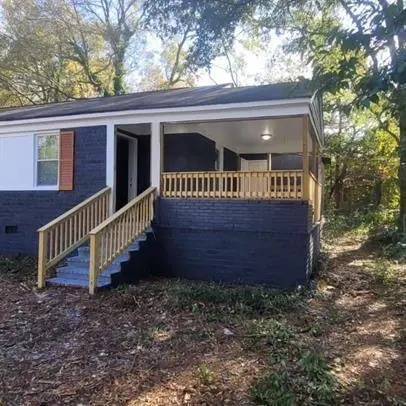
3110 Morehouse St · Columbus, GA
Flood risk 1/10 · Minimal
- FEMA flood zone
- X (unshaded)
- Chance of flooding over 30 yrs
- 0.0%
- Est. flood insurance / yr
- $507 – $1,088
Fire risk 1/10 · Minimal
- Est. fire insurance / yr
- $963 – $1,789
Heat risk 7/10 · Major
- Hot days now (above 107°F)
- 7 days/yr
- Hot days in 30 yrs
- 18 days/yr
Wind risk 6/10 · Moderate
- Chance of severe wind over 30 yrs
- 76.0%
Air-quality risk 4/10 · Minor
- Unhealthy air days now
- 5 days/yr
- Unhealthy air days in 30 yrs
- 6 days/yr
Risk factors via First Street. Map © Google.
Why this score? — see what drove the D+ grade
The composite is a weighted blend of 9 inputs, each scored 0–100. Each bar is that input's sub-score; the figure is the points it added to the 100-point composite (weight × sub-score).
- Cash flow +19.3/30.0
- ARV discount +7.5/15.0
- DSCR +6.1/10.0
- 1% rule +4.3/10.0
- Rent growth +3.7/5.0
- Livability +3.2/5.0
- Condition / age +2.5/5.0
- Schools +2.2/10.0
- Appreciation +0.0/10.0
$115,000
🖨 Deal sheet 📄 Offer letter ✓ Due diligence
Listing remarks MLS
Attention investors: income-producing property with tenant in place. Start collecting rent immediately at closing. No renovation delays, no lease-up period - just consistent rental income from a performing asset. Located in Columbus with strong rental demand, this property is positioned for long-term portfolio growth. Tenant-occupied; please do not disturb. Access provided with acceptable offer and proof of funds. Serious inquiries only.
Key facts
- 5,662 sq ft lot
- Built 1951
- Listed 88 days
Neighborhood map
What this means for you Summary
Snapshot
- This is a 3-bed/1.0-bath single-family listed at $115k.
Deal economics
- At list price, monthly cash flow is $127 ($2k/yr) — positive.
- The deal already cash-flows at list — no discount required.
- To meet the 1% rule (rent ≥ 1% of price), the offer needs to be $107k (7.1% below list).
- Recommended offer: $107k (7.1% below list) — sets the bar for 1% rule.
- Cap rate 7.6% vs local median 4.7% in Columbus — top-decile yield for the area; either an underpriced asset or a hidden risk that comps aren't pricing in. Stress-test before assuming the spread holds.
Location & tenants
- Location reads 64/100 on livability (#254 in GA) — a middle-class / working-renter tenant base. Strengths: cost of living A+, housing A+, health & safety B; Watch: amenities D+, schools F, crime F.
- Muscogee County (urban): math 21% / reading 30% proficiency, ranked #120 of 174 in GA (top 69%) — low school quality limits family demand, transient renter base, plan for 1-2y turnover; 61% free/reduced lunch — lower-income household profile, screen leases tightly.
- Market conditions: Rents rising fast (+4.8%/yr); 118 active listings in the ZIP; 23 comparable units currently listed for rent nearby; rentals at typical pace (median 21d on market — plan ~3-4 weeks tenant-placement turnaround); 43% of comp listings sitting > 30 days — soft ceiling on asking rent; lower-income renter base — watch delinquency; 291 units permitted in Muscogee County in 2024 (30 in 5+ unit buildings).
Forward outlook
- Local home prices are declining (-3.0%/yr); year-one equity from $795 of loan paydown is wiped out by about $3k of value loss. Plan a longer hold.
- Muscogee County population projected at +15% by 2050 — modest demand growth; plan on rents tracking national, not racing it.
Negotiation context
- It's been on market 88 days — a 6% lower offer ($108k) is reasonable based on typical stale-listing flexibility.
- 6 sale attempts since 3y ago with the ask held roughly flat each time — persistent listings suggest the price (not the market) is what's stuck; bring a comps-based counter.
Risks & watch-outs
- Watch-outs: built in 1951 — expect roof / HVAC / electrical / plumbing capex.
- Climate carrying-cost: major wind risk, 76% chance of damaging wind over 30y; extreme-heat days projected 7→18/yr by 2055 (HVAC capex compounding) — expect insurance premiums to compound above CPI over the hold.
Questions for the listing agent
- It's been on market 88 days. Have you received any prior offers? Is the seller open to a 7% concession, seller financing, or rate buy-down credit?
- Built in 1951 — when were the roof, HVAC, electrical panel, plumbing, and water heater last replaced?
- Why hasn't it sold? Are there any deal-killer items the seller is aware of (foundation, flood, title, zoning, code violations)?
- Is there a deadline driving the sale (1031 exchange, divorce, estate, relocation)? That informs how much negotiation room exists.
- Schools are F-rated, which usually means shorter tenancies and higher turnover. Who's the typical renter profile here, and what's been the actual vacancy rate?
- Crime grade is F in this area — have there been break-ins, vandalism, or insurance claims at this property in the last 3 years? What carrier currently insures it and at what premium?
- The area grade is low — what's the realistic commute time and amenity access for the typical tenant pool here? Any planned neighborhood developments (good or bad) we should know about?
- What's the average days-on-market for RENTAL listings here right now (not sales)? A rising rental-DOM trend means longer vacancies and softer asking-rent achievability than the comps imply.
- What's the recent tenant-quality profile in this submarket — average credit score on applications, eviction rate, late-payment / NSF rate, and stable-employment percentage? A property-management company in the area should have these aggregated.
- How much new for-sale + rental construction is in the pipeline within 1–3 miles? Heavy new supply typically softens prices + rents 12–24 months out; constrained supply supports both.
Investment metrics
- 1% rule
- 0.93% ✗
- Cap rate
- 7.62%
- Cash-on-cash
- 4.74%
- DSCR
- 1.21
- GRM
- 9.0
CMA / ARV
- ARV (median comp)
- $64,955
- List price
- $115,000
- Delta
- 77.05%
- Verdict
- OVERPRICED
- Comps
- 20 within 1.0 mi
Show comp detail 12 sales within ~0.75 mi
| Address | Dist | Beds/Ba | Sqft | Sold | Price | $/sf | Match |
|---|---|---|---|---|---|---|---|
| 1043 Vera Dr | 0.40mi | 3/1.0 | 1,045 (+2%) | 3mo | $62,500 | $60 | 76 |
| 2835 Thomas St | 0.32mi | 2/1.0 (-1) | 1,004 (-2%) | 5mo | $35,000 | $35 | 73 |
| 2830 East Wynnton Ln | 0.28mi | 3/1.0 | 1,020 (-0%) | 16mo | $70,000 | $69 | 73 |
| 938 Diggs Ave | 0.34mi | 3/1.0 | 925 (-10%) | 7mo | $48,500 | $52 | 62 |
| 3011 Colorado St | 0.16mi | 2/1.0 (-1) | 894 (-13%) | 9mo | $66,000 | $74 | 59 |
| 2822 Colorado St | 0.32mi | 2/2.0 (-1) | 1,120 (+10%) | 2mo | $41,000 | $37 | 59 |
| 2930 Hood St | 0.18mi | 3/1.0 | 1,176 (+15%) | 13mo | $65,000 | $55 | 56 |
| 2429 Bell St | 0.62mi | 2/1.0 (-1) | 966 (-6%) | 6mo | $22,142 | $23 | 52 |
| 2810 Thomas St | 0.38mi | 3/2.0 | 1,161 (+14%) | 5mo | $90,000 | $78 | 52 |
| 3003 Melrose Dr | 0.25mi | 3/1.0 | 1,176 (+15%) | 15mo | $95,000 | $81 | 51 |
| 959 Brighton Rd | 0.72mi | 3/1.0 | 1,050 (+3%) | 16mo | $108,900 | $104 | 49 |
| 2723 Fern St | 0.50mi | 3/2.0 | 1,150 (+12%) | 10mo | $149,000 | $130 | 43 |
Match score weights: distance 35% · size 25% · config 20% · recency 20%. Top-matched comps best support the ARV.
Projected returns pro-forma
-3.0% appreciation · 4.82% rent growth · sell at horizon
- IRR
- -7.1%
- Equity multiple
- 0.73×
- Total profit
- $-8,570
- Equity at exit
- $17,147
- IRR
- 4.5%
- Equity multiple
- 1.35×
- Total profit
- $11,330
- Equity at exit
- $9,943
Cash invested: $32,200 (down + closing). Projections, not guarantees.
Landlord ↔ Tenant lean methodology
- Overall (STATE)
- 90 Strongly Landlord-Friendly
- State Georgia
- 90 Strongly Landlord-Friendly · R+3
- County
- — inherits STATE
- City
- — inherits STATE
ZIP-level market 31906
- Rents YoY
- 4.8%
- Active inventory
- 118
- Price-to-rent
- 9.0×
Monthly cashflow live
- Estimated rent
- $1,069 high interval (Pro) →
- Mortgage (P&I)
- −$603
- Tax from tax record
- −$66 /mo · $794/yr
- Insurance
- −$48
- HOA
- −$0
- Vacancy / Maint / Mgmt
- −$224
- Net cashflow
- $127
Break-even live
UW: 25.0% down · 7.5% · 30yr · 1.5% tax · 5.0% vac · 8.0% maint · 8.0% mgmt
Financing live
Cash to close
- Down payment
- $28,750
- Closing costs
- $3,450
- Reserves months
- —
- Total cash needed
- —
Loan-product check · same deal, 3 products live
Conventional
25% down · 7.5% · 30yr
- Down + closing
- —
- Monthly P&I
- —
- Monthly cashflow
- —
- DSCR
- —
- Eligible?
- —
Personal DTI + credit; lowest rate.
DSCR
20% down · 8.5% · 30yr
- Down + closing
- —
- Monthly P&I
- —
- Monthly cashflow
- —
- DSCR
- —
- Eligible?
- —
No personal income docs; deal must DSCR.
Hard money
10% down · 12.0% · 12mo
- Down + closing
- —
- Monthly P&I
- —
- Monthly cashflow
- —
- DSCR
- —
- Eligible?
- —
Short-term bridge; refi at stabilization.
Rent comps 23 comps
| Address | Beds | Baths | Sqft | Rent | $/sqft | DOM | Units | Dist |
|---|---|---|---|---|---|---|---|---|
| 3128 Carver St Columbus, GA | 3.0 | 1.0 | 988 | $925 | $0.94 | 21d | 1 | 0.14mi |
| 3128 Carver St Columbus, GA | 3.0 | 1.0 | 988 | $1,000 | $1.01 | 43d | 1 | 0.14mi |
| 3309 10th St Columbus, GA | 3.0 | 1.0 | 1080 | $950 | $0.88 | 43d | 1 | 0.16mi |
| 3503 Ruben St Columbus, GA | 4.0 | 1.0 | 1054 | $1,100 | $1.04 | 13d | 1 | 0.39mi |
| 2728 9th St Columbus, GA | 3.0 | 1.0 | 880 | $865 | $0.98 | 43d | 1 | 0.46mi |
| 2724 9th St Columbus, GA | 2.0 | 1.0 | 900 | $875 | $0.97 | 13d | 1 | 0.46mi |
| 2801 Fern St Columbus, GA | 3.0 | 1.0 | 1100 | $975 | $0.89 | 43d | 1 | 0.52mi |
| 2750 Mimosa St Columbus, GA | 3.0 | 1.5 | 1357 | $1,250 | $0.92 | 13d | 1 | 0.55mi |
| 2834 Mimosa St Columbus, GA | 3.0 | 1.5 | 1257 | $1,100 | $0.88 | 43d | 1 | 0.57mi |
| 2983 Buena Vista Rd Columbus, GA | 2.0 | 1.0 | 920 | $735 | $0.80 | 43d | 1 | 0.60mi |
| 564 Chesterfield Ave Columbus, GA | 3.0 | 2.0 | 1230 | $1,100 | $0.89 | 21d | 1 | 0.70mi |
| 1111 Henry Ave Columbus, GA | 3.0 | 2.0 | 1407 | $1,200 | $0.85 | 43d | 1 | 0.71mi |
| 1521 Dixon Dr Columbus, GA | 2.0 | 2.0 | 1400 | $1,400 | $1.00 | 13d | 1 | 0.76mi |
| 1400 Boxwood Blvd Columbus, GA | 2.0–3.0 | 2.0 | 1262 | $1,355 | $1.07 | 13d | 6 | 0.78mi |
| 2201 Heard St Columbus, GA | 2.0 | 1.0 | 1005 | $975 | $0.97 | 21d | 1 | 0.99mi |
| 1258 Cedar Ave Columbus, GA | 2.0 | 2.0 | 1220 | $1,400 | $1.15 | 43d | 1 | 1.02mi |
| 1514 Forest Ave Columbus, GA | 2.0 | 1.5 | 1128 | $840 | $0.74 | 43d | 1 | 1.05mi |
| 1219 Eberhart Ave Unit 2 Columbus, GA | 2.0 | 1.0 | 1100 | $1,100 | $1.00 | 13d | 1 | 1.12mi |
| 3911 Steam Mill Rd Columbus, GA | 1.0–3.0 | 1.0–2.0 | 959 | $1,200 | $1.25 | 13d | 12 | 1.12mi |
| 3902 N Linden Dr Columbus, GA | 2.0 | 1.0 | 722 | $850 | $1.18 | 13d | 1 | 1.14mi |
| 920 Rosewood Dr Columbus, GA | 4.0 | 1.0 | 1325 | $1,350 | $1.02 | 21d | 1 | 1.35mi |
| 2602 Garden Dr Columbus, GA | 3.0 | 2.0 | 1250 | $1,175 | $0.94 | 21d | 1 | 1.36mi |
| 2630 Garden Dr Columbus, GA | 2.0 | 1.0 | 1008 | $755 | $0.75 | 43d | 1 | 1.36mi |
Listing history 14 events
-
2026-05-31days on market $115,000 Active 88 DOM
-
2026-05-30days on market $115,000 Active 87 DOM
-
2026-04-22price $95,000 443-char remark
Show marketing remark (443 chars)
Attention investors: income-producing property with tenant in place. Start collecting rent immediately at closing. No renovation delays, no lease-up period - just consistent rental income from a performing asset. Located in Columbus with strong rental demand, this property is positioned for long-term portfolio growth. Tenant-occupied; please do not disturb. Access provided with acceptable offer and proof of funds. Serious inquiries only.
-
2026-03-03$115,000 New 443-char remark
Show marketing remark (449 chars)
Attention investors: income-producing property with tenant in place. Start collecting rent immediately at closing. No renovation delays, no lease-up period – just consistent rental income from a performing asset. Located in Columbus with strong rental demand, this property is positioned for long-term portfolio growth. Tenant-occupied; please do not disturb. Access provided with acceptable offer and proof of funds. Serious inquiries only.
-
2026-03-03$115,000 Active 449-char remark
Show marketing remark (449 chars)
Attention investors: income-producing property with tenant in place. Start collecting rent immediately at closing. No renovation delays, no lease-up period – just consistent rental income from a performing asset. Located in Columbus with strong rental demand, this property is positioned for long-term portfolio growth. Tenant-occupied; please do not disturb. Access provided with acceptable offer and proof of funds. Serious inquiries only.
-
2026-01-22historical $800
-
2025-09-27price $800
-
2025-09-13$850
-
2024-10-21historical $850
-
2024-10-17$850
-
2024-02-01historical $900
-
2024-01-26$900
-
2024-01-21historical $900
-
2023-07-21$900
ⓘ Source: listings_history table (triggers on properties + properties_extension) + one-shot
backfill from property_details.listing_events for pre-trigger history.
Tax reassessment forecast GA · Resets to sale price
- Current annual tax
- $794 · $66/mo
- Projected year-2 tax
- $1,058 · $88/mo
- Expected delta
- +$264/yr (+$22/mo · 33.3%)
ⓘ Screening estimate from a state-policy table — verify with the county assessor before closing.
Climate risk First Street
- Flood 1/10 Low FEMA zone X (unshaded) · 0% chance over 30 yrs
- Wildfire 1/10 Low
- Heat 7/10 Severe 7 d/yr ≥107°F today · 18 d/yr by 30 yrs out
- Wind 6/10 Major 76% chance of damaging wind over 30 yrs
- Air quality 4/10 Moderate 5 unhealthy d/yr today · 6 by 30 yrs out
Nearby sold comps map
Loading sold comps map…
Walkable amenities ~0.75 mi
Loading nearby amenities…
Taxation est. · year 1
- Rental income
- $12,826
- − Mortgage interest
- −$6,442
- − Property taxes
- −$794
- − Insurance
- −$575
- − Repairs & maintenance
- −$1,026
- − Management
- −$1,026
- − Depreciation
- −$3,345
- Taxable loss
- −$382
- Est. tax savings @ 24.0%
- +$92
- After-tax cash flow
- $1,619/yr
For passive investors: Depreciation is non-cash, so a rental often shows a tax loss while cash-flowing — sheltering income. Rental losses are passive: they offset passive income freely, and up to $25,000/yr can offset ordinary (W-2) income if you actively participate and your MAGI is under $100k (phasing out to $0 by $150k); unused losses carry forward. On sale, claimed depreciation is recaptured at up to 25%, and gains may owe capital-gains tax (a 1031 exchange can defer both). Figures are a year-1 estimate at your 24.0% rate — not tax advice; consult a CPA.
Schools (NCES district)
- District
- Muscogee County
- NCES district ID
- 1303870
- Math proficiency
- 21% ▼ -11.00%
- Reading proficiency
- 30% ▼ -7.00%
- Median HH income
- $41,176
- Composite
- 21.6/100
- National rank
- #8297
- State rank
- #120 of 174 in GA
Livability — Columbus
- Score
- 64/100
- State rank
- #254
- US rank
- #14102
Category grades
Schools grade is shown separately in the Schools card above.
Census & demographics
- Census place
- Columbus, GA
- County
- Muscogee County · 180,764 people
- City population
- 180,764
- Metro
- Columbus, GA-AL
- Population (ZIP)
- 20,400
- Household income
- $44,965
- Rent vs Own
- Severe rent burden
- 1003.0
Population outlook (Muscogee County) Hauer SSP2
- Today (2025)
- 216,729 people
- By 2030
- 224,504 · +3.6%
- By 2040
- 238,318 · +10.0%
- By 2050
- 249,027 · +14.9%
- By 2075
- 264,862 · +22.2%
- By 2100
- 254,786 · +17.6%
Race, ethnicity, and origin ACS 2023
- Neighborhood character
- Majority Black (64%)
- Race & ethnicity
- Black 64% White 28% Hispanic / Latino 4% Two or more races 3% Asian 1%
- Common ancestry
- Slovak 1% Lithuanian 1% Hispanic 1%
- Foreign-born
- 3% · Canada
- Languages at home
- 95% English-only · Spanish 3% Other Indo-European 1%
Political lean MEDSL · Muscogee
- 2024 margin
- Strong D (+23.4) · D 61.4% · R 38.0%
- 2008→2024 swing
- +3.7pp toward D · 2008: 19.7pp · 2024: 23.4pp
- All cycles
- 2024: D+23.4 2020: D+24.0 2016: D+18.6 2012: D+21.3 2008: D+19.7
Not yet ingested
- Civics
- —
Market trends
- HPI YoY
- ▼ -122.49%
- Current HPI
- 113.2749
- Rent YoY
- ▲ 4.82%
- Metro
- Columbus, GA-AL
- State GDP YoY
- ▲ 2.66%
- F500 in state
- 28
Industry mix (Fortune 500 HQ in GA)
| Industry | F500 HQs | Revenue |
|---|---|---|
| Paper / Packaging | 2 | $29B |
|
||
| Retail | 1 | $160B |
|
||
| Transportation / Logistics | 1 | $91B |
|
||
| Airlines | 1 | $62B |
|
||
| Consumer Goods | 1 | $47B |
|
||
| Utilities | 1 | $25B |
|
||
Price history
-17.4% since first listed12 events — show timeline
- 2026-04-22 Price Changed $95,000 GAMLS
- 2026-03-03 Listed $115,000 FMLS
- 2026-03-03 Listed $115,000 GAMLS
- 2026-01-22 Rental Removed $800 TENANTTURNER2
- 2025-09-27 Price Changed $800 TENANTTURNER2
- 2025-09-13 Listed for Rent $850 TENANTTURNER2
- 2024-10-21 Rental Removed $850 RENTALBEAST
- 2024-10-17 Listed for Rent $850 RENTALBEAST
- 2024-02-01 Rental Removed $900 BUILDIUM
- 2024-01-26 Listed for Rent $900 BUILDIUM
- 2024-01-21 Rental Removed $900 BUILDIUM
- 2023-07-21 Listed for Rent $900 BUILDIUM
Property tax history
+3.1%/yrLatest (2025): $794 · -0.9% YoY. Source: county tax records.
Cash-flow waterfall
monthlySold comps — $/sqft
last 12 mo · ≤1 miLoading sold comps…