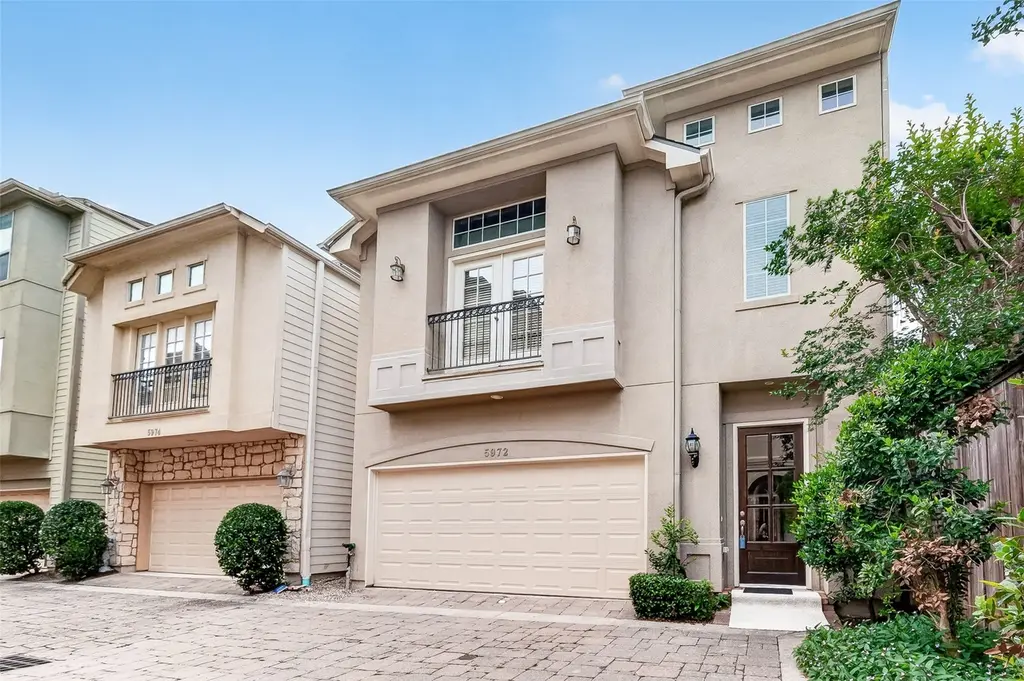
5972 Kansas Street St · Houston, TX
Flood risk 1/10 · Minimal
- FEMA flood zone
- X (unshaded)
- Chance of flooding over 30 yrs
- 0.0%
- Est. flood insurance / yr
- $507 – $1,088
Fire risk 1/10 · Minimal
- Est. fire insurance / yr
- $1,222 – $2,270
Heat risk 9/10 · Severe
- Hot days now (above 109°F)
- 7 days/yr
- Hot days in 30 yrs
- 24 days/yr
Wind risk 9/10 · Severe
- Chance of severe wind over 30 yrs
- 99.0%
Air-quality risk 3/10 · Minor
- Unhealthy air days now
- 2 days/yr
- Unhealthy air days in 30 yrs
- 3 days/yr
Risk factors via First Street. Map © Google.
Why this score? — see what drove the C- grade
The composite is a weighted blend of 9 inputs, each scored 0–100. Each bar is that input's sub-score; the figure is the points it added to the 100-point composite (weight × sub-score).
- Cash flow +15.8/30.0
- ARV discount +14.6/15.0
- 1% rule +5.7/10.0
- DSCR +4.9/10.0
- Livability +3.7/5.0
- Schools +2.7/10.0
- Condition / age +2.5/5.0
- Rent growth +2.3/5.0
- Appreciation +0.0/10.0
$424,900
🖨 Deal sheet 📄 Offer letter ✓ Due diligence
Listing remarks
RARE 3-story freestanding townhouse located in highly sought Cottage Grove community. Home has New Roof, Re-finished wood flooring thru 1st floor, New wood staircase, landing and 2nd floor hallway. New interior paint and carpet. This home offers a flexible floor plan with Rare 1st floor living and either 4 bedroom 3 1/2 bath, or 3 bedroom plus spacious third-floor bonus room, complete with private full bath and closet. Ideal for a guest suite, office or media room. The first floor features an inviting living space with travertine tile entry, newly refinished wood floors, triple crown molding, recess lighting, lots of windows and more. The kitchen is well appointed with granite countertop
Key facts
- New wood staircase
- New interior paint
- Private full bath
Tags
Property features AI
Finance
- Other: Lease considered
- HOA & community: Association managed by King Property Management; Gated community; Association maintains grounds and provides trash service; Annual association fee
Exterior
- Parking: Attached 2-car garage; Garage with door opener; Electric gate
- Security: Smoke detectors
- Utilities: Public water; Public sewer
- Home design: Residential property; Faces west; Built in 2005; Slab foundation
- Construction: Cement siding and stucco exterior; Composition roof
- Exterior features: Balcony; Fenced backyard; Corner lot
Interior
- Kitchen: Dishwasher; Gas cooktop; Gas oven; Disposal; Ice maker; Microwave; Refrigerator
- Bedrooms: Primary bedroom on second level; Additional bedrooms on second level; Total of 4 possible bedrooms
- Flooring: Carpet; Engineered hardwood; Laminate; Tile; Wood
- Bathrooms: 3 full bathrooms; 1 half bathroom
- Heating & cooling: Central heating (gas); Central air (electric)
- Interior features: Balcony; Crown molding; Double vanity; Granite counters; High ceilings; Kitchen/family room combo; Bath in primary bedroom; Multiple staircases; Pantry; Separate shower
- Laundry & utility: Washer and dryer included; Washer hookup; Electric dryer hookup; Gas dryer hookup
Neighborhood map
What this means for you Summary
Snapshot
- This is a 3-bed/3.0-bath single-family listed at $425k.
Deal economics
- At list price, monthly cash flow is $193 ($2k/yr) — positive.
- The deal already cash-flows at list — no discount required.
- Meets the 1% rule at list price ($5k rent vs $425k).
- Recommended offer: $412k (3.0% below list) — sets the bar for market timing.
- Cap rate 6.8% vs local median 3.2% in Houston — top-decile yield for the area; either an underpriced asset or a hidden risk that comps aren't pricing in. Stress-test before assuming the spread holds.
Location & tenants
- Location reads 74/100 on livability (#184 in TX, #4,771 nationally) — a middle-class / working-renter tenant base. Strengths: amenities A+, cost of living A+, housing A+; Watch: crime F.
- Houston ISD (urban): math 27% / reading 35% proficiency, ranked #593 of 826 in TX (top 72%) — families likely to look elsewhere, expect single-tenant / working-renter base with shorter leases; 71% free/reduced lunch — lower-income household profile, screen leases tightly.
- Zoned schools: Hogg Middle (math 44% / reading 48%, grade D+, #462 of 1,662 statewide, top 28%, 1,120 students, 52% FRL); Waltrip H S (math 15% / reading 32%, grade F, #1,342 of 1,632 statewide, top 82%, 1,597 students, 74% FRL).
- Market conditions: Rents soft (-0.8%/yr); 646 active listings in the ZIP; 23 comparable units currently listed for rent nearby; rentals at typical pace (median 24d on market — plan ~3-4 weeks tenant-placement turnaround); 43% of comp listings sitting > 30 days — soft ceiling on asking rent; high-income renter base; 29,883 units permitted in Harris County in 2024 (8,621 in 5+ unit buildings).
- This rent runs 38% of the median local income ($145k/yr) — at the standard rent-burdened threshold; future hikes will face affordability resistance.
Forward outlook
- Local home prices are declining (-3.0%/yr); year-one equity from $3k of loan paydown is wiped out by about $13k of value loss. Plan a longer hold.
- Harris County population projected at +47% by 2050 — long-run rental-demand tailwind backs the buy-and-hold thesis.
Negotiation context
- It's been on market 42 days — a 3% lower offer ($412k) is reasonable based on typical stale-listing flexibility.
- 6 sale attempts since 18y ago with the ask held roughly flat each time — persistent listings suggest the price (not the market) is what's stuck; bring a comps-based counter.
Risks & watch-outs
- Climate carrying-cost: severe wind risk, 99% chance of damaging wind over 30y; extreme-heat days projected 7→24/yr by 2055 (HVAC capex compounding) — expect insurance premiums to compound above CPI over the hold.
Questions for the listing agent
- It's been on market 42 days. Have you received any prior offers? Is the seller open to a 3% concession, seller financing, or rate buy-down credit?
- What does the HOA fee cover, when was the last increase, and are there any pending special assessments or reserve-fund shortfalls?
- Is there a deadline driving the sale (1031 exchange, divorce, estate, relocation)? That informs how much negotiation room exists.
- Schools are D-rated, which usually means shorter tenancies and higher turnover. Who's the typical renter profile here, and what's been the actual vacancy rate?
- Crime grade is F in this area — have there been break-ins, vandalism, or insurance claims at this property in the last 3 years? What carrier currently insures it and at what premium?
- What's the average days-on-market for RENTAL listings here right now (not sales)? A rising rental-DOM trend means longer vacancies and softer asking-rent achievability than the comps imply.
- What's the recent tenant-quality profile in this submarket — average credit score on applications, eviction rate, late-payment / NSF rate, and stable-employment percentage? A property-management company in the area should have these aggregated.
- How much new for-sale + rental construction is in the pipeline within 1–3 miles? Heavy new supply typically softens prices + rents 12–24 months out; constrained supply supports both.
Investment metrics
- 1% rule
- 1.07% ✓
- Cap rate
- 6.84%
- Cash-on-cash
- 1.95%
- DSCR
- 1.09
- GRM
- 7.8
CMA / ARV
- ARV (median comp)
- $505,137
- List price
- $424,900
- Delta
- -15.88%
- Verdict
- UNDERPRICED
- Comps
- 20 within 1.0 mi
Show comp detail 12 sales within ~0.75 mi
| Address | Dist | Beds/Ba | Sqft | Sold | Price | $/sf | Match |
|---|---|---|---|---|---|---|---|
| 6605 Letein St | 0.18mi | 3/2.5 | 2,344 (-1%) | 1mo | $550,000 | $235 | 87 |
| 5908 Kansas St Unit A | 0.09mi | 3/2.5 | 2,576 (+9%) | 0mo | $639,900 | $248 | 79 |
| 5734 Petty St | 0.31mi | 3/3.5 | 2,448 (+3%) | 2mo | $545,000 | $223 | 77 |
| 5903 Petty St Unit F | 0.18mi | 3/2.5 | 2,164 (-9%) | 1mo | $505,000 | $233 | 74 |
| 1628 Mcdonald St | 0.57mi | 3/3.5 | 2,420 (+2%) | 0mo | $575,000 | $238 | 67 |
| 5719 Darling St | 0.38mi | 4/3.0 (+1) | 2,537 (+7%) | 1mo | $490,000 | $193 | 65 |
| 2115 Cohn St | 0.58mi | 3/3.5 | 2,287 (-4%) | 2mo | $449,990 | $197 | 64 |
| 2709 Arabelle Grv | 0.30mi | 4/3.5 (+1) | 2,630 (+11%) | 0mo | $625,000 | $238 | 61 |
| 6313 Chelsea Falls Ln | 0.33mi | 3/3.5 | 2,050 (-14%) | 2mo | $445,000 | $217 | 58 |
| 3507 Ridgeway Valley Ln | 0.72mi | 3/3.5 | 2,458 (+4%) | 2mo | $749,000 | $305 | 57 |
| 1027 Golden Nectar Ln | 0.54mi | 3/3.5 | 2,628 (+11%) | 1mo | $810,000 | $308 | 54 |
| 3510 Huntsford Dr | 0.74mi | 3/2.5 | 2,596 (+10%) | 1mo | $610,000 | $235 | 47 |
Match score weights: distance 35% · size 25% · config 20% · recency 20%. Top-matched comps best support the ARV.
Projected returns pro-forma
-3.0% appreciation · 0.0% rent growth · sell at horizon
- IRR
- -17.1%
- Equity multiple
- 0.42×
- Total profit
- $-69,547
- Equity at exit
- $63,354
- IRR
- -17.2%
- Equity multiple
- 0.20×
- Total profit
- $-94,886
- Equity at exit
- $36,738
Cash invested: $118,972 (down + closing). Projections, not guarantees.
Landlord ↔ Tenant lean methodology
- Overall (STATE)
- 87 Strongly Landlord-Friendly
- State Texas
- 87 Strongly Landlord-Friendly · R+5
- County
- — inherits STATE
- City
- — inherits STATE
ZIP-level market 77007
- Rents YoY
- -0.8%
- Active inventory
- 646
- Price-to-rent
- 7.8×
Monthly cashflow live
- Estimated rent
- $4,559 high interval (Pro) →
- Mortgage (P&I)
- −$2,228
- Tax from tax record
- −$792 /mo · $9,502/yr
- Insurance
- −$177
- HOA
- −$211
- Vacancy / Maint / Mgmt
- −$957
- Net cashflow
- $193
Break-even live
UW: 25.0% down · 7.5% · 30yr · 1.5% tax · 5.0% vac · 8.0% maint · 8.0% mgmt
Financing live
Cash to close
- Down payment
- $106,225
- Closing costs
- $12,747
- Reserves months
- —
- Total cash needed
- —
Loan-product check · same deal, 3 products live
Conventional
25% down · 7.5% · 30yr
- Down + closing
- —
- Monthly P&I
- —
- Monthly cashflow
- —
- DSCR
- —
- Eligible?
- —
Personal DTI + credit; lowest rate.
DSCR
20% down · 8.5% · 30yr
- Down + closing
- —
- Monthly P&I
- —
- Monthly cashflow
- —
- DSCR
- —
- Eligible?
- —
No personal income docs; deal must DSCR.
Hard money
10% down · 12.0% · 12mo
- Down + closing
- —
- Monthly P&I
- —
- Monthly cashflow
- —
- DSCR
- —
- Eligible?
- —
Short-term bridge; refi at stabilization.
Rent comps 23 comps
| Address | Beds | Baths | Sqft | Rent | $/sqft | DOM | Units | Dist |
|---|---|---|---|---|---|---|---|---|
| 5732 Darling St Unit 1056419P Houston, TX | 3.0 | 3.5 | 2400 | $7,771 | $3.24 | 43d | 1 | 0.34mi |
| 3001 W 11th St Houston, TX | 3.0 | 1.0–2.0 | 1031 | $4,533 | $4.40 | 1d | 50 | 0.44mi |
| 5620 Petty St Unit 1019538P Houston, TX | 4.0 | 3.5 | 2884 | $16,259 | $5.64 | 21d | 1 | 0.49mi |
| 5620 Petty St Houston, TX | 4.0 | 3.5 | 2891 | $8,750 | $3.03 | 43d | 1 | 0.49mi |
| 5530 Kiam St Unit 1019540P Houston, TX | 4.0 | 2.5 | 2680 | $15,799 | $5.90 | 43d | 1 | 0.56mi |
| 5530 Kiam St Houston, TX | 4.0 | 2.5 | 2688 | $9,750 | $3.63 | 43d | 1 | 0.56mi |
| 2210 Radcliffe St Houston, TX | 3.0 | 3.5 | 2066 | $2,716 | $1.31 | 7d | 1 | 0.69mi |
| 2103 Radcliffe St Unit 1225772P Houston, TX | 3.0 | 2.0 | 1797 | $4,729 | $2.63 | 7d | 1 | 0.69mi |
| 5427 Kansas St Houston, TX | 3.0 | 4.0 | 2156 | $2,700 | $1.25 | 43d | 1 | 0.70mi |
| 543 T C Jester Blvd Unit 1225766P Houston, TX | 3.0 | 3.5 | 2389 | $5,222 | $2.19 | 15d | 1 | 0.74mi |
| 5336 Darling St Unit 1225767P Houston, TX | 3.0 | 3.0 | 2292 | $5,570 | $2.43 | 7d | 1 | 0.83mi |
| 5811 Maxie St Houston, TX | 3.0 | 3.5 | 2226 | $3,000 | $1.35 | 43d | 1 | 0.83mi |
| 929 Westcott St Houston, TX | 1.0–3.0 | 1.0–3.0 | 1375 | $9,263 | $6.74 | 3d | 22 | 0.93mi |
| 5235 Petty St Unit B Houston, TX | 3.0 | 2.5 | 2532 | $3,000 | $1.18 | 43d | 1 | 0.94mi |
| 920 Westcott St Houston, TX | 1.0–2.0 | 1.0–2.0 | 1175 | $3,306 | $2.81 | 1d | 29 | 0.95mi |
| 5610 Schuler St Houston, TX | 3.0 | 3.5 | 2614 | $3,111 | $1.19 | 5d | 1 | 0.97mi |
| 5108 Larkin St Houston, TX | 3.0 | 3.5 | 2108 | $2,850 | $1.35 | 44d | 1 | 1.10mi |
| 5305 Nett St Unit A Houston, TX | 3.0 | 3.5 | 2104 | $2,950 | $1.40 | 24d | 1 | 1.15mi |
| 5237 Center St Houston, TX | 3.0 | 3.0 | 2284 | $2,995 | $1.31 | 43d | 1 | 1.23mi |
| 4917 Nolda St Houston, TX | 3.0 | 3.5 | 1764 | $5,000 | $2.83 | 24d | 1 | 1.25mi |
| 1126 W 16th St Houston, TX | 3.0 | 4.0 | 2494 | $4,295 | $1.72 | 43d | 1 | 1.38mi |
| 1723 W 14th St Unit B Houston, TX | 3.0 | 3.5 | 2373 | $3,400 | $1.43 | 20d | 1 | 1.42mi |
| 2718 Katri Way Houston, TX | 3.0 | 2.5 | 1965 | $3,326 | $1.69 | 2d | 11 | 1.45mi |
HOA detail
- Monthly dues
- $211 · $2,532/yr
Listing history 23 events
-
2026-06-18days on market $424,900 Active 42 DOM
-
2026-06-17days on market $424,900 Active 41 DOM
-
2026-06-16days on market $424,900 Active 40 DOM
-
2026-06-16price $424,900 Active 39 DOM
-
2026-06-15days on market $435,000 Active 39 DOM
-
2026-06-13days on market $435,000 Active 37 DOM
-
2026-06-10days on market $435,000 Active 33 DOM
-
2026-06-08days on market $435,000 Active 32 DOM
-
2026-06-07days on market $435,000 Active 31 DOM
-
2026-06-04days on market $435,000 Active 28 DOM
-
2026-06-01days on market $435,000 Active 25 DOM
-
2026-05-31days on market $435,000 Active 24 DOM
-
2026-05-07$435,000 Active 981-char remark
-
2026-04-03historical $3,000
-
2026-04-03historical
-
2026-03-07$469,000 Active
-
2026-03-05$3,000
-
2012-06-08historical
-
2012-02-13$269,000
-
2008-10-25historical
-
2008-09-25$285,900
-
2008-07-24historical
-
2008-06-30$289,900
ⓘ Source: listings_history table (triggers on properties + properties_extension) + one-shot
backfill from property_details.listing_events for pre-trigger history.
Tax reassessment forecast TX · Resets to sale price
- Current annual tax
- $9,502 · $792/mo
- Projected year-2 tax
- $9,502 · $792/mo
- Expected delta
- $0/yr ($0/mo · 0.0%)
ⓘ Screening estimate from a state-policy table — verify with the county assessor before closing.
Climate risk First Street
- Flood 1/10 Low FEMA zone X (unshaded) · 0% chance over 30 yrs
- Wildfire 1/10 Low
- Heat 9/10 Extreme 7 d/yr ≥109°F today · 24 d/yr by 30 yrs out
- Wind 9/10 Extreme 99% chance of damaging wind over 30 yrs
- Air quality 3/10 Moderate 2 unhealthy d/yr today · 3 by 30 yrs out
Nearby sold comps map
Loading sold comps map…
Walkable amenities ~0.75 mi
Loading nearby amenities…
Taxation est. · year 1
- Rental income
- $54,704
- − Mortgage interest
- −$23,801
- − Property taxes
- −$9,502
- − Insurance
- −$2,124
- − Repairs & maintenance
- −$4,376
- − Management
- −$4,376
- − HOA
- −$2,532
- − Depreciation
- −$12,361
- Taxable loss
- −$4,369
- Est. tax savings @ 24.0%
- +$1,049
- After-tax cash flow
- $3,367/yr
For passive investors: Depreciation is non-cash, so a rental often shows a tax loss while cash-flowing — sheltering income. Rental losses are passive: they offset passive income freely, and up to $25,000/yr can offset ordinary (W-2) income if you actively participate and your MAGI is under $100k (phasing out to $0 by $150k); unused losses carry forward. On sale, claimed depreciation is recaptured at up to 25%, and gains may owe capital-gains tax (a 1031 exchange can defer both). Figures are a year-1 estimate at your 24.0% rate — not tax advice; consult a CPA.
Schools (NCES district)
- District
- Houston ISD
- NCES district ID
- 4823640
- Math proficiency
- 27% ▼ -18.00%
- Reading proficiency
- 35% ▼ -6.00%
- Median HH income
- $46,054
- Composite
- 26.63/100
- National rank
- #7173
- State rank
- #593 of 826 in TX
Livability — Houston
- Score
- 74/100
- State rank
- #184
- US rank
- #4771
Category grades
Schools grade is shown separately in the Schools card above.
Census & demographics
- Census place
- Houston, TX
- County
- Harris County · 4,702,590 people
- City population
- 3,226,434
- Metro
- Houston-The Woodlands-Sugar Land, TX
- Population (ZIP)
- 47,808
- Household income
- $144,911
- Rent vs Own
- Severe rent burden
- 1812.0
Population outlook (Harris County) Hauer SSP2
- Today (2025)
- 5,571,493 people
- By 2030
- 6,089,821 · +9.3%
- By 2040
- 7,142,806 · +28.2%
- By 2050
- 8,185,864 · +46.9%
- By 2075
- 10,574,329 · +89.8%
- By 2100
- 12,109,958 · +117.4%
Race, ethnicity, and origin ACS 2023
- Neighborhood character
- Diverse neighborhood (Simpson 0.63)
- Race & ethnicity
- White 57% Hispanic / Latino 17% Two or more races 13% Asian 11% Black 9%
- Hispanic origin (detail)
- Mexican 12%
- Common ancestry
- Slovak 3% Romanian 3% Italian 3%
- Foreign-born
- 19% · Canada, China, South Korea
- Languages at home
- 75% English-only · Spanish 12% Other Indo-European 4% Chinese 2%
Political lean MEDSL · Harris
- 2024 margin
- Lean D (+5.5) · D 52.0% · R 46.4% · Other 1.6%
- 2008→2024 swing
- +3.9pp toward D · 2008: 1.6pp · 2024: 5.5pp
- All cycles
- 2024: D+5.5 2020: D+13.3 2016: D+12.4 2012: D+0.1 2008: D+1.6
Not yet ingested
- Civics
- —
Market trends
- HPI YoY
- ▼ -219.42%
- Current HPI
- 159.8157
- Rent YoY
- ▼ -0.83%
- Metro
- Houston-The Woodlands-Sugar Land, TX
- State GDP YoY
- ▲ 3.95%
- F500 in state
- 110
Industry mix (Fortune 500 HQ in TX)
| Industry | F500 HQs | Revenue |
|---|---|---|
| Energy | 16 | $1,198B |
|
||
| Technology | 5 | $198B |
|
||
| Engineering / Construction | 4 | $72B |
|
||
| Energy Services | 3 | $60B |
|
||
| Utilities | 3 | $41B |
|
||
| Healthcare | 2 | $330B |
|
||
Price history
+46.6% since first listed12 events — show timeline
- 2026-06-16 Price Changed $424,900 HARMLS
- 2026-05-07 Listed $435,000 HARMLS
- 2026-04-03 Rental Removed $3,000 HARMLS
- 2026-04-03 Listing Removed — HARMLS
- 2026-03-07 Listed $469,000 HARMLS
- 2026-03-05 Listed for Rent $3,000 HARMLS
- 2012-06-08 Listing Removed — HARMLS
- 2012-02-13 Listed $269,000 HARMLS
- 2008-10-25 Listing Removed — HARMLS
- 2008-09-25 Listed $285,900 HARMLS
- 2008-07-24 Listing Removed — HARMLS
- 2008-06-30 Listed $289,900 HARMLS
Property tax history
+6.2%/yrLatest (2025): $9,502 · +4.6% YoY. Source: county tax records.
Cash-flow waterfall
monthlySold comps — $/sqft
last 12 mo · ≤1 miLoading sold comps…