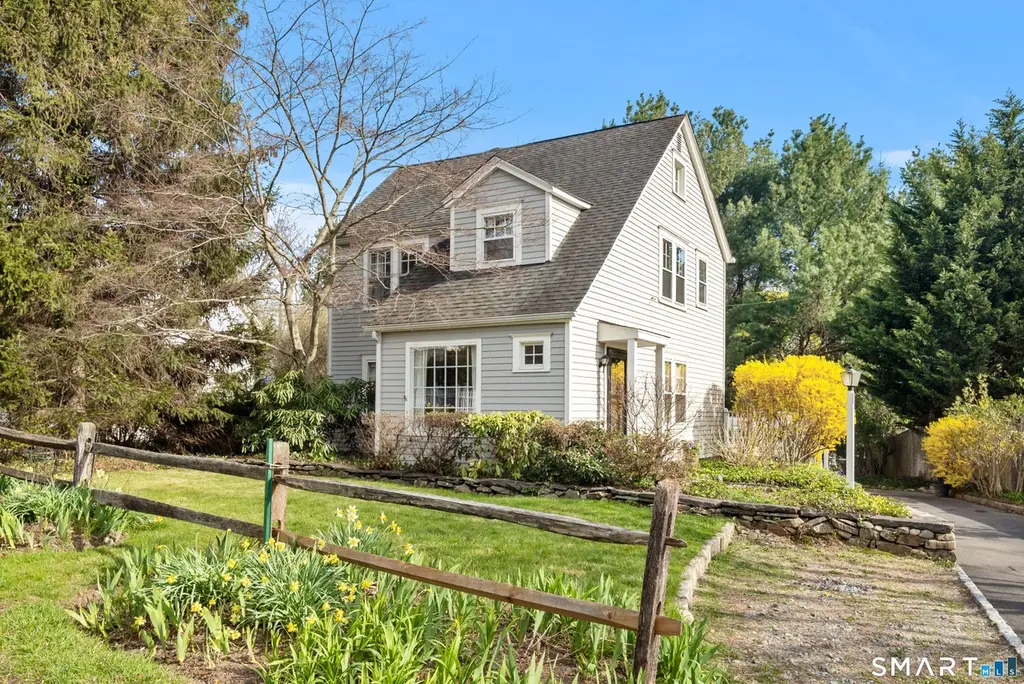
10 Hunt St · Norwalk, CT
Flood risk 1/10 · Minimal
- FEMA flood zone
- X (unshaded)
- Chance of flooding over 30 yrs
- 0.0%
- Est. flood insurance / yr
- $473 – $860
Fire risk 1/10 · Minimal
- Est. fire insurance / yr
- $829 – $1,539
Heat risk 6/10 · Moderate
- Hot days now (above 99°F)
- 7 days/yr
- Hot days in 30 yrs
- 16 days/yr
Wind risk 7/10 · Major
- Chance of severe wind over 30 yrs
- 78.0%
Air-quality risk 8/10 · Major
- Unhealthy air days now
- 13 days/yr
- Unhealthy air days in 30 yrs
- 18 days/yr
Risk factors via First Street. Map © Google.
Why this score? — see what drove the B+ grade
The composite is a weighted blend of 9 inputs, each scored 0–100. Each bar is that input's sub-score; the figure is the points it added to the 100-point composite (weight × sub-score).
- Cash flow +30.0/30.0
- ARV discount +15.0/15.0
- 1% rule +10.0/10.0
- DSCR +10.0/10.0
- Livability +3.9/5.0
- Schools +3.4/10.0
- Rent growth +2.5/5.0
- Condition / age +2.5/5.0
- Appreciation +0.0/10.0
$1,175,000
🖨 Deal sheet 📄 Offer letter ✓ Due diligence
Listing remarks
Charming and full of character, this three-bedroom, two-and-a-half-bath home offers timeless appeal in an unbeatable Rowayton location. Just a short walk to the train and the heart of the village, enjoy easy access to shops, restaurants, and coastal living. Sun-filled interiors feature inviting living spaces and a functional layout for everyday living and entertaining. The living room has a wood-burning fireplace with several built-ins, and the sun-filled kitchen opens to the family room. A private deck is tucked away and provides the perfect setting for morning coffee or evening dinners. Beautiful perennial gardens. A rare opportunity to own a classic home close to everything Rowayton has
Key facts
- Private deck
- Rowayton location
- Perennial gardens
Tags
Neighborhood map
What this means for you Summary
Snapshot
- This is a 3-bed/2.5-bath single-family listed at $1.18M.
Deal economics
- At list price, monthly cash flow is $8k ($95k/yr) — positive.
- The deal already cash-flows at list — no discount required.
- Meets the 1% rule at list price ($20k rent vs $1.18M).
- Cap rate 14.4% vs local median 3.4% in Norwalk — top-decile yield for the area; either an underpriced asset or a hidden risk that comps aren't pricing in. Stress-test before assuming the spread holds.
Location & tenants
- Location reads 77/100 on livability (#41 in CT, #2,966 nationally) — a middle-class / working-renter tenant base. Strengths: employment A+, health & safety A+, crime A; Watch: amenities C-, cost of living F.
- Norwalk School District (urban): math 29% / reading 44% proficiency, ranked #104 of 153 in CT (top 68%) — families likely to look elsewhere, expect single-tenant / working-renter base with shorter leases.
- Zoned schools: Rowayton School (math 60% / reading 64%, grade B, #137 of 553 statewide, top 28%, 468 students, 33% FRL); Brien Mcmahon High School (math 30% / reading 58%, grade F, #97 of 194 statewide, top 50%, 1,711 students, 49% FRL) — zoned schools at 41% FRL track the district average.
- Zoned-school proficiency averages 53% at this address vs 36% district-wide (+16 pts) — the actual schools serving this property are materially stronger than the Norwalk School District average implies; a family-tenant draw the district grade alone would hide.
- Market conditions: 25 active listings in the ZIP; 10 comparable units currently listed for rent nearby; rentals lingering (median 44d on market — plan ~5-8 weeks vacancy on turnover, expect pricing pressure); 50% of comp listings sitting > 30 days — soft ceiling on asking rent; 1,151 units permitted in Western Connecticut Planning Region in 2024 (714 in 5+ unit buildings).
Forward outlook
- Local home prices are declining (-3.0%/yr); year-one equity from $8k of loan paydown is wiped out by about $35k of value loss. Plan a longer hold.
- At projected returns (-3.0% appreciation + 3.0% rent growth), your $329k cash investment doubles in ~5 years — after that, you're playing with house money.
Negotiation context
- Only 12 days on market — expect competitive offers; lowballing is unlikely to land.
Risks & watch-outs
- Watch-outs: built in 1927 — expect roof / HVAC / electrical / plumbing capex.
- Climate carrying-cost: major wind risk, 78% chance of damaging wind over 30y; extreme-heat days projected 7→16/yr by 2055 (HVAC capex compounding) — expect insurance premiums to compound above CPI over the hold.
Questions for the listing agent
- Built in 1927 — when were the roof, HVAC, electrical panel, plumbing, and water heater last replaced?
- Is there a deadline driving the sale (1031 exchange, divorce, estate, relocation)? That informs how much negotiation room exists.
- What's the average days-on-market for RENTAL listings here right now (not sales)? A rising rental-DOM trend means longer vacancies and softer asking-rent achievability than the comps imply.
- What's the recent tenant-quality profile in this submarket — average credit score on applications, eviction rate, late-payment / NSF rate, and stable-employment percentage? A property-management company in the area should have these aggregated.
- How much new for-sale + rental construction is in the pipeline within 1–3 miles? Heavy new supply typically softens prices + rents 12–24 months out; constrained supply supports both.
Investment metrics
- 1% rule
- 1.69% ✓
- Cap rate
- 14.39%
- Cash-on-cash
- 28.92%
- DSCR
- 2.29
- GRM
- 4.9
CMA / ARV
- ARV (on-the-fly)
- $1,607,170
- Comps found
- 12
Show comp detail 12 sales within ~0.75 mi
| Address | Dist | Beds/Ba | Sqft | Sold | Price | $/sf | Match |
|---|---|---|---|---|---|---|---|
| 10 Hunt St | 0.00mi | 3/2.5 | 1,858 (0%) | 0mo | $1,608,000 | $865 | 100 |
| 7 Thomes St | 0.16mi | 3/2.5 | 1,940 (+4%) | 1mo | $2,000,000 | $1,031 | 84 |
| 25 Arnold Ln | 0.31mi | 3/2.0 | 1,754 (-6%) | 2mo | $875,000 | $499 | 72 |
| 2 Steeple Top Rd | 0.15mi | 3/2.5 | 1,698 (-9%) | 11mo | $920,000 | $542 | 69 |
| 209 Rowayton Ave | 0.22mi | 4/2.5 (+1) | 2,068 (+11%) | 4mo | $2,640,000 | $1,277 | 62 |
| 36 Hunt St | 0.12mi | 3/2.0 | 2,100 (+13%) | 10mo | $1,195,000 | $569 | 62 |
| 16 Possum Ln | 0.59mi | 3/1.5 | 1,736 (-7%) | 1mo | $776,000 | $447 | 57 |
| 17 Burchard Ln | 0.73mi | 3/2.5 | 1,818 (-2%) | 8mo | $1,617,000 | $889 | 55 |
| 25 McKinley St | 0.71mi | 2/2.0 (-1) | 1,804 (-3%) | 6mo | $1,390,000 | $771 | 50 |
| 1 McKinley St | 0.61mi | 2/3.0 (-1) | 2,044 (+10%) | 0mo | $2,988,000 | $1,462 | 48 |
| 3 Pond St | 0.67mi | 3/2.5 | 2,083 (+12%) | 8mo | $2,250,000 | $1,080 | 42 |
| 199 Highland Ave | 0.62mi | 2/2.0 (-1) | 2,037 (+10%) | 12mo | $1,600,000 | $785 | 38 |
Match score weights: distance 35% · size 25% · config 20% · recency 20%. Top-matched comps best support the ARV.
Projected returns pro-forma
-3.0% appreciation · 3.0% rent growth · sell at horizon
- IRR
- 23.3%
- Equity multiple
- 1.96×
- Total profit
- $314,740
- Equity at exit
- $175,196
- IRR
- 31.2%
- Equity multiple
- 3.81×
- Total profit
- $924,770
- Equity at exit
- $101,593
Cash invested: $329,000 (down + closing). Projections, not guarantees.
Landlord ↔ Tenant lean methodology
- Overall (STATE)
- 27 Tenant-Leaning
- State Connecticut
- 27 Tenant-Leaning · D+7
- County
- — inherits STATE
- City
- — inherits STATE
ZIP-level market 06853
- Home prices YoY
- -26.8%
- Active inventory
- 25
- Price-to-rent
- 4.9×
Monthly cashflow live
- Estimated rent
- $19,885 high interval (Pro) →
- Mortgage (P&I)
- −$6,162
- Tax from tax record
- −$1,128 /mo · $13,537/yr
- Insurance
- −$490
- HOA
- −$0
- Vacancy / Maint / Mgmt
- −$4,176
- Net cashflow
- $7,930
Break-even live
UW: 25.0% down · 7.5% · 30yr · 1.5% tax · 5.0% vac · 8.0% maint · 8.0% mgmt
Financing live
Cash to close
- Down payment
- $293,750
- Closing costs
- $35,250
- Reserves months
- —
- Total cash needed
- —
Loan-product check · same deal, 3 products live
Conventional
25% down · 7.5% · 30yr
- Down + closing
- —
- Monthly P&I
- —
- Monthly cashflow
- —
- DSCR
- —
- Eligible?
- —
Personal DTI + credit; lowest rate.
DSCR
20% down · 8.5% · 30yr
- Down + closing
- —
- Monthly P&I
- —
- Monthly cashflow
- —
- DSCR
- —
- Eligible?
- —
No personal income docs; deal must DSCR.
Hard money
10% down · 12.0% · 12mo
- Down + closing
- —
- Monthly P&I
- —
- Monthly cashflow
- —
- DSCR
- —
- Eligible?
- —
Short-term bridge; refi at stabilization.
Rent comps 10 comps
| Address | Beds | Baths | Sqft | Rent | $/sqft | DOM | Units | Dist |
|---|---|---|---|---|---|---|---|---|
| 233 Rowayton Ave Norwalk, CT | 3.0 | 2.5 | 2579 | $26,000 | $10.08 | 2d | 1 | 0.12mi |
| 168 Rowayton Ave Unit A Norwalk, CT | 3.0 | 3.0 | 1400 | $8,750 | $6.25 | 2d | 1 | 0.36mi |
| 111 Rowayton Ave #201 Norwalk, CT | 3.0 | 3.0 | 2399 | $30,000 | $12.51 | 2d | 1 | 0.60mi |
| 8 Woodchuck Ln Norwalk, CT | 2.0 | 2.0 | 1500 | $4,200 | $2.80 | 14d | 1 | 0.98mi |
| 104 Roton Ave Norwalk, CT | 3.0 | 4.0 | 2449 | $28,000 | $11.43 | 43d | 1 | 1.00mi |
| 1 Cottontail Rd Norwalk, CT | 4.0 | 3.0 | 1458 | $6,500 | $4.46 | 2d | 1 | 1.00mi |
| 31 Ensign Rd Norwalk, CT | 4.0 | 2.5 | 1952 | $9,999 | $5.12 | 43d | 1 | 1.19mi |
| 567 Post Rd Unit 1st Floor Darien, CT | 2.0 | 1.0 | 2032 | $3,200 | $1.57 | 43d | 1 | 1.20mi |
| 6 Edgewood St Unit A Norwalk, CT | 3.0 | 2.5 | 1900 | $4,950 | $2.61 | 43d | 1 | 1.23mi |
| 12 Splitrock Rd Norwalk, CT | 3.0 | 3.0 | 1658 | $16,000 | $9.65 | 43d | 1 | 1.49mi |
Listing history 2 events
-
2026-04-27status Under Contract
-
2026-04-15$1,175,000 Active
ⓘ Source: listings_history table (triggers on properties + properties_extension) + one-shot
backfill from property_details.listing_events for pre-trigger history.
Tax reassessment forecast CT · Partial reset (capped growth)
- Current annual tax
- $13,537 · $1,128/mo
- Projected year-2 tax
- $19,341 · $1,612/mo
- Expected delta
- +$5,804/yr (+$484/mo · 42.9%)
ⓘ Screening estimate from a state-policy table — verify with the county assessor before closing.
Climate risk First Street
- Flood 1/10 Low FEMA zone X (unshaded) · 0% chance over 30 yrs
- Wildfire 1/10 Low
- Heat 6/10 Major 7 d/yr ≥99°F today · 16 d/yr by 30 yrs out
- Wind 7/10 Severe 78% chance of damaging wind over 30 yrs
- Air quality 8/10 Severe 13 unhealthy d/yr today · 18 by 30 yrs out
Nearby sold comps map
Loading sold comps map…
Walkable amenities ~0.75 mi
Loading nearby amenities…
Taxation est. · year 1
- Rental income
- $238,621
- − Mortgage interest
- −$65,818
- − Property taxes
- −$13,537
- − Insurance
- −$5,875
- − Repairs & maintenance
- −$19,090
- − Management
- −$19,090
- − Depreciation
- −$34,182
- Taxable income
- $81,030
- Est. tax owed @ 24.0%
- −$19,447
- After-tax cash flow
- $75,710/yr
For passive investors: Depreciation is non-cash, so a rental often shows a tax loss while cash-flowing — sheltering income. Rental losses are passive: they offset passive income freely, and up to $25,000/yr can offset ordinary (W-2) income if you actively participate and your MAGI is under $100k (phasing out to $0 by $150k); unused losses carry forward. On sale, claimed depreciation is recaptured at up to 25%, and gains may owe capital-gains tax (a 1031 exchange can defer both). Figures are a year-1 estimate at your 24.0% rate — not tax advice; consult a CPA.
Schools (NCES district)
- District
- Norwalk School District
- NCES district ID
- 0903090
- Math proficiency
- 29% ▼ -11.00%
- Reading proficiency
- 44% ▼ -6.00%
- Median HH income
- $76,540
- Composite
- 34.07/100
- National rank
- #5297
- State rank
- #104 of 153 in CT
Livability — Norwalk
- Score
- 77/100
- State rank
- #41
- US rank
- #2966
Category grades
Schools grade is shown separately in the Schools card above.
Census & demographics
- Census place
- Norwalk, CT
- City population
- 89,026
- Population (ZIP)
- 3,229
Population outlook (Western Connecticut County) Hauer SSP2
- By 2040
- 685,031
Race, ethnicity, and origin ACS 2023
- Neighborhood character
- Predominantly White (90%)
- Race & ethnicity
- White 90% Two or more races 6% Hispanic / Latino 2% Asian 2% Black 2%
- Common ancestry
- Lithuanian 5% Romanian 4% Italian 3%
- Foreign-born
- 6% · Canada, China
- Languages at home
- 93% English-only · German/W. Germanic 3% Spanish 3% Russian/Polish/Slavic 1%
Political lean MEDSL · Western Connecticut
- 2024 margin
- D (+19.1) · D 58.8% · R 39.7% · Other 1.6%
- All cycles
- 2024: D+19.1
Not yet ingested
- Civics
- —
Market trends
- HPI YoY
- ▼ -77.55%
- Current HPI
- 212.295
- Rent YoY
- —
- Metro
- —
- State GDP YoY
- ▲ 1.06%
- F500 in state
- 38
Industry mix (Fortune 500 HQ in CT)
| Industry | F500 HQs | Revenue |
|---|---|---|
| Industrial Machinery | 4 | $38B |
|
||
| Insurance | 3 | $71B |
|
||
| Financial Services | 2 | $25B |
|
||
| Transportation / Logistics | 2 | $18B |
|
||
| Healthcare | 1 | $247B |
|
||
| Telecommunications | 1 | $55B |
|
||
Price history
2 events — show timeline
- 2026-04-27 Pending — Smart MLS
- 2026-04-15 Listed $1,175,000 Smart MLS
Property tax history
+1.2%/yrLatest (2023): $13,537 · +4.3% YoY. Source: county tax records.
Cash-flow waterfall
monthlySold comps — $/sqft
last 12 mo · ≤1 miLoading sold comps…