4570 S US Hwy 287 · Crockett, TX
Flood risk No data
- FEMA flood zone
- —
- Chance of flooding over 30 yrs
- —
- Est. flood insurance / yr
- —
Fire risk No data
- Est. fire insurance / yr
- —
Heat risk No data
- Hot days now (above threshold)
- —
- Hot days in 30 yrs
- —
Wind risk No data
- Chance of severe wind over 30 yrs
- —
Air-quality risk No data
- Unhealthy air days now
- —
- Unhealthy air days in 30 yrs
- —
Risk factors via First Street. Map © Google.
Why this score? — see what drove the C+ grade
The composite is a weighted blend of 9 inputs, each scored 0–100. Each bar is that input's sub-score; the figure is the points it added to the 100-point composite (weight × sub-score).
- Cash flow +26.7/30.0
- DSCR +9.1/10.0
- ARV discount +7.5/15.0
- 1% rule +7.2/10.0
- Livability +3.1/5.0
- Rent growth +2.5/5.0
- Schools +2.0/10.0
- Condition / age +2.0/5.0
- Appreciation +0.0/10.0
$98,000
🖨 Deal sheet 📄 Offer letter ✓ Due diligence
Listing remarks
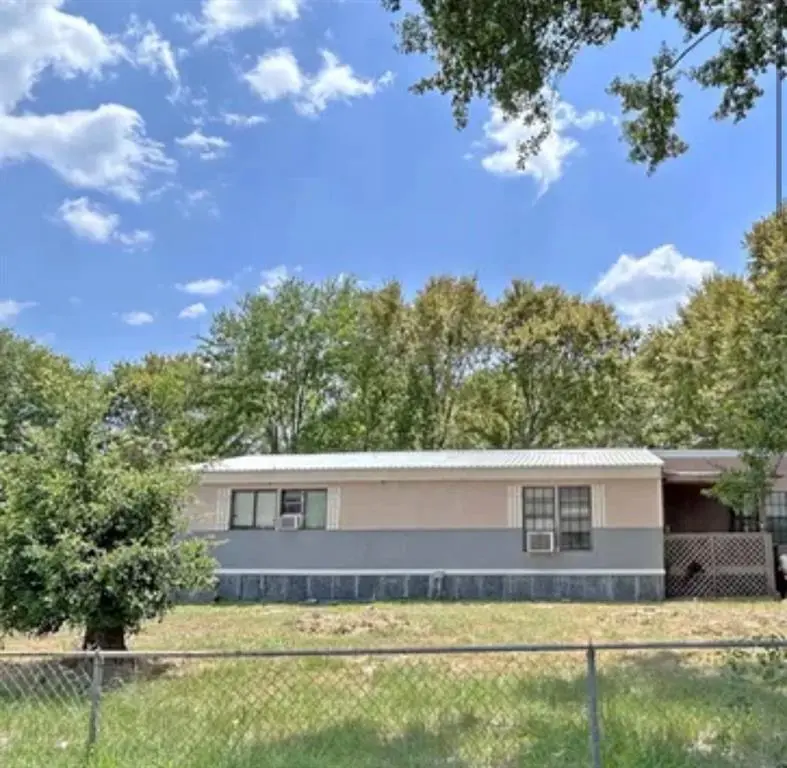
Welcome to 4570 S US Hwy 287 in Crockett, Texas. This property offers peaceful country living with convenient highway access, making it a great option for buyers looking for space, privacy, and functionality. Situated on approximately 2 acres, the property features a 2-bedroom, 2-bath manufactured home with a covered front porch, fenced yard, circle drive, and portable outbuilding. Co-op water, co-op sewer, gravel dirt access, chain-link and barbed-wire fencing, and no HOA. Enjoy the flexibility of acreage while still being just a short drive from town. Whether you are looking for a primary residence, weekend retreat, rental opportunity, or a property with room for animals, gardening, outdo
Key facts
- Covered front porch
- Fenced yard
- Co-op water
Tags
Property features AI
Finance
- Other: Horse permitted on the property; No restrictions; Seller excludes farm equipment in yard
- Financial info: Listing terms include Cash, Conventional, Owner will carry, Contact agent
- HOA & community: No association
Exterior
- Parking: Driveway and off-street parking; Additional parking available; No garage or carport
- Security: Fire alarm; Smoke detectors
- Utilities: Electricity connected; Septic system; Property is outside city limits
- Home design: Residential mobile home; Attached; One story; Other roof type
- Construction: Built in 1982
- Exterior features: 2-acre lot; Back yard with chain link fencing; Covered patio/porch areas including front porch, rear porch, and deck
Interior
- Kitchen: Dishwasher; Electric cooktop; Electric oven; Built-in cabinets
- Bedrooms: 2 bedrooms (both on the main level); Primary bedroom includes an ensuite bathroom
- Flooring: Laminate flooring; Vinyl flooring
- Bathrooms: 2 full bathrooms
- Heating & cooling: Propane heating; ENERGY STAR qualified equipment; Window air conditioning units
- Interior features: Built-in cabinets in living room and kitchen; Built-in features; Cable TV available; One living area; One dining area; 6 total rooms; One-level layout
- Laundry & utility: Washer hookup; Electric dryer hookup
Neighborhood map
What this means for you Summary
Snapshot
- This is a 2-bed/2.0-bath manufactured listed at $98k. Condition is rated fair.
Deal economics
- At list price, monthly cash flow is $264 ($3k/yr) — positive.
- The deal already cash-flows at list — no discount required.
- Meets the 1% rule at list price ($1k rent vs $98k).
- Recommended offer: $95k (3.0% below list) — sets the bar for market timing.
- Cap rate 9.5% vs local median 3.2% in Crockett — top-decile yield for the area; either an underpriced asset or a hidden risk that comps aren't pricing in. Stress-test before assuming the spread holds.
Location & tenants
- Location reads 61/100 on livability (#1,005 in TX) — a middle-class / working-renter tenant base. Strengths: cost of living A+, housing A, crime B+; Watch: amenities F, commute F, employment F.
- Crockett ISD (town): math 22% / reading 28% proficiency, ranked #736 of 826 in TX (top 89%) — low school quality limits family demand, transient renter base, plan for 1-2y turnover; 78% free/reduced lunch — lower-income household profile, screen leases tightly.
- Zoned schools: Crockett El (math 18% / reading 21%, grade F, #3,583 of 4,322 statewide, top 86%, 399 students, 92% FRL).
- Market conditions: 277 active listings in the ZIP; 3 units permitted in Houston County in 2024 (0 in 5+ unit buildings).
Forward outlook
- Local home prices are declining (-3.0%/yr); year-one equity from $678 of loan paydown is wiped out by about $3k of value loss. Plan a longer hold.
- Houston County population projected at -16% by 2050 — secular population decline; favor cash flow + early exit over multi-decade hold.
- At projected returns (-3.0% appreciation + 3.0% rent growth), your $27k cash investment doubles in ~10 years — after that, you're playing with house money.
Negotiation context
- It's been on market 38 days — a 3% lower offer ($95k) is reasonable based on typical stale-listing flexibility.
Questions for the listing agent
- It's been on market 38 days. Have you received any prior offers? Is the seller open to a 3% concession, seller financing, or rate buy-down credit?
- Have any recent inspections been done? Can we get a copy of the seller's disclosures and any deferred-maintenance estimates?
- Is there a deadline driving the sale (1031 exchange, divorce, estate, relocation)? That informs how much negotiation room exists.
- Schools are F-rated, which usually means shorter tenancies and higher turnover. Who's the typical renter profile here, and what's been the actual vacancy rate?
- What's the average days-on-market for RENTAL listings here right now (not sales)? A rising rental-DOM trend means longer vacancies and softer asking-rent achievability than the comps imply.
- What's the recent tenant-quality profile in this submarket — average credit score on applications, eviction rate, late-payment / NSF rate, and stable-employment percentage? A property-management company in the area should have these aggregated.
- How much new for-sale + rental construction is in the pipeline within 1–3 miles? Heavy new supply typically softens prices + rents 12–24 months out; constrained supply supports both.
Investment metrics
- 1% rule
- 1.22% ✓
- Cap rate
- 9.53%
- Cash-on-cash
- 11.56%
- DSCR
- 1.51
- GRM
- 6.9
CMA / ARV
No comps found within radius.
Projected returns pro-forma
-3.0% appreciation · 3.0% rent growth · sell at horizon
- IRR
- 0.9%
- Equity multiple
- 1.04×
- Total profit
- $972
- Equity at exit
- $14,612
- IRR
- 10.6%
- Equity multiple
- 1.82×
- Total profit
- $22,595
- Equity at exit
- $8,473
Cash invested: $27,440 (down + closing). Projections, not guarantees.
Landlord ↔ Tenant lean methodology
- Overall (STATE)
- 87 Strongly Landlord-Friendly
- State Texas
- 87 Strongly Landlord-Friendly · R+5
- County
- — inherits STATE
- City
- — inherits STATE
ZIP-level market 75835
- Home prices YoY
- -15.8%
- Active inventory
- 277
- Price-to-rent
- 6.9×
Monthly cashflow live
- Estimated rent
- $1,192 medium interval (Pro) →
- Mortgage (P&I)
- −$514
- Tax est. 1.5%
- −$122 /mo · $1,470/yr
- Insurance
- −$41
- HOA
- −$0
- Vacancy / Maint / Mgmt
- −$250
- Net cashflow
- $264
Break-even live
UW: 25.0% down · 7.5% · 30yr · 1.5% tax · 5.0% vac · 8.0% maint · 8.0% mgmt
Financing live
Cash to close
- Down payment
- $24,500
- Closing costs
- $2,940
- Reserves months
- —
- Total cash needed
- —
Loan-product check · same deal, 3 products live
Conventional
25% down · 7.5% · 30yr
- Down + closing
- —
- Monthly P&I
- —
- Monthly cashflow
- —
- DSCR
- —
- Eligible?
- —
Personal DTI + credit; lowest rate.
DSCR
20% down · 8.5% · 30yr
- Down + closing
- —
- Monthly P&I
- —
- Monthly cashflow
- —
- DSCR
- —
- Eligible?
- —
No personal income docs; deal must DSCR.
Hard money
10% down · 12.0% · 12mo
- Down + closing
- —
- Monthly P&I
- —
- Monthly cashflow
- —
- DSCR
- —
- Eligible?
- —
Short-term bridge; refi at stabilization.
Listing history 15 events
-
2026-06-18days on market $98,000 Active 38 DOM
-
2026-06-17days on market $98,000 Active 37 DOM
-
2026-06-16days on market $98,000 Active 36 DOM
-
2026-06-15pricedays on market $98,000 Active 35 DOM
-
2026-06-13days on market $120,000 Active 33 DOM
-
2026-06-12days on market $120,000 Active 32 DOM
-
2026-06-09days on market $120,000 Active 29 DOM
-
2026-06-08days on market $120,000 Active 28 DOM
-
2026-06-08days on market $120,000 Active 27 DOM
-
2026-06-07days on market $120,000 Active 26 DOM
-
2026-06-03days on market $120,000 Active 23 DOM
-
2026-06-02days on market $120,000 Active 22 DOM
-
2026-06-01days on market $120,000 Active 21 DOM
-
2026-05-31days on market $120,000 Active 20 DOM
-
2026-05-09$120,000 Active
ⓘ Source: listings_history table (triggers on properties + properties_extension) + one-shot
backfill from property_details.listing_events for pre-trigger history.
Nearby sold comps map
Loading sold comps map…
Walkable amenities ~0.75 mi
Loading nearby amenities…
Taxation est. · year 1
- Rental income
- $14,302
- − Mortgage interest
- −$5,490
- − Property taxes
- −$1,470
- − Insurance
- −$490
- − Repairs & maintenance
- −$1,144
- − Management
- −$1,144
- − Depreciation
- −$2,851
- Taxable income
- $1,713
- Est. tax owed @ 24.0%
- −$411
- After-tax cash flow
- $2,760/yr
For passive investors: Depreciation is non-cash, so a rental often shows a tax loss while cash-flowing — sheltering income. Rental losses are passive: they offset passive income freely, and up to $25,000/yr can offset ordinary (W-2) income if you actively participate and your MAGI is under $100k (phasing out to $0 by $150k); unused losses carry forward. On sale, claimed depreciation is recaptured at up to 25%, and gains may owe capital-gains tax (a 1031 exchange can defer both). Figures are a year-1 estimate at your 24.0% rate — not tax advice; consult a CPA.
Condition & rehab AI · 4 photos
This manufactured home requires moderate renovations, including new siding, carpet, and paint, to significantly improve its condition and value.
Repairs flagged
- Major exterior siding — Significant wear and tear
- Major interior carpet — Severe wear and tear
- Major interior paint — Worn and faded
Value-add opportunities
- Both New exterior siding — Enhances curb appeal and property value
- Both New interior carpet — Improves comfort and aesthetics
- Both New interior paint — Refreshes the interior and enhances property value
Renovation cost estimate screening
| Repair item | Severity | Est. cost |
|---|---|---|
| exterior siding · Significant wear and tear | Major | $15,000–50,000 |
| interior carpet · Severe wear and tear | Major | $15,000–50,000 |
| interior paint · Worn and faded | Major | $15,000–50,000 |
| Total estimated repair cost · 3 items | $45,000–150,000 |
Value-add ROI direction
- Both New exterior siding — Enhances curb appeal and property value ↑
- Both New interior carpet — Improves comfort and aesthetics ↑
- Both New interior paint — Refreshes the interior and enhances property value ↑
ⓘ Cost ranges are severity-bucket heuristics (US national rule-of-thumb). Get contractor quotes + a written scope before underwriting a rehab budget.
Schools (NCES district)
- District
- Crockett ISD
- NCES district ID
- 4815720
- Math proficiency
- 22% ▬ 0.00%
- Reading proficiency
- 28% ▲ 1.00%
- Median HH income
- $26,917
- Composite
- 19.83/100
- National rank
- #8699
- State rank
- #736 of 826 in TX
Livability — Crockett
- Score
- 61/100
- State rank
- #1005
- US rank
- #17855
Category grades
Schools grade is shown separately in the Schools card above.
Census & demographics
- Population (ZIP)
- 11,805
Population outlook (Houston County) Hauer SSP2
- Today (2025)
- 21,269 people
- By 2030
- 20,568 · -3.3%
- By 2040
- 19,255 · -9.5%
- By 2050
- 17,980 · -15.5%
- By 2075
- 15,214 · -28.5%
- By 2100
- 11,720 · -44.9%
Race, ethnicity, and origin ACS 2023
- Neighborhood character
- Diverse neighborhood (Simpson 0.61)
- Race & ethnicity
- White 55% Black 25% Hispanic / Latino 17% Two or more races 9%
- Hispanic origin (detail)
- Mexican 15%
- Common ancestry
- Lithuanian 3% Romanian 1% Slovak 1%
- Foreign-born
- 4% · Canada
- Languages at home
- 89% English-only · Spanish 10%
Political lean MEDSL · Houston
- 2024 margin
- Solid R (+55.4) · D 22.1% · R 77.4%
- 2008→2024 swing
- -18.1pp toward R · 2008: -37.3pp · 2024: -55.4pp
- All cycles
- 2024: R+55.4 2020: R+50.3 2016: R+50.9 2012: R+44.3 2008: R+37.3
Not yet ingested
- Civics
- —
Market trends
- HPI YoY
- ▼ -28.03%
- Current HPI
- 149.4937
- Rent YoY
- —
- Metro
- —
- State GDP YoY
- ▲ 3.95%
- F500 in state
- 110
Industry mix (Fortune 500 HQ in TX)
| Industry | F500 HQs | Revenue |
|---|---|---|
| Energy | 16 | $1,198B |
|
||
| Technology | 5 | $198B |
|
||
| Engineering / Construction | 4 | $72B |
|
||
| Energy Services | 3 | $60B |
|
||
| Utilities | 3 | $41B |
|
||
| Healthcare | 2 | $330B |
|
||
Price history
1 event — show timeline
- 2026-05-09 Listed $120,000 NTREIS
Cash-flow waterfall
monthlySold comps — $/sqft
last 12 mo · ≤1 miLoading sold comps…