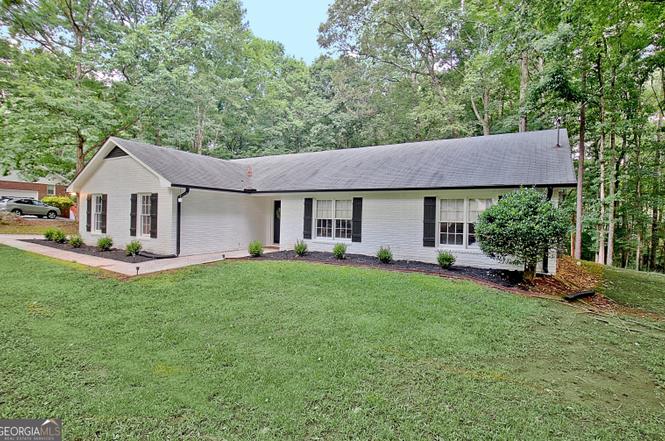
140 Wendell Ct · Fayetteville, GA
Flood risk 1/10 · Minimal
- FEMA flood zone
- X (unshaded)
- Chance of flooding over 30 yrs
- 0.0%
- Est. flood insurance / yr
- $507 – $1,088
Fire risk 3/10 · Minor
- Est. fire insurance / yr
- $963 – $1,789
Heat risk 5/10 · Moderate
- Hot days now (above 106°F)
- 6 days/yr
- Hot days in 30 yrs
- 15 days/yr
Wind risk 6/10 · Moderate
- Chance of severe wind over 30 yrs
- 27.0%
Air-quality risk 4/10 · Minor
- Unhealthy air days now
- 3 days/yr
- Unhealthy air days in 30 yrs
- 5 days/yr
Risk factors via First Street. Map © Google.
Why this score? — see what drove the D- grade
The composite is a weighted blend of 9 inputs, each scored 0–100. Each bar is that input's sub-score; the figure is the points it added to the 100-point composite (weight × sub-score).
- Cash flow +12.0/30.0
- Schools +5.1/10.0
- ARV discount +4.4/15.0
- DSCR +3.6/10.0
- Livability +3.6/5.0
- Rent growth +3.3/5.0
- 1% rule +2.5/10.0
- Condition / age +2.5/5.0
- Appreciation +0.0/10.0
$349,900
🖨 Deal sheet 📄 Offer letter ✓ Due diligence
Listing remarks MLS
WONDERFUL RANCH WITH 3 LARGE BEDROOMS, VAULTED GREAT ROOM, FORMAL DINING ROOM, LARGE KITCHEN WITH BREAKFAST ROOM OR KEEPING ROOM ACRE PLUS LOT - BRING ALL OFFERS
Key facts
- Wooded lot
- 1.3 acre lot
- Garage
Tags
Property features AI
Finance
- Other: Listing accepts Cash, Conventional, FHA, USDA Loan, and VA Loan
- HOA & community: No homeowners association
Exterior
- Parking: Attached garage with space for 2 vehicles
- Utilities: Public water; Septic tank; Electricity available; Natural gas available; High-speed internet available
- Home design: Single-family residence (house); One level; Resale property
- Construction: Brick construction; Composition roof; Slab foundation; Built in 1985
- Exterior features: Patio; Private lot; Partially wooded; Creek on the property
Interior
- Kitchen: Dishwasher; Stainless steel appliances; Breakfast bar
- Bedrooms: 3 bedrooms on the main level
- Flooring: Laminate flooring
- Bathrooms: 2 full bathrooms (main level)
- Heating & cooling: Central heating; Central air conditioning
- Interior features: Beamed ceilings; Walk-in closet(s); Factory-built fireplace (1)
- Laundry & utility: Laundry in hall
Neighborhood map
What this means for you Summary
Snapshot
- This is a 3-bed/2.0-bath single-family listed at $350k.
Deal economics
- At list price, monthly cash flow is $-80 ($-964/yr) — negative.
- To cash-flow at today's rent, offer at most $336k (4.1% below list).
- To meet the 1% rule (rent ≥ 1% of price), the offer needs to be $264k (24.6% below list).
- Recommended offer: $264k (24.6% below list) — sets the bar for 1% rule.
- Cap rate 6.0% vs local median 4.4% in Fayetteville — top-decile yield for the area; either an underpriced asset or a hidden risk that comps aren't pricing in. Stress-test before assuming the spread holds.
Location & tenants
- Location reads 71/100 on livability (#86 in GA) — a middle-class / working-renter tenant base. Strengths: housing A+, health & safety B+, employment B; Watch: amenities F, commute F.
- Fayette County (suburban): math 52% / reading 60% proficiency, ranked #7 of 174 in GA (top 4%) — acceptable for families but not a draw, mixed tenant base, ~2y average lease.
- Zoned schools: Inman Elementary (math 56% / reading 56%, grade C+, #165 of 1,228 statewide, top 14%, 663 students, 32% FRL); Whitewater Middle School (math 55% / reading 65%, grade B, #41 of 470 statewide, top 9%, 864 students, 20% FRL); Whitewater High School (math 32% / reading 62%, grade D-, #37 of 424 statewide, top 9%, 1,387 students, 18% FRL) — zoned schools at 23% FRL track the district average.
- Market conditions: Rents rising (+3.2%/yr); 306 active listings in the ZIP; 6 comparable units currently listed for rent nearby; rentals at typical pace (median 25d on market — plan ~3-4 weeks tenant-placement turnaround); high-income renter base; 323 units permitted in Fayette County in 2024 (0 in 5+ unit buildings).
Forward outlook
- Local home prices are declining (-3.0%/yr); year-one equity from $2k of loan paydown is wiped out by about $10k of value loss. Plan a longer hold.
- Fayette County population projected at +13% by 2050 — modest demand growth; plan on rents tracking national, not racing it.
Negotiation context
- Only 14 days on market — expect competitive offers; lowballing is unlikely to land.
- 3 sale attempts since 15y ago with the ask held roughly flat each time — persistent listings suggest the price (not the market) is what's stuck; bring a comps-based counter.
- Current owner paid $93k; list at $350k implies a 275% gain — meaningful room to come down on a strong offer.
Risks & watch-outs
- Climate carrying-cost: major wind risk, 27% chance of damaging wind over 30y; extreme-heat days projected 6→15/yr by 2055 (HVAC capex compounding) — expect insurance premiums to compound above CPI over the hold.
Questions for the listing agent
- What do current leases actually rent for vs. the listed asking? Can we see a recent rent roll and the last 12 months of T-12 income?
- Is there a deadline driving the sale (1031 exchange, divorce, estate, relocation)? That informs how much negotiation room exists.
- Schools are B-rated — typically a magnet for longer-tenancy family renters. What's the average tenant stay here, and is there a school-zone premium baked into asking?
- The area grade is low — what's the realistic commute time and amenity access for the typical tenant pool here? Any planned neighborhood developments (good or bad) we should know about?
- What's the average days-on-market for RENTAL listings here right now (not sales)? A rising rental-DOM trend means longer vacancies and softer asking-rent achievability than the comps imply.
- What's the recent tenant-quality profile in this submarket — average credit score on applications, eviction rate, late-payment / NSF rate, and stable-employment percentage? A property-management company in the area should have these aggregated.
- How much new for-sale + rental construction is in the pipeline within 1–3 miles? Heavy new supply typically softens prices + rents 12–24 months out; constrained supply supports both.
Investment metrics
- 1% rule
- 0.75% ✗
- Cap rate
- 6.02%
- Cash-on-cash
- -0.98%
- DSCR
- 0.96
- GRM
- 11.1
CMA / ARV
- ARV (on-the-fly)
- $327,405
- Comps found
- 6
Show comp detail 6 sales within ~0.75 mi
| Address | Dist | Beds/Ba | Sqft | Sold | Price | $/sf | Match |
|---|---|---|---|---|---|---|---|
| 125 Wendell Ct | 0.08mi | 3/2.0 | 1,681 (+0%) | 12mo | $360,000 | $214 | 86 |
| 100 Field Green Ct | 0.14mi | 3/2.0 | 1,593 (-5%) | 2mo | $310,000 | $195 | 84 |
| 122 Hilo Rd | 0.30mi | 3/2.0 | 1,578 (-6%) | 12mo | $315,000 | $200 | 66 |
| 140 Wyonia Way | 0.33mi | 3/2.0 | 1,794 (+7%) | 13mo | $299,900 | $167 | 62 |
| 115 Forest Lake Ct | 0.67mi | 3/2.0 | 1,723 (+3%) | 16mo | $330,000 | $192 | 51 |
| 110 Heatherwood Dr | 0.45mi | 3/2.0 | 1,916 (+14%) | 8mo | $369,000 | $193 | 49 |
Match score weights: distance 35% · size 25% · config 20% · recency 20%. Top-matched comps best support the ARV.
Projected returns pro-forma
-3.0% appreciation · 3.22% rent growth · sell at horizon
- IRR
- -17.7%
- Equity multiple
- 0.37×
- Total profit
- $-61,345
- Equity at exit
- $52,171
- IRR
- -9.6%
- Equity multiple
- 0.41×
- Total profit
- $-58,067
- Equity at exit
- $30,253
Cash invested: $97,972 (down + closing). Projections, not guarantees.
Landlord ↔ Tenant lean methodology
- Overall (STATE)
- 90 Strongly Landlord-Friendly
- State Georgia
- 90 Strongly Landlord-Friendly · R+3
- County
- — inherits STATE
- City
- — inherits STATE
ZIP-level market 30215
- Rents YoY
- 3.2%
- Active inventory
- 306
- Price-to-rent
- 11.1×
Monthly cashflow live
- Estimated rent
- $2,637 high interval (Pro) →
- Mortgage (P&I)
- −$1,835
- Tax from tax record
- −$183 /mo · $2,194/yr
- Insurance
- −$146
- HOA
- −$0
- Vacancy / Maint / Mgmt
- −$554
- Net cashflow
- $-80
Break-even live
UW: 25.0% down · 7.5% · 30yr · 1.5% tax · 5.0% vac · 8.0% maint · 8.0% mgmt
Financing live
Cash to close
- Down payment
- $87,475
- Closing costs
- $10,497
- Reserves months
- —
- Total cash needed
- —
Loan-product check · same deal, 3 products live
Conventional
25% down · 7.5% · 30yr
- Down + closing
- —
- Monthly P&I
- —
- Monthly cashflow
- —
- DSCR
- —
- Eligible?
- —
Personal DTI + credit; lowest rate.
DSCR
20% down · 8.5% · 30yr
- Down + closing
- —
- Monthly P&I
- —
- Monthly cashflow
- —
- DSCR
- —
- Eligible?
- —
No personal income docs; deal must DSCR.
Hard money
10% down · 12.0% · 12mo
- Down + closing
- —
- Monthly P&I
- —
- Monthly cashflow
- —
- DSCR
- —
- Eligible?
- —
Short-term bridge; refi at stabilization.
Rent comps 6 comps
| Address | Beds | Baths | Sqft | Rent | $/sqft | DOM | Units | Dist |
|---|---|---|---|---|---|---|---|---|
| 200 Ridge Way Fayetteville, GA | 4.0 | 3.0 | 2209 | $2,146 | $0.97 | 24d | 1 | 0.13mi |
| 135 Murphy Creek Ln Fayetteville, GA | 4.0 | 2.0 | 2100 | $3,500 | $1.67 | 24d | 1 | 0.56mi |
| 205 Kingswood Dr Fayetteville, GA | 3.0 | 2.0 | 1820 | $2,600 | $1.43 | 43d | 1 | 0.65mi |
| 100 Brookwood Ln Fayetteville, GA | 3.0 | 3.0 | 1662 | $6,500 | $3.91 | 10d | 1 | 1.15mi |
| 150 Bunny Ln Fayetteville, GA | 4.0 | 2.0 | 1632 | $2,200 | $1.35 | 24d | 1 | 1.39mi |
| 155 N Hampton Dr Fayetteville, GA | 3.0 | 2.0 | 1398 | $2,250 | $1.61 | 43d | 1 | 1.47mi |
Listing history 9 events
-
2026-06-18statusdays on market $349,900 Active 14 DOM
-
2026-06-17days on market $349,900 New 13 DOM
-
2026-06-16days on market $349,900 New 12 DOM
-
2026-06-15days on market $349,900 New 11 DOM
-
2026-06-13days on market $349,900 New 9 DOM
-
2026-06-09days on market $349,900 New 5 DOM
-
2026-06-08days on market $349,900 New 4 DOM
-
2026-06-07remarks 699-char remark
-
2026-06-07$349,900 New 3 DOM
ⓘ Source: listings_history table (triggers on properties + properties_extension) + one-shot
backfill from property_details.listing_events for pre-trigger history.
Tax reassessment forecast GA · Resets to sale price
- Current annual tax
- $2,194 · $183/mo
- Projected year-2 tax
- $3,219 · $268/mo
- Expected delta
- +$1,025/yr (+$85/mo · 46.7%)
ⓘ Screening estimate from a state-policy table — verify with the county assessor before closing.
Climate risk First Street
- Flood 1/10 Low FEMA zone X (unshaded) · 0% chance over 30 yrs
- Wildfire 3/10 Moderate
- Heat 5/10 Major 6 d/yr ≥106°F today · 15 d/yr by 30 yrs out
- Wind 6/10 Major 27% chance of damaging wind over 30 yrs
- Air quality 4/10 Moderate 3 unhealthy d/yr today · 5 by 30 yrs out
Nearby sold comps map
Loading sold comps map…
Walkable amenities ~0.75 mi
Loading nearby amenities…
Taxation est. · year 1
- Rental income
- $31,644
- − Mortgage interest
- −$19,600
- − Property taxes
- −$2,194
- − Insurance
- −$1,750
- − Repairs & maintenance
- −$2,532
- − Management
- −$2,532
- − Depreciation
- −$10,179
- Taxable loss
- −$7,141
- Est. tax savings @ 24.0%
- +$1,714
- After-tax cash flow
- $750/yr
For passive investors: Depreciation is non-cash, so a rental often shows a tax loss while cash-flowing — sheltering income. Rental losses are passive: they offset passive income freely, and up to $25,000/yr can offset ordinary (W-2) income if you actively participate and your MAGI is under $100k (phasing out to $0 by $150k); unused losses carry forward. On sale, claimed depreciation is recaptured at up to 25%, and gains may owe capital-gains tax (a 1031 exchange can defer both). Figures are a year-1 estimate at your 24.0% rate — not tax advice; consult a CPA.
Schools (NCES district)
- District
- Fayette County
- NCES district ID
- 1302130
- Math proficiency
- 52% ▼ -12.00%
- Reading proficiency
- 60% ▼ -7.00%
- Median HH income
- $80,746
- Composite
- 50.67/100
- National rank
- #1824
- State rank
- #7 of 174 in GA
Livability — Fayetteville
- Score
- 71/100
- State rank
- #86
- US rank
- #7167
Category grades
Schools grade is shown separately in the Schools card above.
Census & demographics
- County
- Fayette County · 112,821 people
- City population
- 72,287
- Metro
- Atlanta-Sandy Springs-Alpharetta, GA
- Population (ZIP)
- 40,476
- Household income
- $118,436
- Rent vs Own
- Severe rent burden
- 415.0
Population outlook (Fayette County) Hauer SSP2
- Today (2025)
- 120,914 people
- By 2030
- 125,439 · +3.7%
- By 2040
- 132,378 · +9.5%
- By 2050
- 137,123 · +13.4%
- By 2075
- 156,091 · +29.1%
- By 2100
- 163,102 · +34.9%
Race, ethnicity, and origin ACS 2023
- Neighborhood character
- Diverse neighborhood (Simpson 0.60)
- Race & ethnicity
- White 57% Black 26% Two or more races 7% Hispanic / Latino 6% Asian 3%
- Hispanic origin (detail)
- Mexican 2% Puerto Rican 1%
- Common ancestry
- Slovak 3% Italian 2% Lithuanian 2%
- Foreign-born
- 7% · Canada, China, Vietnam
- Languages at home
- 90% English-only · Spanish 5% Other Indo-European 1% German/W. Germanic 1%
Political lean MEDSL · Fayette
- 2024 margin
- Toss-up / Even · D 48.0% · R 51.1%
- 2008→2024 swing
- +27.5pp toward D · 2008: -30.7pp · 2024: -3.1pp
- All cycles
- 2024: R+3.1 2020: R+6.8 2016: R+19.5 2012: R+31.4 2008: R+30.7
Not yet ingested
- Civics
- —
Market trends
- HPI YoY
- ▼ -146.38%
- Current HPI
- 238.3395
- Rent YoY
- ▲ 3.22%
- Metro
- Atlanta-Sandy Springs-Alpharetta, GA
- State GDP YoY
- ▲ 2.66%
- F500 in state
- 28
Industry mix (Fortune 500 HQ in GA)
| Industry | F500 HQs | Revenue |
|---|---|---|
| Paper / Packaging | 2 | $29B |
|
||
| Retail | 1 | $160B |
|
||
| Transportation / Logistics | 1 | $91B |
|
||
| Airlines | 1 | $62B |
|
||
| Consumer Goods | 1 | $47B |
|
||
| Utilities | 1 | $25B |
|
||
Price history
+299.9% since first listed11 events — show timeline
- 2026-06-04 Listed $349,900 GAMLS
- 2014-10-30 Price Changed $93,200 GAMLS
- 2012-07-09 Sold (MLS) $93,200 GAMLS
- 2012-06-29 Listing Removed — GAMLS
- 2012-06-29 Listed $99,000 GAMLS
- 2012-06-29 Price Changed $99,000 GAMLS
- 2012-01-03 Listing Removed — GAMLS
- 2011-12-07 Price Changed $99,000 GAMLS
- 2011-08-18 Listed $114,900 GAMLS
- 1996-06-27 Sold (Public Records) $102,000 Public Records
- 1992-09-03 Sold (Public Records) $87,500 Public Records
Property tax history
+1.8%/yrLatest (2025): $2,194 · +3.1% YoY. Source: county tax records.
Cash-flow waterfall
monthlySold comps — $/sqft
last 12 mo · ≤1 miLoading sold comps…