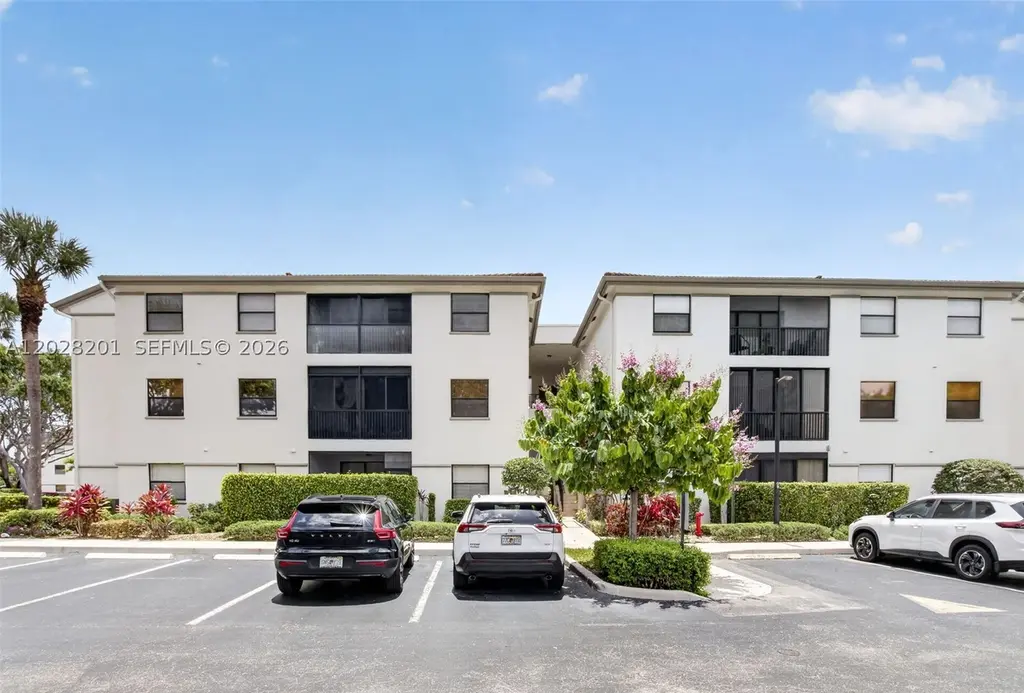
5133 Brisata Cir Unit L · Boynton Beach, FL
Flood risk 1/10 · Minimal
- FEMA flood zone
- X (unshaded)
- Chance of flooding over 30 yrs
- 0.0%
- Est. flood insurance / yr
- $507 – $1,088
Fire risk 1/10 · Minimal
- Est. fire insurance / yr
- $947 – $1,759
Heat risk 10/10 · Severe
- Hot days now (above 106°F)
- 7 days/yr
- Hot days in 30 yrs
- 26 days/yr
Wind risk 10/10 · Severe
- Chance of severe wind over 30 yrs
- 99.0%
Air-quality risk 2/10 · Minimal
- Unhealthy air days now
- 1 days/yr
- Unhealthy air days in 30 yrs
- 2 days/yr
Risk factors via First Street. Map © Google.
Why this score? — see what drove the C- grade
The composite is a weighted blend of 9 inputs, each scored 0–100. Each bar is that input's sub-score; the figure is the points it added to the 100-point composite (weight × sub-score).
- Cash flow +14.1/30.0
- 1% rule +9.0/10.0
- ARV discount +7.5/15.0
- Appreciation +4.9/10.0
- DSCR +4.3/10.0
- Schools +4.3/10.0
- Livability +3.6/5.0
- Rent growth +2.8/5.0
- Condition / age +2.5/5.0
$209,900
🖨 Deal sheet (PDF) 📄 Offer letter ✓ Due diligence
Listing remarks
One of a kind corner unit, bright and airy condo that is fully updated, Located on the 2nd floor with water view and elevator in building. Meticulously maintained & totally renovated. Freshly painted with diagonally set white ceramic flooring that spams throughout all the living areas including kitchen, dining, living room, one bedroom & balcony overlooking lake. New laminate flooring in all additional bedrooms including large Master Suite which also has an amazing lake view. both Bathrooms have been totally renovated with quartz countertops & beautiful neutral ceramic color tiles. Kitchen boasts a unique neutral Quartz countertop with fairly new stainless-steel appliances
Key facts
- Totally renovated
- Corner unit
- Elevator in building
Tags
Property features AI
Finance
- Financial info: Pets allowed
- HOA & community: Monthly association fee; Association amenities include clubhouse, pool, tennis and basketball courts, pickleball, shuffleboard, billiard room, library, hobby room, barbecue/picnic areas, elevator(s); Association fee covers amenities, common areas, cable TV, insurance, internet, grounds and structure maintenance, parking, pest control, pool(s), recreation facilities, roof, security, trash and water
Exterior
- Parking: Assigned parking; Guest parking; One assigned space
- Security: Complex fenced; Elevator secured; Security guard; Fire sprinkler system; Smoke detectors; Exterior lighting; Wall fencing
- Utilities: Appliances are energy-efficient/green; Has cooling; Has heating
- Home design: 3-story building; Entry located on level 2; Faces west; Attached property
- Construction: Block construction; Effective year built
- Exterior features: Balcony; Open balcony/patio; Privacy wall; Tennis courts; Association heated pool; Association pool
Interior
- Kitchen: Electric range; Microwave; Dishwasher; Refrigerator; Icemaker; Disposal
- Bedrooms: Bedroom 2 (10 x 10); Bedroom 3 (10 x 10); Additional bedroom / room (12 x 15)
- Flooring: Ceramic tile; Hardwood; Laminate; Wood
- Bathrooms: 2 full bathrooms
- Heating & cooling: Central heating (electric); Electric cooling; Ceiling fan(s)
- Interior features: Dining area and separate/formal dining room; Eat-in kitchen; Pantry; Split bedrooms; Walk-in closet(s); Elevator; Blinds and drapes; Sliding windows
- Laundry & utility: Washer; Dryer; Electric water heater
Neighborhood map
What this means for you Summary
Snapshot
- This is a 3-bed/2.0-bath condo listed at $210k.
Deal economics
- At list price, monthly cash flow is $32 ($385/yr) — positive.
- The deal already cash-flows at list — no discount required.
- Meets the 1% rule at list price ($3k rent vs $210k).
- Cap rate 6.5% vs local median 4.3% in Boynton Beach — top-decile yield for the area; either an underpriced asset or a hidden risk that comps aren't pricing in. Stress-test before assuming the spread holds.
Location & tenants
- Location reads 72/100 on livability (#351 in FL) — a middle-class / working-renter tenant base. Strengths: housing A+, health & safety B+, cost of living B; Watch: amenities D+, crime D-, commute F.
- Palm Beach (suburban): math 46% / reading 53% proficiency, ranked #34 of 73 in FL (top 47%) — families likely to look elsewhere, expect single-tenant / working-renter base with shorter leases.
- Market conditions: Rents rising (+1.3%/yr); 479 active listings in the ZIP; 40 comparable units currently listed for rent nearby; rentals at typical pace (median 25d on market — plan ~3-4 weeks tenant-placement turnaround); solid renter incomes; 3,974 units permitted in Palm Beach County in 2024 (1,012 in 5+ unit buildings).
- This rent runs 44% of the median local income ($81k/yr) — at the standard rent-burdened threshold; future hikes will face affordability resistance.
Forward outlook
- In year one you build about $944 of equity ($1k loan paydown + $-507 appreciation (-0.2% local appreciation)).
- Palm Beach County population projected at +30% by 2050 — long-run rental-demand tailwind backs the buy-and-hold thesis.
Negotiation context
- Only 7 days on market — expect competitive offers; lowballing is unlikely to land.
- 10 sale attempts since 4y ago; this cycle's ask is 7138% above the opening price — seller raised mid-cycle; expect resistance to lowballs.
Risks & watch-outs
- Watch-outs: HOA is 30% of rent.
- Climate carrying-cost: severe wind risk, 99% chance of damaging wind over 30y; extreme-heat days projected 7→26/yr by 2055 (HVAC capex compounding) — expect insurance premiums to compound above CPI over the hold.
Questions for the listing agent
- What does the HOA fee cover, when was the last increase, and are there any pending special assessments or reserve-fund shortfalls?
- Any open or pending special assessments — roof, HVAC, plumbing, elevator, façade? What's the per-unit balance and payoff schedule, and is the seller paying it off at close or rolling it to the buyer?
- Is there a deadline driving the sale (1031 exchange, divorce, estate, relocation)? That informs how much negotiation room exists.
- Crime grade is D in this area — have there been break-ins, vandalism, or insurance claims at this property in the last 3 years? What carrier currently insures it and at what premium?
- What's the average days-on-market for RENTAL listings here right now (not sales)? A rising rental-DOM trend means longer vacancies and softer asking-rent achievability than the comps imply.
- What's the recent tenant-quality profile in this submarket — average credit score on applications, eviction rate, late-payment / NSF rate, and stable-employment percentage? A property-management company in the area should have these aggregated.
- How much new apartment / multifamily construction is in the pipeline within 1–3 miles? Heavy new supply (>2% of stock underway) typically softens rents 12–24 months out; light construction supports rent growth.
Investment metrics
- 1% rule
- 1.40% ✓
- Cap rate
- 6.48%
- Cash-on-cash
- 0.65%
- DSCR
- 1.03
- GRM
- 6.0
CMA / ARV
No comps found within radius.
Projected returns pro-forma
-0.24% appreciation · 1.28% rent growth · sell at horizon
- IRR
- -4.1%
- Equity multiple
- 0.81×
- Total profit
- $-10,908
- Equity at exit
- $58,424
- IRR
- 0.1%
- Equity multiple
- 1.01×
- Total profit
- $482
- Equity at exit
- $68,245
Cash invested: $58,772 (down + closing). Projections, not guarantees.
Landlord ↔ Tenant lean methodology
- Overall (STATE)
- 87 Strongly Landlord-Friendly
- State Florida
- 87 Strongly Landlord-Friendly · R+3
- County
- — inherits STATE
- City
- — inherits STATE
ZIP-level market 33437
- Home prices YoY
- -0.1%
- Rents YoY
- 1.3%
- Active inventory
- 479
- Price-to-rent
- 6.0×
Monthly cashflow live
- Estimated rent
- $2,937 high interval (Pro) →
- Mortgage (P&I)
- −$1,101
- Tax from tax record
- −$222 /mo · $2,659/yr
- Insurance
- −$87
- HOA
- −$878
- Vacancy / Maint / Mgmt
- −$617
- Net cashflow
- $32
Break-even live
Sensitivity live
| Price | -10% $151 | -5% $91 | +0% $32 | +5% $-27 | +10% $-87 |
|---|---|---|---|---|---|
| Rent | -10% $-200 | -5% $-84 | +0% $32 | +5% $148 | +10% $264 |
| Rate | -1.0pp $138 | -0.5pp $85 | base $32 | +0.5pp $-22 | +1.0pp $-78 |
UW: 25.0% down · 7.5% · 30yr · 1.5% tax · 5.0% vac · 8.0% maint · 8.0% mgmt
Financing live
Cash to close
- Down payment
- $52,475
- Closing costs
- $6,297
- Reserves months
- —
- Total cash needed
- —
Loan-product check · same deal, 3 products live
Conventional
25% down · 7.5% · 30yr
- Down + closing
- —
- Monthly P&I
- —
- Monthly cashflow
- —
- DSCR
- —
- Eligible?
- —
Personal DTI + credit; lowest rate.
DSCR
20% down · 8.5% · 30yr
- Down + closing
- —
- Monthly P&I
- —
- Monthly cashflow
- —
- DSCR
- —
- Eligible?
- —
No personal income docs; deal must DSCR.
Hard money
10% down · 12.0% · 12mo
- Down + closing
- —
- Monthly P&I
- —
- Monthly cashflow
- —
- DSCR
- —
- Eligible?
- —
Short-term bridge; refi at stabilization.
Rent comps 40 comps
| Address | Beds | Baths | Sqft | Rent | $/sqft | DOM | Units | Dist |
|---|---|---|---|---|---|---|---|---|
| 5133 Brisata Cir Unit P Boynton Beach, FL | 3.0 | 2.0 | 1374 | $2,800 | $2.04 | 25d | 1 | 0.02mi |
| 5157 Floria Way Unit J Boynton Beach, FL | 3.0 | 2.0 | 1447 | $3,300 | $2.28 | 25d | 1 | 0.09mi |
| 5155 Europa Dr Unit J Boynton Beach, FL | 3.0 | 2.0 | 1333 | $2,750 | $2.06 | 25d | 1 | 0.18mi |
| 5418 Firenze Dr Unit P Boynton Beach, FL | 2.0 | 2.0 | 1139 | $2,400 | $2.11 | 3d | 1 | 0.20mi |
| 5299 Europa Dr Unit P Boynton Beach, FL | 3.0 | 2.0 | 1606 | $3,000 | $1.87 | 14d | 1 | 0.21mi |
| 5275 Europa Dr Unit I Boynton Beach, FL | 3.0 | 2.0 | 1282 | $2,500 | $1.95 | 2d | 1 | 0.26mi |
| 5234 Europa Dr Unit A Boynton Beach, FL | 3.0 | 2.0 | 1578 | $2,500 | $1.58 | 20d | 1 | 0.29mi |
| 5373 Mirror Lakes Blvd Boynton Beach, FL | 3.0 | 2.0 | 1310 | $2,100 | $1.60 | 25d | 1 | 0.36mi |
| 9498 S Military Trl #5 Boynton Beach, FL | 3.0 | 2.5 | 1317 | $2,900 | $2.20 | 25d | 1 | 0.42mi |
| 10056 Boynton Place Cir Boynton Beach, FL | 3.0 | 2.0 | 1253 | $2,950 | $2.35 | 2d | 1 | 0.48mi |
| 10056 Boynton Place Cir Boynton Beach, FL | 3.0 | 2.0 | 1253 | $3,000 | $2.39 | 25d | 1 | 0.48mi |
| 10492 Boynton Place Cir Boynton Beach, FL | 1.0–3.0 | 1.0–2.0 | 1017 | $2,757 | $2.71 | 0d | 19 | 0.48mi |
| 10187 Mangrove Dr #104 Boynton Beach, FL | 2.0 | 2.0 | 1260 | $2,350 | $1.87 | 25d | 1 | 0.49mi |
| 9935 Pineapple Tree Dr #202 Boynton Beach, FL | 2.0 | 2.0 | 1008 | $2,575 | $2.55 | 15d | 1 | 0.50mi |
| 9900 Pineapple Tree Dr #106 Boynton Beach, FL | 2.0 | 2.0 | 1008 | $2,250 | $2.23 | 25d | 1 | 0.56mi |
| 5217 Cedar Lake Rd Boynton Beach, FL | 1.0–3.0 | 1.0–2.0 | 1030 | $2,811 | $2.73 | 2d | 51 | 0.59mi |
| 5020 Ashley Lake Dr Boynton Beach, FL | 2.0 | 2.0 | 1002 | $2,346 | $2.34 | 14d | 1 | 0.62mi |
| 5020 Ashley Lake Dr Boynton Beach, FL | 2.0 | 2.0 | 1002 | $2,394 | $2.39 | 3d | 1 | 0.62mi |
| 9565 El Clair Ranch Rd Boynton Beach, FL | 3.0 | 2.0 | 1867 | $3,500 | $1.87 | 8d | 1 | 0.63mi |
| 9565 El Clair Ranch Rd Boynton Beach, FL | 3.0 | 2.0 | 1867 | $3,500 | $1.87 | 21d | 1 | 0.63mi |
| 4944 Equestrian Cir Unit A Boynton Beach, FL | 2.0 | 2.0 | 1400 | $2,500 | $1.79 | 8d | 1 | 0.68mi |
| 5895 Autumn Lake Ln Unit A Boynton Beach, FL | 3.0 | 2.0 | 1469 | $2,600 | $1.77 | 25d | 1 | 0.75mi |
| 4525 Nutmeg Tree Ln Unit A Boynton Beach, FL | 2.0 | 2.0 | 1404 | $3,000 | $2.14 | 25d | 1 | 0.79mi |
| 10592 Tropic Palm Ave #202 Boynton Beach, FL | 2.0 | 2.0 | 1385 | $2,450 | $1.77 | 25d | 1 | 0.84mi |
| 4907 Boxwood Cir Boynton Beach, FL | 3.0 | 2.0 | 1731 | $2,900 | $1.68 | 25d | 1 | 0.87mi |
| 10624 Tropic Palm Ave #202 Boynton Beach, FL | 3.0 | 2.0 | 1385 | $2,550 | $1.84 | 25d | 1 | 0.88mi |
| 6165 Country Fair Cir Boynton Beach, FL | 3.0 | 2.5 | 1656 | $3,200 | $1.93 | 25d | 1 | 0.90mi |
| 6037 Rossmoor Lakes Ct Boynton Beach, FL | 3.0 | 2.0 | 1617 | $4,700 | $2.91 | 25d | 1 | 0.92mi |
| 4045 White Pine Dr Boynton Beach, FL | 3.0 | 2.0 | 1566 | $1,800 | $1.15 | 2d | 1 | 1.00mi |
| 9926 Watermill Cir Unit F Boynton Beach, FL | 3.0 | 2.0 | 1471 | $2,400 | $1.63 | 25d | 1 | 1.03mi |
| 10596 Sunset Isles Ct Boynton Beach, FL | 3.0 | 2.0 | 1769 | $4,500 | $2.54 | 25d | 1 | 1.03mi |
| 10921 Royal Caribbean Cir Boynton Beach, FL | 3.0 | 2.0 | 1762 | $3,800 | $2.16 | 4d | 1 | 1.18mi |
| 10921 Royal Caribbean Cir Boynton Beach, FL | 3.0 | 2.0 | 1782 | $3,800 | $2.13 | 25d | 1 | 1.18mi |
| 9873 Lawrence Rd Boynton Beach, FL | 2.0 | 2.0 | 1200 | $2,267 | $1.89 | 22d | 1 | 1.20mi |
| 9873 Lawrence Rd Boynton Beach, FL | 2.0 | 2.0 | 1200 | $2,315 | $1.93 | 4d | 1 | 1.20mi |
| 10390 Utopia Cir E Unit 10390 Boynton Beach, FL | 3.0 | 2.0 | 1845 | $4,200 | $2.28 | 25d | 1 | 1.23mi |
| 10390 Utopia Cir E Unit E Boynton Beach, FL | 3.0 | 2.0 | 1845 | $4,200 | $2.28 | 3d | 1 | 1.23mi |
| 9336 Water Course Way Boynton Beach, FL | 3.0 | 2.0 | 1779 | $3,600 | $2.02 | 25d | 1 | 1.24mi |
| 9336 Water Course Way Boynton Beach, FL | 3.0 | 2.0 | 1779 | $3,600 | $2.02 | 22d | 1 | 1.24mi |
| 5537 Pebble Brook Ln Boynton Beach, FL | 3.0 | 2.0 | 1166 | $2,825 | $2.42 | 15d | 1 | 1.25mi |
HOA detail condo
- Monthly dues
- $878 · $10,536/yr
- Likely covers
- water
- Assessments
- None detected in remarks — confirm with the listing agent.
Listing history 6 events
-
2026-06-18days on market $209,900 Active 7 DOM
-
2026-06-17days on market $209,900 Active 6 DOM
-
2026-06-16days on market $209,900 Active 5 DOM
-
2026-06-15days on market $209,900 Active 4 DOM
-
2026-06-13remarks 687-char remark
-
2026-06-13$209,900 Active 2 DOM
ⓘ Source: listings_history table (triggers on properties + properties_extension) + one-shot
backfill from property_details.listing_events for pre-trigger history.
Tax reassessment forecast FL · Resets to sale price
- Current annual tax
- $2,659 · $222/mo
- Projected year-2 tax
- $2,659 · $222/mo
- Expected delta
- $0/yr ($0/mo · 0.0%)
ⓘ Screening estimate from a state-policy table — verify with the county assessor before closing.
Climate risk First Street
- Flood 1/10 Low FEMA zone X (unshaded) · 0% chance over 30 yrs
- Wildfire 1/10 Low
- Heat 10/10 Extreme 7 d/yr ≥106°F today · 26 d/yr by 30 yrs out
- Wind 10/10 Extreme 99% chance of damaging wind over 30 yrs
- Air quality 2/10 Low 1 unhealthy d/yr today · 2 by 30 yrs out
Nearby sold comps map
Loading sold comps map…
Walkable amenities ~0.75 mi
Loading nearby amenities…
Taxation est. · year 1
- Rental income
- $35,238
- − Mortgage interest
- −$11,758
- − Property taxes
- −$2,659
- − Insurance
- −$1,050
- − Repairs & maintenance
- −$2,819
- − Management
- −$2,819
- − HOA
- −$10,536
- − Depreciation
- −$6,106
- Taxable loss
- −$2,508
- Est. tax savings @ 24.0%
- +$602
- After-tax cash flow
- $987/yr
For passive investors: Depreciation is non-cash, so a rental often shows a tax loss while cash-flowing — sheltering income. Rental losses are passive: they offset passive income freely, and up to $25,000/yr can offset ordinary (W-2) income if you actively participate and your MAGI is under $100k (phasing out to $0 by $150k); unused losses carry forward. On sale, claimed depreciation is recaptured at up to 25%, and gains may owe capital-gains tax (a 1031 exchange can defer both). Figures are a year-1 estimate at your 24.0% rate — not tax advice; consult a CPA.
Schools (NCES district)
- District
- Palm Beach
- NCES district ID
- 1201500
- Math proficiency
- 46% ▼ -16.00%
- Reading proficiency
- 53% ▼ -4.00%
- Median HH income
- $53,943
- Composite
- 42.72/100
- National rank
- #3160
- State rank
- #34 of 73 in FL
Livability — Boynton Beach
- Score
- 72/100
- State rank
- #351
- US rank
- #6098
Category grades
Schools grade is shown separately in the Schools card above.
Census & demographics
- County
- Palm Beach County · 1,438,312 people
- City population
- 148,060
- Metro
- Miami-Fort Lauderdale-Pompano Beach, FL
- Population (ZIP)
- 37,229
- Household income
- $80,710
- Rent vs Own
- Severe rent burden
- 902.0
Population outlook (Palm Beach County) Hauer SSP2
- Today (2025)
- 1,637,487 people
- By 2030
- 1,743,255 · +6.5%
- By 2040
- 1,948,712 · +19.0%
- By 2050
- 2,132,979 · +30.3%
- By 2075
- 2,530,027 · +54.5%
- By 2100
- 2,706,979 · +65.3%
Race, ethnicity, and origin ACS 2023
- Neighborhood character
- Predominantly White (68%)
- Race & ethnicity
- White 68% Two or more races 13% Hispanic / Latino 12% Black 10% Asian 3%
- Hispanic origin (detail)
- Mexican 1% Puerto Rican 2% Cuban 1% Dominican 1%
- Common ancestry
- Scotch-Irish 8% Romanian 8% Hispanic 6%
- Foreign-born
- 18% · Canada, Jamaica, Vietnam
- Languages at home
- 78% English-only · Spanish 10% French/Haitian/Cajun 6% Other Indo-European 2%
Political lean MEDSL · Palm Beach
- 2024 margin
- Toss-up / Even · D 50.0% · R 49.2%
- 2008→2024 swing
- -22.1pp toward R · 2008: 22.9pp · 2024: 0.8pp
- All cycles
- 2024: D+0.8 2020: D+12.8 2016: D+15.3 2012: D+17.0 2008: D+22.9
Not yet ingested
- Civics
- —
Market trends
- HPI YoY
- ▼ -0.24%
- Current HPI
- 257.5891
- Rent YoY
- ▲ 1.28%
- Metro
- Miami-Fort Lauderdale-Pompano Beach, FL
- State GDP YoY
- ▲ 3.28%
- F500 in state
- 36
Industry mix (Fortune 500 HQ in FL)
| Industry | F500 HQs | Revenue |
|---|---|---|
| Industrial Technology | 2 | $29B |
|
||
| Insurance | 2 | $17B |
|
||
| Retail | 1 | $60B |
|
||
| Technology Distribution | 1 | $58B |
|
||
| Homebuilding | 1 | $35B |
|
||
| Technology Manufacturing | 1 | $35B |
|
||
Price history
-97.3% since first listed27 events — show timeline
- 2026-06-12 Listed for Rent $2,900 MARMLS
- 2026-05-31 Listed $209,900 MARMLS
- 2026-04-30 Listing Removed — Beaches MLS
- 2026-04-12 Price Changed $234,900 Beaches MLS
- 2026-03-20 Price Changed $244,900 Beaches MLS
- 2026-03-03 Price Changed $254,900 Beaches MLS
- 2026-02-15 Rental Removed $2,900 MARMLS
- 2026-02-04 Listed $270,000 Beaches MLS
- 2025-12-31 Listing Removed — MARMLS
- 2025-08-31 Listed for Rent $2,900 MARMLS
- 2025-06-11 Price Changed $269,900 MARMLS
- 2025-06-11 Relisted — MARMLS
- 2025-05-08 Listing Removed — Beaches MLS
- 2025-05-06 Price Changed $279,999 Beaches MLS
- 2025-05-02 Listed $289,999 Beaches MLS
- 2025-04-29 Listing Removed — MARMLS
- 2025-03-21 Listed $298,900 MARMLS
- 2023-12-31 Listing Removed — MARMLS
- 2023-10-12 Price Changed $328,900 MARMLS
- 2023-06-26 Listed $334,900 MARMLS
- 2022-08-12 Sold (Public Records) $260,000 Public Records
- 2022-08-11 Sold (MLS) $260,000 Beaches MLS
- 2022-06-30 Contingent — Beaches MLS
- 2022-06-28 Relisted — Beaches MLS
- 2022-06-06 Pending — Beaches MLS
- 2022-06-03 Listed $260,000 Beaches MLS
- 2016-06-13 Sold (Public Records) $106,000 Public Records
Property tax history
+1.9%/yrLatest (2025): $2,659 · +3.4% YoY. Source: county tax records.
Cash-flow waterfall
monthlySold comps — $/sqft
last 12 mo · ≤1 miLoading sold comps…