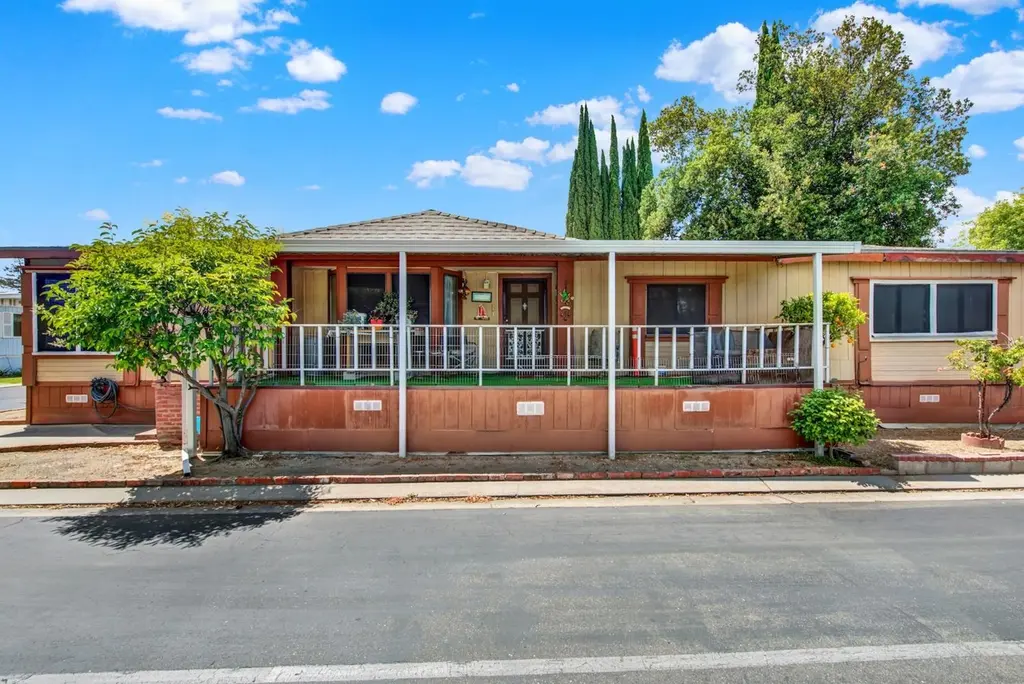
2621 Prescott Rd #159 · Modesto, CA
Flood risk 1/10 · Minimal
- FEMA flood zone
- X (unshaded)
- Chance of flooding over 30 yrs
- 0.0%
- Est. flood insurance / yr
- $507 – $1,088
Fire risk 5/10 · Moderate
- Est. fire insurance / yr
- $659 – $1,223
Heat risk 6/10 · Moderate
- Hot days now (above 102°F)
- 7 days/yr
- Hot days in 30 yrs
- 15 days/yr
Wind risk 1/10 · Minimal
- Chance of severe wind over 30 yrs
- —
Air-quality risk 10/10 · Severe
- Unhealthy air days now
- 28 days/yr
- Unhealthy air days in 30 yrs
- 32 days/yr
Risk factors via First Street. Map © Google.
Why this score? — see what drove the B+ grade
The composite is a weighted blend of 9 inputs, each scored 0–100. Each bar is that input's sub-score; the figure is the points it added to the 100-point composite (weight × sub-score).
- Cash flow +30.0/30.0
- ARV discount +15.0/15.0
- 1% rule +10.0/10.0
- DSCR +10.0/10.0
- Livability +3.2/5.0
- Rent growth +3.1/5.0
- Schools +2.6/10.0
- Condition / age +2.5/5.0
- Appreciation +0.0/10.0
$95,000
🖨 Deal sheet 📄 Offer letter ✓ Due diligence
Listing remarks
Welcome to the highly desirable Friendly Village of Modesto, a vibrant 55+ active community offering a peaceful, park-like atmosphere paired with resort-style amenities and an engaging lifestyle. Residents enjoy weekly social events, a heated pool and spa, fitness center, clubhouse, movie nights, monthly dinners, mini putting green, and a pet-friendly environment where most animals are welcome. This rare and spacious 1,809 sq. ft. home features 3 bedrooms and 2 bathrooms with an open-concept floorplan designed for comfortable living and entertaining. The generously sized primary suite offers the perfect private retreat to relax and unwind. Situated on a desirable corner lot, this home provi
Key facts
- Fitness center
- Clubhouse
- Movie nights
Tags
Property features AI
Finance
- Other: Park name: Friendly Village
- Financial info: Land lease (space rent) applies; Land lease amount / association fee: $915 monthly
- HOA & community: Monthly association fee of $915; Association amenities include clubhouse and public transit nearby; Association fee covers management and grounds maintenance; Located in a senior community
Exterior
- Parking: Covered parking
- Security: Smoke detector; Carbon monoxide detector
- Utilities: Public sewer; 220 volts in laundry
- Home design: Manufactured home in park; Double wide; Original condition
- Construction: Metal skirting; Manufacturer: Kaufman/Broad; Make: Bainbridge
- Exterior features: Covered patio; Covered deck; Railed porch; Porch steps; Regular-shaped lot; Composition roof
Interior
- Kitchen: Disposal; Dishwasher; Laminate countertops
- Bedrooms: 3 bedrooms
- Flooring: Linoleum; Carpet
- Bathrooms: 2 full bathrooms; Tub with shower over
- Heating & cooling: Central heating; Central cooling
- Interior features: Disposal; Dishwasher; Laminate countertops; Great room; Dining/living combo; Smoke detector; Carbon monoxide detector
- Laundry & utility: Laundry inside (220V available)
Neighborhood map
What this means for you Summary
Snapshot
- This is a 3-bed/2.0-bath manufactured listed at $95k.
Deal economics
- At list price, monthly cash flow is $407 ($5k/yr) — positive.
- The deal already cash-flows at list — no discount required.
- Meets the 1% rule at list price ($3k rent vs $95k).
- Recommended offer: $94k (1.5% below list) — sets the bar for market timing.
- Cap rate 11.4% vs local median 3.2% in Modesto — top-decile yield for the area; either an underpriced asset or a hidden risk that comps aren't pricing in. Stress-test before assuming the spread holds.
Location & tenants
- Location reads 63/100 on livability (#451 in CA) — a middle-class / working-renter tenant base. Strengths: housing A+; Watch: amenities C-, schools D+, health & safety D+.
- Stanislaus Union Elementary (urban): math 24% / reading 35% proficiency, ranked #344 of 517 in CA (top 66%) — low school quality limits family demand, transient renter base, plan for 1-2y turnover.
- Market conditions: Rents rising (+2.2%/yr); 161 active listings in the ZIP; 9 comparable units currently listed for rent nearby; rentals at typical pace (median 14d on market — plan ~3-4 weeks tenant-placement turnaround); solid renter incomes; 923 units permitted in Stanislaus County in 2024 (63 in 5+ unit buildings).
- This rent runs 40% of the median local income ($76k/yr) — at the standard rent-burdened threshold; future hikes will face affordability resistance.
Forward outlook
- Local home prices are declining (-3.0%/yr); year-one equity from $657 of loan paydown is wiped out by about $3k of value loss. Plan a longer hold.
- Stanislaus County population projected at +14% by 2050 — modest demand growth; plan on rents tracking national, not racing it.
- At projected returns (-3.0% appreciation + 2.2% rent growth), your $27k cash investment doubles in ~8 years — after that, you're playing with house money.
Negotiation context
- It's been on market 20 days — a 2% lower offer ($94k) is reasonable based on typical stale-listing flexibility.
Risks & watch-outs
- Watch-outs: HOA is 37% of rent.
- Climate carrying-cost: moderate wildfire risk; extreme-heat days projected 7→15/yr by 2055 (HVAC capex compounding) — expect insurance premiums to compound above CPI over the hold.
Questions for the listing agent
- What does the HOA fee cover, when was the last increase, and are there any pending special assessments or reserve-fund shortfalls?
- Is there a deadline driving the sale (1031 exchange, divorce, estate, relocation)? That informs how much negotiation room exists.
- Schools are D-rated, which usually means shorter tenancies and higher turnover. Who's the typical renter profile here, and what's been the actual vacancy rate?
- Crime grade is F in this area — have there been break-ins, vandalism, or insurance claims at this property in the last 3 years? What carrier currently insures it and at what premium?
- What's the average days-on-market for RENTAL listings here right now (not sales)? A rising rental-DOM trend means longer vacancies and softer asking-rent achievability than the comps imply.
- What's the recent tenant-quality profile in this submarket — average credit score on applications, eviction rate, late-payment / NSF rate, and stable-employment percentage? A property-management company in the area should have these aggregated.
- How much new for-sale + rental construction is in the pipeline within 1–3 miles? Heavy new supply typically softens prices + rents 12–24 months out; constrained supply supports both.
Investment metrics
- 1% rule
- 2.64% ✓
- Cap rate
- 11.44%
- Cash-on-cash
- 18.37%
- DSCR
- 1.82
- GRM
- 3.2
CMA / ARV
- ARV (on-the-fly)
- $148,338
- Comps found
- 6
Show comp detail 6 sales within ~0.75 mi
| Address | Dist | Beds/Ba | Sqft | Sold | Price | $/sf | Match |
|---|---|---|---|---|---|---|---|
| 2621 Prescott #189 | 0.07mi | 2/2.0 (-1) | 1,740 (-4%) | 2mo | $65,000 | $37 | 84 |
| 2621 Prescott Rd #17 | 0.00mi | 3/2.0 | 1,573 (-13%) | 2mo | $118,000 | $75 | 77 |
| 2621 Prescott Rd #201 | 0.00mi | 2/2.0 (-1) | 1,776 (-2%) | 24mo | $110,000 | $62 | 72 |
| 2621 Prescott #161 | 0.10mi | 3/2.0 | 1,716 (-5%) | 22mo | $140,000 | $82 | 68 |
| 2113 Barrington Ln | 0.36mi | 3/2.0 | 1,620 (-10%) | 1mo | $300,000 | $185 | 64 |
| 2124 Key West Ln | 0.38mi | 3/2.0 | 1,620 (-10%) | 1mo | $337,000 | $208 | 64 |
Match score weights: distance 35% · size 25% · config 20% · recency 20%. Top-matched comps best support the ARV.
Projected returns pro-forma
-3.0% appreciation · 2.25% rent growth · sell at horizon
- IRR
- 9.0%
- Equity multiple
- 1.35×
- Total profit
- $9,270
- Equity at exit
- $14,165
- IRR
- 17.3%
- Equity multiple
- 2.37×
- Total profit
- $36,329
- Equity at exit
- $8,214
Cash invested: $26,600 (down + closing). Projections, not guarantees.
Landlord ↔ Tenant lean methodology
- Overall (STATE)
- 18 Strongly Tenant-Friendly
- State California
- 18 Strongly Tenant-Friendly · D+13
- County
- — inherits STATE
- City
- — inherits STATE
ZIP-level market 95350
- Rents YoY
- 2.2%
- Active inventory
- 161
- Price-to-rent
- 3.2×
Monthly cashflow live
- Estimated rent
- $2,505 high interval (Pro) →
- Mortgage (P&I)
- −$498
- Tax est. 1.5%
- −$119 /mo · $1,425/yr
- Insurance
- −$40
- HOA
- −$915
- Vacancy / Maint / Mgmt
- −$526
- Net cashflow
- $407
Break-even live
UW: 25.0% down · 7.5% · 30yr · 1.5% tax · 5.0% vac · 8.0% maint · 8.0% mgmt
Financing live
Cash to close
- Down payment
- $23,750
- Closing costs
- $2,850
- Reserves months
- —
- Total cash needed
- —
Loan-product check · same deal, 3 products live
Conventional
25% down · 7.5% · 30yr
- Down + closing
- —
- Monthly P&I
- —
- Monthly cashflow
- —
- DSCR
- —
- Eligible?
- —
Personal DTI + credit; lowest rate.
DSCR
20% down · 8.5% · 30yr
- Down + closing
- —
- Monthly P&I
- —
- Monthly cashflow
- —
- DSCR
- —
- Eligible?
- —
No personal income docs; deal must DSCR.
Hard money
10% down · 12.0% · 12mo
- Down + closing
- —
- Monthly P&I
- —
- Monthly cashflow
- —
- DSCR
- —
- Eligible?
- —
Short-term bridge; refi at stabilization.
Rent comps 9 comps
| Address | Beds | Baths | Sqft | Rent | $/sqft | DOM | Units | Dist |
|---|---|---|---|---|---|---|---|---|
| 3200 Hahn Dr Modesto, CA | 2.0–3.0 | 2.0–2.5 | 1262 | $2,631 | $2.08 | 3d | 5 | 0.80mi |
| 1809 La Corunna Pl Modesto, CA | 2.0 | 3.0 | 1300 | $2,100 | $1.62 | 14d | 1 | 0.82mi |
| 3904 Breda Ct Modesto, CA | 3.0 | 2.0 | 1680 | $2,400 | $1.43 | 21d | 1 | 1.14mi |
| 3830 Carver Rd Modesto, CA | 4.0 | 3.0 | 2077 | $2,950 | $1.42 | 23d | 1 | 1.16mi |
| 1701 Linwood Dr Modesto, CA | 3.0 | 2.0 | 1499 | $2,050 | $1.37 | 14d | 1 | 1.16mi |
| 2704 Snyder Ave Modesto, CA | 3.0 | 2.0 | 1806 | $2,495 | $1.38 | 11d | 1 | 1.29mi |
| 1836 Brahms Way Modesto, CA | 4.0 | 2.0 | 1640 | $2,645 | $1.61 | 23d | 1 | 1.36mi |
| 1836 Brahms Way Modesto, CA | 4.0 | 2.0 | 1640 | $2,645 | $1.61 | 14d | 1 | 1.36mi |
| 3620 Historic Ct Modesto, CA | 3.0 | 2.0 | 1569 | $2,800 | $1.78 | 11d | 1 | 1.41mi |
HOA detail
- Monthly dues
- $915 · $10,980/yr
- Likely covers
- poolgym
Listing history 16 events
-
2026-06-18days on market $95,000 Active 20 DOM
-
2026-06-17days on market $95,000 Active 19 DOM
-
2026-06-16days on market $95,000 Active 18 DOM
-
2026-06-15days on market $95,000 Active 17 DOM
-
2026-06-14days on market $95,000 Active 15 DOM
-
2026-06-13days on market $95,000 Active 14 DOM
-
2026-06-10days on market $95,000 Active 12 DOM
-
2026-06-09days on market $95,000 Active 11 DOM
-
2026-06-08days on market $95,000 Active 10 DOM
-
2026-06-07days on market $95,000 Active 9 DOM
-
2026-06-03days on market $95,000 Active 5 DOM
-
2026-06-02days on market $95,000 Active 4 DOM
-
2026-06-01days on market $95,000 Active 3 DOM
-
2026-05-31days on market $95,000 Active 2 DOM
-
2026-05-30remarks 699-char remark
-
2026-05-30$95,000 Active 1 DOM
ⓘ Source: listings_history table (triggers on properties + properties_extension) + one-shot
backfill from property_details.listing_events for pre-trigger history.
Climate risk First Street
- Flood 1/10 Low FEMA zone X (unshaded) · 0% chance over 30 yrs
- Wildfire 5/10 Major
- Heat 6/10 Major 7 d/yr ≥102°F today · 15 d/yr by 30 yrs out
- Wind 1/10 Low
- Air quality 10/10 Extreme 28 unhealthy d/yr today · 32 by 30 yrs out
Nearby sold comps map
Loading sold comps map…
Walkable amenities ~0.75 mi
Loading nearby amenities…
Taxation est. · year 1
- Rental income
- $30,058
- − Mortgage interest
- −$5,321
- − Property taxes
- −$1,425
- − Insurance
- −$475
- − Repairs & maintenance
- −$2,405
- − Management
- −$2,405
- − HOA
- −$10,980
- − Depreciation
- −$2,764
- Taxable income
- $4,283
- Est. tax owed @ 24.0%
- −$1,028
- After-tax cash flow
- $3,859/yr
For passive investors: Depreciation is non-cash, so a rental often shows a tax loss while cash-flowing — sheltering income. Rental losses are passive: they offset passive income freely, and up to $25,000/yr can offset ordinary (W-2) income if you actively participate and your MAGI is under $100k (phasing out to $0 by $150k); unused losses carry forward. On sale, claimed depreciation is recaptured at up to 25%, and gains may owe capital-gains tax (a 1031 exchange can defer both). Figures are a year-1 estimate at your 24.0% rate — not tax advice; consult a CPA.
Schools (NCES district)
- District
- Stanislaus Union Elementary
- NCES district ID
- 0637950
- Math proficiency
- 24% ▼ -14.00%
- Reading proficiency
- 35% ▼ -12.00%
- Median HH income
- $53,731
- Composite
- 26.11/100
- National rank
- #7286
- State rank
- #344 of 517 in CA
Livability — Modesto
- Score
- 63/100
- State rank
- #451
- US rank
- #15229
Category grades
Schools grade is shown separately in the Schools card above.
Census & demographics
- Census place
- Modesto, CA
- County
- Stanislaus County · 445,786 people
- City population
- 225,261
- Metro
- Modesto, CA
- Population (ZIP)
- 57,136
- Household income
- $75,621
- Rent vs Own
- Severe rent burden
- 2163.0
Population outlook (Stanislaus County) Hauer SSP2
- Today (2025)
- 579,493 people
- By 2030
- 598,000 · +3.2%
- By 2040
- 630,930 · +8.9%
- By 2050
- 658,300 · +13.6%
- By 2075
- 712,363 · +22.9%
- By 2100
- 719,805 · +24.2%
Race, ethnicity, and origin ACS 2023
- Neighborhood character
- Diverse neighborhood (Simpson 0.64)
- Race & ethnicity
- White 45% Hispanic / Latino 39% Two or more races 19% Asian 6% Black 5% Native American 2%
- Hispanic origin (detail)
- Mexican 35%
- Common ancestry
- Russian 3% Slovak 2% Portuguese 1%
- Foreign-born
- 14% · Canada, Vietnam
- Languages at home
- 70% English-only · Spanish 23% Other Indo-European 3% Other Asian/Pacific 1%
Political lean MEDSL · Stanislaus
- 2024 margin
- R (+11.0) · D 43.2% · R 54.2% · Other 2.6%
- 2008→2024 swing
- -12.7pp toward R · 2008: 1.7pp · 2024: -11.0pp
- All cycles
- 2024: R+11.0 2020: D+0.8 2016: D+0.6 2012: D+0.7 2008: D+1.7
Not yet ingested
- Civics
- —
Market trends
- HPI YoY
- ▼ -555.05%
- Current HPI
- 307.9532
- Rent YoY
- ▲ 2.25%
- Metro
- Modesto, CA
- State GDP YoY
- ▲ 3.21%
- F500 in state
- 116
Industry mix (Fortune 500 HQ in CA)
| Industry | F500 HQs | Revenue |
|---|---|---|
| Technology | 27 | $1,492B |
|
||
| Financial Services | 3 | $174B |
|
||
| Retail | 3 | $44B |
|
||
| Insurance | 3 | $26B |
|
||
| Media / Entertainment | 2 | $115B |
|
||
| Pharmaceuticals / Biotech | 2 | $62B |
|
||
Price history
1 event — show timeline
- 2026-05-29 Listed $95,000 BAREIS
Cash-flow waterfall
monthlySold comps — $/sqft
last 12 mo · ≤1 miLoading sold comps…