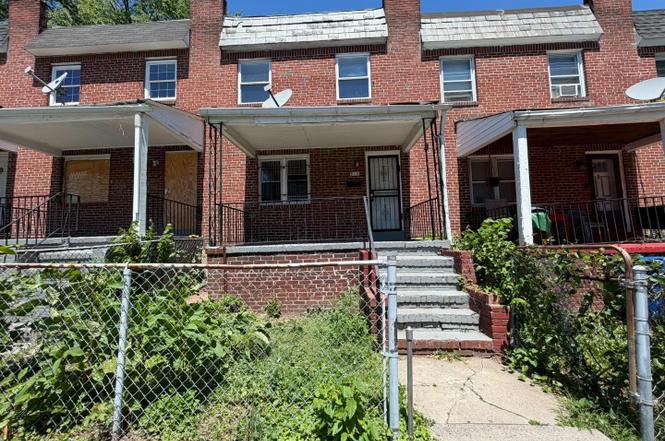
512 Sheridan Ave · Baltimore, MD
Flood risk 1/10 · Minimal
- FEMA flood zone
- X (unshaded)
- Chance of flooding over 30 yrs
- 0.0%
- Est. flood insurance / yr
- $473 – $860
Fire risk 1/10 · Minimal
- Est. fire insurance / yr
- $755 – $1,403
Heat risk 7/10 · Major
- Hot days now (above 103°F)
- 7 days/yr
- Hot days in 30 yrs
- 15 days/yr
Wind risk 6/10 · Moderate
- Chance of severe wind over 30 yrs
- 27.0%
Air-quality risk 4/10 · Minor
- Unhealthy air days now
- 3 days/yr
- Unhealthy air days in 30 yrs
- 6 days/yr
Risk factors via First Street. Map © Google.
Why this score? — see what drove the B+ grade
The composite is a weighted blend of 9 inputs, each scored 0–100. Each bar is that input's sub-score; the figure is the points it added to the 100-point composite (weight × sub-score).
- Cash flow +30.0/30.0
- ARV discount +15.0/15.0
- 1% rule +10.0/10.0
- DSCR +10.0/10.0
- Livability +3.8/5.0
- Rent growth +3.7/5.0
- Condition / age +2.5/5.0
- Schools +1.0/10.0
- Appreciation +0.0/10.0
$89,900
🖨 Deal sheet 📄 Offer letter ✓ Due diligence
Listing remarks MLS
ESTATE SALE NEEDS TLC, LOCATED NEAR BELVEDERE SQUARE , AND SENATOR THEATER
Key facts
- Separate dining room
- Fenced backyard
- Built 1937
Tags
Property features AI
Exterior
- Parking: Off-street parking
- Utilities: Natural gas service; Public water; Public sewer
- Home design: Interior townhouse/rowhouse; Fee simple ownership
- Construction: Brick construction; Permanent foundation; Year built per assessor
- Exterior features: Not located on tidal water; Above-grade and below-grade structures noted
Interior
- Bedrooms: Three bedrooms on the upper level
- Bathrooms: Two full bathrooms (one on main level, one on the upper level)
- Heating & cooling: Radiator heating; Natural gas hot water
- Interior features: Full basement, partially finished; Living area per assessor
Neighborhood map
What this means for you Summary
Snapshot
- This is a 3-bed/2.0-bath townhouse listed at $90k.
Deal economics
- At list price, monthly cash flow is $617 ($7k/yr) — positive.
- The deal already cash-flows at list — no discount required.
- Meets the 1% rule at list price ($2k rent vs $90k).
- Cap rate 14.5% vs local median 6.0% in Baltimore — top-decile yield for the area; either an underpriced asset or a hidden risk that comps aren't pricing in. Stress-test before assuming the spread holds.
Location & tenants
- Location reads 76/100 on livability (#90 in MD, #3,396 nationally) — a middle-class / working-renter tenant base. Strengths: amenities A+, commute A+, housing A+; Watch: schools D, crime F.
- Baltimore City Public Schools (urban): math 7% / reading 16% proficiency, ranked #24 of 24 in MD (top 100%) — low school quality limits family demand, transient renter base, plan for 1-2y turnover; 79% free/reduced lunch — lower-income household profile, screen leases tightly.
- Market conditions: Rents rising fast (+4.7%/yr); 133 active listings in the ZIP; 40 comparable units currently listed for rent nearby; rentals at typical pace (median 24d on market — plan ~3-4 weeks tenant-placement turnaround); 40% of comp listings sitting > 30 days — soft ceiling on asking rent; solid renter incomes; 1,273 units permitted in Baltimore city in 2024 (1,104 in 5+ unit buildings).
Forward outlook
- Local home prices are declining (-3.0%/yr); year-one equity from $622 of loan paydown is wiped out by about $3k of value loss. Plan a longer hold.
- Baltimore County population projected to shrink 4% by 2050 — rents likely to lag national; underwrite the cash flow, not the appreciation.
- At projected returns (-3.0% appreciation + 4.7% rent growth), your $25k cash investment doubles in ~4 years — after that, you're playing with house money.
Negotiation context
- Only 8 days on market — expect competitive offers; lowballing is unlikely to land.
- 3 sale attempts since 12y ago with the ask held roughly flat each time — persistent listings suggest the price (not the market) is what's stuck; bring a comps-based counter.
Risks & watch-outs
- Watch-outs: property tax is 3.4% of price; built in 1937 — expect roof / HVAC / electrical / plumbing capex.
- Climate carrying-cost: major wind risk, 27% chance of damaging wind over 30y; extreme-heat days projected 7→15/yr by 2055 (HVAC capex compounding) — expect insurance premiums to compound above CPI over the hold.
Questions for the listing agent
- Built in 1937 — when were the roof, HVAC, electrical panel, plumbing, and water heater last replaced?
- Property tax is high relative to price — has the assessment been appealed recently, and will the sale trigger a re-assessment?
- Is there a deadline driving the sale (1031 exchange, divorce, estate, relocation)? That informs how much negotiation room exists.
- Schools are D-rated, which usually means shorter tenancies and higher turnover. Who's the typical renter profile here, and what's been the actual vacancy rate?
- Crime grade is F in this area — have there been break-ins, vandalism, or insurance claims at this property in the last 3 years? What carrier currently insures it and at what premium?
- What's the average days-on-market for RENTAL listings here right now (not sales)? A rising rental-DOM trend means longer vacancies and softer asking-rent achievability than the comps imply.
- What's the recent tenant-quality profile in this submarket — average credit score on applications, eviction rate, late-payment / NSF rate, and stable-employment percentage? A property-management company in the area should have these aggregated.
- How much new for-sale + rental construction is in the pipeline within 1–3 miles? Heavy new supply typically softens prices + rents 12–24 months out; constrained supply supports both.
Investment metrics
- 1% rule
- 1.95% ✓
- Cap rate
- 14.53%
- Cash-on-cash
- 29.43%
- DSCR
- 2.31
- GRM
- 4.3
CMA / ARV
- ARV (on-the-fly)
- $176,256
- Comps found
- 12
Show comp detail 12 sales within ~0.75 mi
| Address | Dist | Beds/Ba | Sqft | Sold | Price | $/sf | Match |
|---|---|---|---|---|---|---|---|
| 324 Woodbourne Ave | 0.12mi | 3/2.0 | 1,280 (+5%) | 4mo | $286,425 | $224 | 83 |
| 5627 Ready Ave | 0.27mi | 3/2.0 | 1,186 (-3%) | 3mo | $95,400 | $80 | 80 |
| 800 Radnor Ave | 0.56mi | 3/1.5 | 1,224 (0%) | 2mo | $99,900 | $82 | 70 |
| 812 Mccabe Ave | 0.31mi | 3/1.0 | 1,080 (-12%) | 1mo | $150,000 | $139 | 60 |
| 380 Homeland Southway Unit 3A | 0.29mi | 2/2.0 (-1) | 1,066 (-13%) | 3mo | $225,000 | $211 | 57 |
| 355 Homeland Southway Unit 2B | 0.28mi | 2/1.5 (-1) | 1,043 (-15%) | 0mo | $205,000 | $197 | 55 |
| 365 Homeland Southway Unit 2B | 0.32mi | 2/2.0 (-1) | 1,061 (-13%) | 4mo | $240,000 | $226 | 54 |
| 912 Evesham Ave | 0.65mi | 3/2.0 | 1,352 (+10%) | 2mo | $224,900 | $166 | 51 |
| 830 Saint Dunstans Rd | 0.54mi | 3/1.0 | 1,394 (+14%) | 1mo | $161,000 | $115 | 47 |
| 4415 Old York Rd | 0.75mi | 3/2.0 | 1,356 (+11%) | 3mo | $172,000 | $127 | 44 |
| 4437 Old York Rd | 0.71mi | 3/1.0 | 1,356 (+11%) | 4mo | $118,250 | $87 | 42 |
| 1200 Woodbourne Ave | 0.61mi | 4/3.0 (+1) | 1,364 (+11%) | 2mo | $196,100 | $144 | 42 |
Match score weights: distance 35% · size 25% · config 20% · recency 20%. Top-matched comps best support the ARV.
Projected returns pro-forma
-3.0% appreciation · 4.65% rent growth · sell at horizon
- IRR
- 26.0%
- Equity multiple
- 2.10×
- Total profit
- $27,814
- Equity at exit
- $13,404
- IRR
- 34.8%
- Equity multiple
- 4.49×
- Total profit
- $87,833
- Equity at exit
- $7,773
Cash invested: $25,172 (down + closing). Projections, not guarantees.
Landlord ↔ Tenant lean methodology
- Overall (CITY)
- 12 Strongly Tenant-Friendly
- State Maryland
- 27 Tenant-Leaning · D+14
- County
- — inherits STATE
- City Baltimore
- 12 Strongly Tenant-Friendly · D+58
ZIP-level market 21212
- Rents YoY
- 4.7%
- Active inventory
- 133
- Price-to-rent
- 4.3×
Monthly cashflow live
- Estimated rent
- $1,749 high interval (Pro) →
- Mortgage (P&I)
- −$471
- Tax from tax record
- −$255 /mo · $3,063/yr
- Insurance
- −$37
- HOA
- −$0
- Vacancy / Maint / Mgmt
- −$367
- Net cashflow
- $617
Break-even live
UW: 25.0% down · 7.5% · 30yr · 1.5% tax · 5.0% vac · 8.0% maint · 8.0% mgmt
Financing live
Cash to close
- Down payment
- $22,475
- Closing costs
- $2,697
- Reserves months
- —
- Total cash needed
- —
Loan-product check · same deal, 3 products live
Conventional
25% down · 7.5% · 30yr
- Down + closing
- —
- Monthly P&I
- —
- Monthly cashflow
- —
- DSCR
- —
- Eligible?
- —
Personal DTI + credit; lowest rate.
DSCR
20% down · 8.5% · 30yr
- Down + closing
- —
- Monthly P&I
- —
- Monthly cashflow
- —
- DSCR
- —
- Eligible?
- —
No personal income docs; deal must DSCR.
Hard money
10% down · 12.0% · 12mo
- Down + closing
- —
- Monthly P&I
- —
- Monthly cashflow
- —
- DSCR
- —
- Eligible?
- —
Short-term bridge; refi at stabilization.
Rent comps 40 comps
| Address | Beds | Baths | Sqft | Rent | $/sqft | DOM | Units | Dist |
|---|---|---|---|---|---|---|---|---|
| 5307 York Rd Baltimore, MD | 2.0 | 1.0 | 1120 | $1,200 | $1.07 | 43d | 1 | 0.06mi |
| 5200 Ready Ave Baltimore, MD | 3.0 | 1.5 | 1116 | $1,950 | $1.75 | 3d | 1 | 0.14mi |
| 711 1/2 McCabe Ave Baltimore, MD | 4.0 | 3.0 | 1204 | $2,350 | $1.95 | 4d | 1 | 0.23mi |
| 543 Chateau Ave Baltimore, MD | 3.0 | 2.0 | 1152 | $1,900 | $1.65 | 4d | 1 | 0.31mi |
| 416 Winston Ave Unit 426-01 Baltimore, MD | 2.0 | 1.0 | 890 | $1,250 | $1.40 | 43d | 1 | 0.36mi |
| 416 Winston Ave Unit 426-08 Baltimore, MD | 2.0 | 1.0 | 790 | $1,050 | $1.33 | 24d | 1 | 0.36mi |
| 818 Bradhurst Rd Baltimore, MD | 2.0 | 1.0 | 1216 | $1,250 | $1.03 | 43d | 1 | 0.38mi |
| 818 Bradhurst Rd Baltimore, MD | 2.0 | 1.0 | 1216 | $1,350 | $1.11 | 3d | 1 | 0.38mi |
| 5618 Midwood Ave Unit 1 Baltimore, MD | 2.0 | 1.0 | 800 | $1,250 | $1.56 | 24d | 1 | 0.49mi |
| 5622 Midwood Ave Baltimore, MD | 3.0 | 2.0 | 1452 | $2,300 | $1.58 | 43d | 1 | 0.49mi |
| 5626 Midwood Ave Unit 2 Baltimore, MD | 2.0 | 1.0 | 1452 | $1,100 | $0.76 | 24d | 1 | 0.49mi |
| 1006 Cameron Rd Baltimore, MD | 2.0 | 1.0 | 1032 | $950 | $0.92 | 43d | 1 | 0.50mi |
| 5001 Midwood Ave Apt 2A Baltimore, MD | 2.0 | 1.0 | 750 | $1,265 | $1.69 | 43d | 1 | 0.54mi |
| 1090 Cameron Rd Baltimore, MD | 2.0 | 1.0 | 832 | $1,675 | $2.01 | 3d | 1 | 0.63mi |
| 1221 Glenwood Ave Baltimore, MD | 3.0 | 2.0 | 1390 | $2,595 | $1.87 | 43d | 1 | 0.64mi |
| 917 Reverdy Rd Unit A Baltimore, MD | 3.0 | 1.0 | 1200 | $2,100 | $1.75 | 43d | 1 | 0.67mi |
| 531 Willow Ave Unit Na Baltimore, MD | 4.0 | 1.0 | 1300 | $1,800 | $1.38 | 20d | 1 | 0.71mi |
| 1224 Winston Ave Baltimore, MD | 3.0 | 2.0 | 1248 | $2,100 | $1.68 | 18d | 1 | 0.71mi |
| 835 E Cold Spring Ln Baltimore, MD | 2.0 | 1.5 | 997 | $1,400 | $1.40 | 24d | 1 | 0.72mi |
| 1275 Kitmore Rd Unit 1215B-T Baltimore, MD | 2.0 | 1.0 | 811 | $1,435 | $1.77 | 4d | 1 | 0.73mi |
| 1275 Kitmore Rd Unit 1248B-A Baltimore, MD | 2.0 | 1.0 | 812 | $1,360 | $1.67 | 4d | 1 | 0.73mi |
| 1275 Kitmore Rd Unit 1245K-T Baltimore, MD | 3.0 | 1.0 | 935 | $1,895 | $2.03 | 4d | 1 | 0.73mi |
| 1275 Kitmore Rd Unit 1267K-T Baltimore, MD | 2.0 | 1.0 | 827 | $1,585 | $1.92 | 43d | 1 | 0.73mi |
| 1275 Kitmore Rd Baltimore, MD | 2.0 | 1.0 | 827 | $1,525 | $1.84 | 43d | 1 | 0.73mi |
| 1275 Kitmore Rd Unit 1276B-A Baltimore, MD | 2.0 | 1.0 | 812 | $1,360 | $1.67 | 43d | 1 | 0.73mi |
| 1275 Kitmore Rd Unit 1221B-T Baltimore, MD | 2.0 | 1.0 | 811 | $1,560 | $1.92 | 24d | 1 | 0.73mi |
| 1275 Kitmore Rd Unit 1262B-A Baltimore, MD | 2.0 | 1.0 | 923 | $1,320 | $1.43 | 2d | 1 | 0.73mi |
| 1275 Kitmore Rd Unit 1259K-T Baltimore, MD | 2.0 | 1.0 | 811 | $1,535 | $1.89 | 4d | 1 | 0.73mi |
| 1275 Kitmore Rd Unit 1263K-T Baltimore, MD | 2.0 | 1.0 | 811 | $1,485 | $1.83 | 4d | 1 | 0.73mi |
| 1275 Kitmore Rd Unit 1260K-T Baltimore, MD | 2.0 | 1.0 | 811 | $1,410 | $1.74 | 4d | 1 | 0.73mi |
| 1260 Rossiter Ave Baltimore, MD | 2.0 | 1.0 | 710 | $1,250 | $1.76 | 1d | 37 | 0.78mi |
| 4407 Old York Rd Baltimore, MD | 3.0 | 1.5 | 1356 | $1,574 | $1.16 | 20d | 1 | 0.78mi |
| 4407 Old York Rd Baltimore, MD | 3.0 | 1.5 | 1356 | $1,574 | $1.16 | 43d | 1 | 0.78mi |
| 1020 Dartmouth Glen Way Baltimore, MD | 3.0 | 2.5 | 1152 | $2,250 | $1.95 | 24d | 1 | 0.86mi |
| 1111 Gleneagle Rd Unit 2 Baltimore, MD | 2.0 | 1.0 | 1452 | $1,050 | $0.72 | 43d | 1 | 0.93mi |
| 1106 Gleneagle Rd Unit 2 Baltimore, MD | 2.0 | 1.0 | 1100 | $1,450 | $1.32 | 43d | 1 | 0.94mi |
| 720 Springfield Ave Baltimore, MD | 3.0 | 1.0 | 1160 | $2,000 | $1.72 | 43d | 1 | 0.95mi |
| 1116 Gleneagle Rd Unit 2 Baltimore, MD | 2.0 | 1.0 | 876 | $1,750 | $2.00 | 43d | 1 | 0.96mi |
| 1116 Gleneagle Rd Unit 2 Baltimore, MD | 2.0 | 1.0 | 726 | $1,750 | $2.41 | 24d | 1 | 0.96mi |
| 1116 Gleneagle Rd Unit 1 Baltimore, MD | 2.0 | 1.0 | 726 | $1,695 | $2.33 | 4d | 1 | 0.96mi |
Listing history 6 events
-
2026-06-18days on market $89,900 Active 8 DOM
-
2026-06-17days on market $89,900 Active 7 DOM
-
2026-06-16days on market $89,900 Active 6 DOM
-
2026-06-15days on market $89,900 Active 5 DOM
-
2026-06-13remarks 693-char remark
-
2026-06-13$89,900 Active 3 DOM
ⓘ Source: listings_history table (triggers on properties + properties_extension) + one-shot
backfill from property_details.listing_events for pre-trigger history.
Tax reassessment forecast MD · Partial reset (capped growth)
- Current annual tax
- $3,063 · $255/mo
- Projected year-2 tax
- $3,063 · $255/mo
- Expected delta
- $0/yr ($0/mo · 0.0%)
ⓘ Screening estimate from a state-policy table — verify with the county assessor before closing.
Climate risk First Street
- Flood 1/10 Low FEMA zone X (unshaded) · 0% chance over 30 yrs
- Wildfire 1/10 Low
- Heat 7/10 Severe 7 d/yr ≥103°F today · 15 d/yr by 30 yrs out
- Wind 6/10 Major 27% chance of damaging wind over 30 yrs
- Air quality 4/10 Moderate 3 unhealthy d/yr today · 6 by 30 yrs out
Nearby sold comps map
Loading sold comps map…
Walkable amenities ~0.75 mi
Loading nearby amenities…
Taxation est. · year 1
- Rental income
- $20,984
- − Mortgage interest
- −$5,036
- − Property taxes
- −$3,063
- − Insurance
- −$450
- − Repairs & maintenance
- −$1,679
- − Management
- −$1,679
- − Depreciation
- −$2,615
- Taxable income
- $6,463
- Est. tax owed @ 24.0%
- −$1,551
- After-tax cash flow
- $5,857/yr
For passive investors: Depreciation is non-cash, so a rental often shows a tax loss while cash-flowing — sheltering income. Rental losses are passive: they offset passive income freely, and up to $25,000/yr can offset ordinary (W-2) income if you actively participate and your MAGI is under $100k (phasing out to $0 by $150k); unused losses carry forward. On sale, claimed depreciation is recaptured at up to 25%, and gains may owe capital-gains tax (a 1031 exchange can defer both). Figures are a year-1 estimate at your 24.0% rate — not tax advice; consult a CPA.
Schools (NCES district)
- District
- Baltimore City Public Schools
- NCES district ID
- 2400090
- Math proficiency
- 7% ▼ -9.00%
- Reading proficiency
- 16% ▼ -5.00%
- Median HH income
- $42,108
- Composite
- 10.08/100
- National rank
- #9805
- State rank
- #24 of 24 in MD
Livability — Baltimore
- Score
- 76/100
- State rank
- #90
- US rank
- #3396
Category grades
Schools grade is shown separately in the Schools card above.
Census & demographics
- Census place
- Baltimore, MD
- County
- Baltimore City · 558,601 people
- City population
- 588,727
- Metro
- Baltimore-Columbia-Towson, MD
- Population (ZIP)
- 33,974
- Household income
- $96,685
- Rent vs Own
- Severe rent burden
- 769.0
Population outlook (Baltimore County) Hauer SSP2
- Today (2025)
- 624,249 people
- By 2030
- 621,541 · -0.4%
- By 2040
- 609,756 · -2.3%
- By 2050
- 597,249 · -4.3%
- By 2075
- 552,236 · -11.5%
- By 2100
- 513,934 · -17.7%
Race, ethnicity, and origin ACS 2023
- Neighborhood character
- Diverse neighborhood (Simpson 0.64)
- Race & ethnicity
- White 49% Black 35% Two or more races 9% Hispanic / Latino 7% Asian 4%
- Hispanic origin (detail)
- Mexican 1% Puerto Rican 1%
- Common ancestry
- Romanian 3% Italian 2% Slovak 2%
- Foreign-born
- 9% · Canada, China
- Languages at home
- 87% English-only · Spanish 5% Other Indo-European 2% French/Haitian/Cajun 1%
Political lean MEDSL · Baltimore
- 2024 margin
- Solid D (+73.0) · D 85.2% · R 12.2% · Other 2.6%
- 2008→2024 swing
- -2.5pp toward R · 2008: 75.5pp · 2024: 73.0pp
- All cycles
- 2024: D+73.0 2020: D+76.6 2016: D+74.6 2012: D+76.4 2008: D+75.5
Not yet ingested
- Civics
- —
Market trends
- HPI YoY
- ▼ -392.44%
- Current HPI
- 267.4569
- Rent YoY
- ▲ 4.65%
- Metro
- Baltimore-Columbia-Towson, MD
- State GDP YoY
- ▲ 2.97%
- F500 in state
- 12
Industry mix (Fortune 500 HQ in MD)
| Industry | F500 HQs | Revenue |
|---|---|---|
| Aerospace / Defense | 1 | $71B |
|
||
| Utilities | 1 | $25B |
|
||
| Hotels | 1 | $24B |
|
||
| Consumer Goods | 1 | $7B |
|
||
| Real Estate | 1 | $6B |
|
||
| Chemicals | 1 | $2B |
|
||
Price history
+261.0% since first listed9 events — show timeline
- 2026-06-10 Listed $89,900 BRIGHT MLS
- 2023-04-14 Sold (Public Records) $220,000 Public Records
- 2014-12-05 Sold (MLS) $17,000 BRIGHT MLS
- 2014-12-05 Sold (MLS) $17,000 MRIS
- 2014-11-06 Pending — MRIS
- 2014-11-01 Listing Removed — BRIGHT MLS
- 2014-10-06 Price Changed $24,900 MRIS
- 2014-08-25 Listed $29,900 MRIS
- 2014-08-25 Listed $24,900 BRIGHT MLS
Property tax history
+3.5%/yrLatest (2025): $3,063 · +40.4% YoY. Source: county tax records.
Cash-flow waterfall
monthlySold comps — $/sqft
last 12 mo · ≤1 miLoading sold comps…