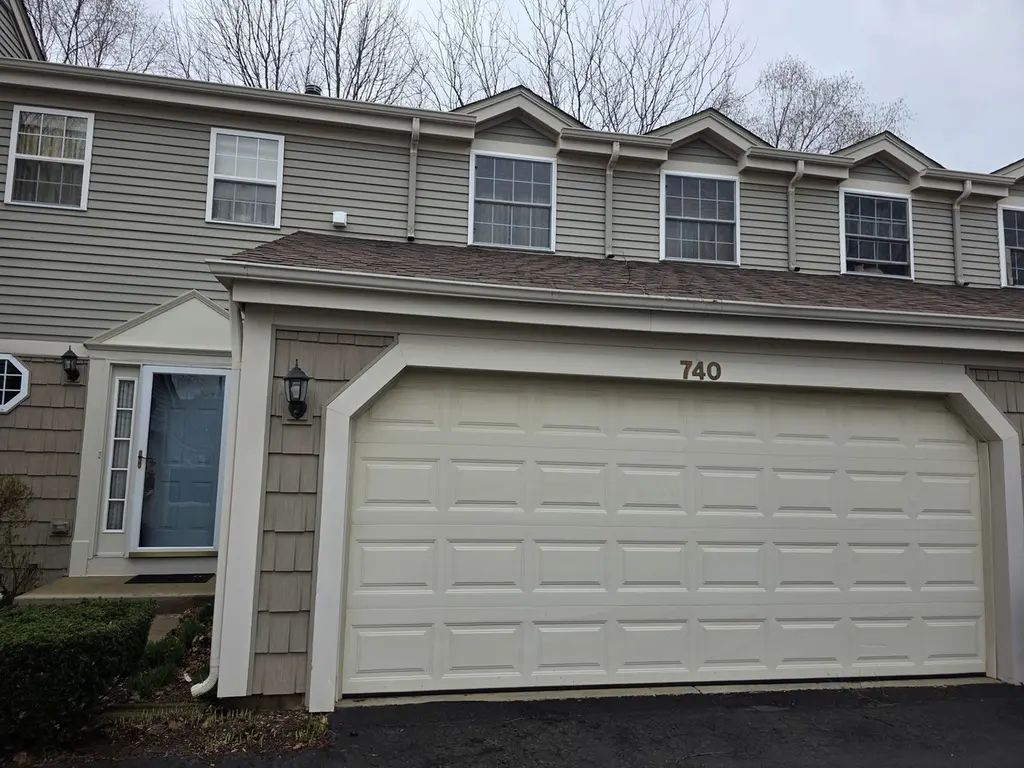
740 Village Cir · Marengo, IL
Flood risk 1/10 · Minimal
- FEMA flood zone
- X (unshaded)
- Chance of flooding over 30 yrs
- 0.0%
- Est. flood insurance / yr
- $473 – $860
Fire risk 1/10 · Minimal
- Est. fire insurance / yr
- $804 – $1,492
Heat risk 3/10 · Minor
- Hot days now (above 102°F)
- 7 days/yr
- Hot days in 30 yrs
- 14 days/yr
Wind risk 2/10 · Minimal
- Chance of severe wind over 30 yrs
- 0.0%
Air-quality risk 1/10 · Minimal
- Unhealthy air days now
- 0 days/yr
- Unhealthy air days in 30 yrs
- 0 days/yr
Risk factors via First Street. Map © Google.
Why this score? — see what drove the D grade
The composite is a weighted blend of 9 inputs, each scored 0–100. Each bar is that input's sub-score; the figure is the points it added to the 100-point composite (weight × sub-score).
- Cash flow +12.2/30.0
- ARV discount +9.8/15.0
- 1% rule +5.2/10.0
- Schools +4.0/10.0
- DSCR +3.6/10.0
- Livability +3.2/5.0
- Rent growth +2.5/5.0
- Condition / age +2.5/5.0
- Appreciation +0.0/10.0
$219,000
🖨 Deal sheet (PDF) 📄 Offer letter ✓ Due diligence
Listing remarks
2 story townhouse with 3 bedrooms, 2.5 baths, second floor laundry, attached garage. Great location! All appliances included. Patio out back with sliding doors from livingroom. All bedrooms on second floor. Primary suite has great closet space and private full bath. Second floor laundry. 1/2 bath on main level. Bring your decorating ideas and talents! Home to be sold AS IS.
Key facts
- $160 HOA
- 2 garage spots
- Built 2001
Property features AI
Finance
- Other: Ownership: Fee simple with homeowners association; Living area based on assessor records; Total finished/unfinished area reported
- HOA & community: Monthly association fee of $160; Association covers insurance, lawn care, and snow removal; Pets allowed (cats and dogs permitted)
Exterior
- Parking: 2 total parking spaces; Attached garage with garage door opener; Asphalt shared driveway; Garage owned
- Utilities: Public water; Public sewer; Electric service: 100 amp with circuit breakers
- Home design: Attached single property; Townhouse — 2 story; Entry level: 1; Approximately 21–25 years old
- Construction: Vinyl siding and brick exterior; Asphalt roof; Concrete perimeter foundation; Built before 1978: No
- Exterior features: Patio; Lot dimensions approx. 107 x 28 x 71 x 34 x 34
Interior
- Kitchen: Range; Microwave; Dishwasher; Refrigerator; Disposal; Water softener
- Bedrooms: 3 bedrooms (Master bedroom on second level); Bedroom 2 on second level (12 x 10); Bedroom 3 on second level (10 x 10)
- Flooring: Carpet in living areas and bedrooms; Tile in kitchen and laundry
- Bathrooms: 2 full bathrooms; 1 half bathroom
- Heating & cooling: Natural gas forced air heating; Central air conditioning
- Interior features: 5 total rooms; Unfinished full basement; School bus service
- Laundry & utility: In-unit laundry (second level, 5 x 5); Washer; Dryer
Neighborhood map
What this means for you Summary
Snapshot
- This is a 3-bed/2.5-bath townhouse listed at $219k.
Deal economics
- At list price, monthly cash flow is $-45 ($-543/yr) — negative.
- To cash-flow at today's rent, offer at most $211k (3.6% below list).
- Meets the 1% rule at list price ($2k rent vs $219k).
- Recommended offer: $211k (3.6% below list) — sets the bar for cash-flow.
- Cap rate 6.0% vs local median 4.2% in Marengo — top-decile yield for the area; either an underpriced asset or a hidden risk that comps aren't pricing in. Stress-test before assuming the spread holds.
Location & tenants
- Location reads 64/100 on livability (#708 in IL) — a middle-class / working-renter tenant base. Strengths: crime A+, cost of living A+, housing A+; Watch: amenities F, commute F, health & safety F.
- Marengo Chsd 154 (town): math 40% / reading 45% proficiency, ranked #240 of 919 in IL (top 26%) — families likely to look elsewhere, expect single-tenant / working-renter base with shorter leases.
- Zoned schools: Locust Elem School (math 47% / reading 32%, grade F, #392 of 2,056 statewide, top 21%, 535 students, 0% FRL); Marengo Comm Middle School (math 25% / reading 31%, grade F, #284 of 665 statewide, top 44%, 307 students, 0% FRL); Marengo High School (math 37% / reading 37%, grade F, #107 of 693 statewide, top 17%, 685 students, 0% FRL).
- Market conditions: 64 active listings in the ZIP; 6 comparable units currently listed for rent nearby; rentals leasing fast (median 4d on market — plan ~1-2 weeks tenant-placement turnaround); 1,595 units permitted in McHenry County in 2024 (485 in 5+ unit buildings).
Forward outlook
- Local home prices are declining (-3.0%/yr); year-one equity from $2k of loan paydown is wiped out by about $7k of value loss. Plan a longer hold.
- McHenry County population projected at -12% by 2050 — secular population decline; favor cash flow + early exit over multi-decade hold.
Negotiation context
- It's been on market 42 days — a 3% lower offer ($212k) is reasonable based on typical stale-listing flexibility.
- Current owner paid $136k; list at $219k implies a 62% gain — meaningful room to come down on a strong offer.
Questions for the listing agent
- What do current leases actually rent for vs. the listed asking? Can we see a recent rent roll and the last 12 months of T-12 income?
- It's been on market 42 days. Have you received any prior offers? Is the seller open to a 4% concession, seller financing, or rate buy-down credit?
- What does the HOA fee cover, when was the last increase, and are there any pending special assessments or reserve-fund shortfalls?
- Is there a deadline driving the sale (1031 exchange, divorce, estate, relocation)? That informs how much negotiation room exists.
- The area grade is low — what's the realistic commute time and amenity access for the typical tenant pool here? Any planned neighborhood developments (good or bad) we should know about?
- What's the average days-on-market for RENTAL listings here right now (not sales)? A rising rental-DOM trend means longer vacancies and softer asking-rent achievability than the comps imply.
- What's the recent tenant-quality profile in this submarket — average credit score on applications, eviction rate, late-payment / NSF rate, and stable-employment percentage? A property-management company in the area should have these aggregated.
- How much new for-sale + rental construction is in the pipeline within 1–3 miles? Heavy new supply typically softens prices + rents 12–24 months out; constrained supply supports both.
Investment metrics
- 1% rule
- 1.02% ✓
- Cap rate
- 6.05%
- Cash-on-cash
- -0.89%
- DSCR
- 0.96
- GRM
- 8.1
CMA / ARV
- ARV (on-the-fly)
- $230,880
- Comps found
- 6
Show comp detail 6 sales within ~0.75 mi
| Address | Dist | Beds/Ba | Sqft | Sold | Price | $/sf | Match |
|---|---|---|---|---|---|---|---|
| 740 Village Cir | 0.00mi | 3/2.5 | 1,560 (0%) | 1mo | $205,000 | $131 | 99 |
| 865 Village Cir | 0.11mi | 3/2.5 | 1,562 (+0%) | 23mo | $237,000 | $152 | 76 |
| 777 Village Cir | 0.06mi | 2/1.5 (-1) | 1,450 (-7%) | 3mo | $216,000 | $149 | 74 |
| 921 Village Ct | 0.13mi | 3/1.5 | 1,650 (+6%) | 14mo | $219,000 | $133 | 69 |
| 777 Village Cir | 0.05mi | 2/1.5 (-1) | 1,450 (-7%) | 10mo | $215,000 | $148 | 69 |
| 760 Village Cir #0 | 0.03mi | 2/1.5 (-1) | 1,400 (-10%) | 23mo | $185,000 | $132 | 54 |
Match score weights: distance 35% · size 25% · config 20% · recency 20%. Top-matched comps best support the ARV.
Projected returns pro-forma
-3.0% appreciation · 3.0% rent growth · sell at horizon
- IRR
- -17.6%
- Equity multiple
- 0.38×
- Total profit
- $-38,149
- Equity at exit
- $32,654
- IRR
- -9.5%
- Equity multiple
- 0.41×
- Total profit
- $-36,038
- Equity at exit
- $18,935
Cash invested: $61,320 (down + closing). Projections, not guarantees.
Landlord ↔ Tenant lean methodology
- Overall (STATE)
- 43 Moderately Tenant-Leaning
- State Illinois
- 43 Moderately Tenant-Leaning · D+7
- County
- — inherits STATE
- City
- — inherits STATE
ZIP-level market 60152
- Home prices YoY
- -22.7%
- Active inventory
- 64
- Price-to-rent
- 8.1×
Monthly cashflow live
- Estimated rent
- $2,241 high interval (Pro) →
- Mortgage (P&I)
- −$1,148
- Tax from tax record
- −$416 /mo · $4,991/yr
- Insurance
- −$91
- HOA
- −$160
- Vacancy / Maint / Mgmt
- −$471
- Net cashflow
- $-45
Break-even live
Sensitivity live
| Price | -10% $79 | -5% $17 | +0% $-45 | +5% $-107 | +10% $-169 |
|---|---|---|---|---|---|
| Rent | -10% $-222 | -5% $-134 | +0% $-45 | +5% $43 | +10% $132 |
| Rate | -1.0pp $65 | -0.5pp $10 | base $-45 | +0.5pp $-102 | +1.0pp $-160 |
UW: 25.0% down · 7.5% · 30yr · 1.5% tax · 5.0% vac · 8.0% maint · 8.0% mgmt
Financing live
Cash to close
- Down payment
- $54,750
- Closing costs
- $6,570
- Reserves months
- —
- Total cash needed
- —
Loan-product check · same deal, 3 products live
Conventional
25% down · 7.5% · 30yr
- Down + closing
- —
- Monthly P&I
- —
- Monthly cashflow
- —
- DSCR
- —
- Eligible?
- —
Personal DTI + credit; lowest rate.
DSCR
20% down · 8.5% · 30yr
- Down + closing
- —
- Monthly P&I
- —
- Monthly cashflow
- —
- DSCR
- —
- Eligible?
- —
No personal income docs; deal must DSCR.
Hard money
10% down · 12.0% · 12mo
- Down + closing
- —
- Monthly P&I
- —
- Monthly cashflow
- —
- DSCR
- —
- Eligible?
- —
Short-term bridge; refi at stabilization.
Rent comps 6 comps
| Address | Beds | Baths | Sqft | Rent | $/sqft | DOM | Units | Dist |
|---|---|---|---|---|---|---|---|---|
| 739 Quail Ln Marengo, IL | 2.0 | 2.5 | 1400 | $2,195 | $1.57 | 0d | 1 | 0.10mi |
| 717 Quail Ln Marengo, IL | 2.0 | 2.0 | 2000 | $2,195 | $1.10 | 26d | 1 | 0.11mi |
| 925 Partridge Cir Marengo, IL | 2.0 | 2.0 | 2000 | $2,195 | $1.10 | 0d | 1 | 0.14mi |
| 958 Partridge Cir Marengo, IL | 2.0 | 2.0 | 1400 | $2,195 | $1.57 | 3d | 1 | 0.16mi |
| 1161 Foxglove Ln Marengo, IL | 3.0 | 2.5 | 1800 | $2,895 | $1.61 | 4d | 1 | 0.49mi |
| 970 Meadow Ln Marengo, IL | 2.0 | 2.0 | 1900 | $2,395 | $1.26 | 17d | 1 | 1.46mi |
HOA detail
- Monthly dues
- $160 · $1,920/yr
Listing history 3 events
-
2026-04-21historical Contingent - Continue to Show
-
2026-04-09historical
-
2001-06-18soldstatus $135,500
ⓘ Source: listings_history table (triggers on properties + properties_extension) + one-shot
backfill from property_details.listing_events for pre-trigger history.
Tax reassessment forecast IL · Partial reset (capped growth)
- Current annual tax
- $4,991 · $416/mo
- Projected year-2 tax
- $4,991 · $416/mo
- Expected delta
- $0/yr ($0/mo · 0.0%)
ⓘ Screening estimate from a state-policy table — verify with the county assessor before closing.
Climate risk First Street
- Flood 1/10 Low FEMA zone X (unshaded) · 0% chance over 30 yrs
- Wildfire 1/10 Low
- Heat 3/10 Moderate 7 d/yr ≥102°F today · 14 d/yr by 30 yrs out
- Wind 2/10 Low 0% chance of damaging wind over 30 yrs
- Air quality 1/10 Low 0 unhealthy d/yr today · 0 by 30 yrs out
Nearby sold comps map
Loading sold comps map…
Walkable amenities ~0.75 mi
Loading nearby amenities…
Taxation est. · year 1
- Rental income
- $26,892
- − Mortgage interest
- −$12,267
- − Property taxes
- −$4,991
- − Insurance
- −$1,095
- − Repairs & maintenance
- −$2,151
- − Management
- −$2,151
- − HOA
- −$1,920
- − Depreciation
- −$6,371
- Taxable loss
- −$4,055
- Est. tax savings @ 24.0%
- +$973
- After-tax cash flow
- $430/yr
For passive investors: Depreciation is non-cash, so a rental often shows a tax loss while cash-flowing — sheltering income. Rental losses are passive: they offset passive income freely, and up to $25,000/yr can offset ordinary (W-2) income if you actively participate and your MAGI is under $100k (phasing out to $0 by $150k); unused losses carry forward. On sale, claimed depreciation is recaptured at up to 25%, and gains may owe capital-gains tax (a 1031 exchange can defer both). Figures are a year-1 estimate at your 24.0% rate — not tax advice; consult a CPA.
Schools (NCES district)
- District
- Marengo Chsd 154
- NCES district ID
- 1724570
- Math proficiency
- 40% ▼ -5.00%
- Reading proficiency
- 45% ▲ 5.00%
- Median HH income
- $65,606
- Composite
- 40.37/100
- National rank
- #7752
- State rank
- #240 of 919 in IL
Livability — Marengo
- Score
- 64/100
- State rank
- #708
- US rank
- #14374
Category grades
Schools grade is shown separately in the Schools card above.
Census & demographics
- Census place
- Marengo, IL
- Population (ZIP)
- 12,006
Population outlook (McHenry County) Hauer SSP2
- Today (2025)
- 305,342 people
- By 2030
- 301,491 · -1.3%
- By 2040
- 288,211 · -5.6%
- By 2050
- 268,430 · -12.1%
- By 2075
- 226,209 · -25.9%
- By 2100
- 181,247 · -40.6%
Race, ethnicity, and origin ACS 2023
- Neighborhood character
- Predominantly White (88%)
- Race & ethnicity
- White 88% Hispanic / Latino 9% Two or more races 5%
- Hispanic origin (detail)
- Mexican 8%
- Common ancestry
- Romanian 10% Portuguese 1% Italian 1%
- Foreign-born
- 5% · Canada
- Languages at home
- 92% English-only · Spanish 6% Russian/Polish/Slavic 1% German/W. Germanic 1%
Political lean MEDSL · McHenry
- 2024 margin
- Lean R (+5.3) · D 46.6% · R 51.9% · Other 1.5%
- 2008→2024 swing
- -10.6pp toward R · 2008: 5.3pp · 2024: -5.3pp
- All cycles
- 2024: R+5.3 2020: R+2.5 2016: R+8.1 2012: R+8.8 2008: D+5.3
Not yet ingested
- Civics
- —
Market trends
- HPI YoY
- ▼ -66.07%
- Current HPI
- 224.4483
- Rent YoY
- —
- Metro
- —
- State GDP YoY
- ▲ 1.59%
- F500 in state
- 60
Industry mix (Fortune 500 HQ in IL)
| Industry | F500 HQs | Revenue |
|---|---|---|
| Insurance | 4 | $201B |
|
||
| Consumer Goods | 4 | $87B |
|
||
| Industrial Machinery | 3 | $64B |
|
||
| Healthcare | 2 | $55B |
|
||
| Retail / Pharmacy | 1 | $148B |
|
||
| Agriculture / Food | 1 | $86B |
|
||
Price history
3 events — show timeline
- 2026-04-21 Contingent — MRED as Distributed by MLS Grid
- 2026-04-09 Listing Removed — MRED as Distributed by MLS Grid
- 2001-06-18 Sold (Public Records) $135,500 Public Records
Property tax history
+1.8%/yrLatest (2024): $4,991 · +3.5% YoY. Source: county tax records.
Cash-flow waterfall
monthlySold comps — $/sqft
last 12 mo · ≤1 miLoading sold comps…