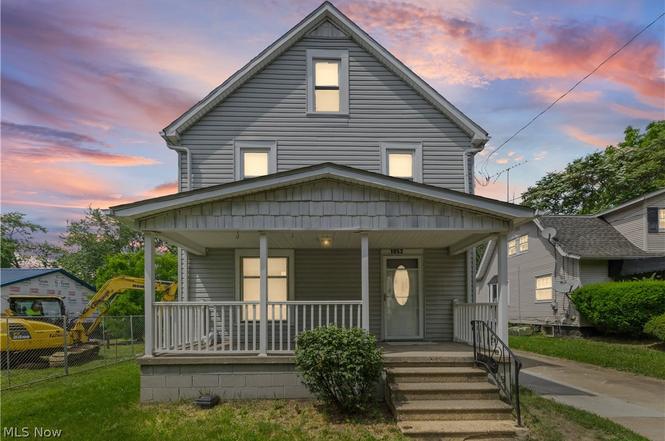
1053 Wyley Ave · Akron, OH
Flood risk 1/10 · Minimal
- FEMA flood zone
- X (unshaded)
- Chance of flooding over 30 yrs
- 0.0%
- Est. flood insurance / yr
- $473 – $860
Fire risk 1/10 · Minimal
- Est. fire insurance / yr
- $713 – $1,323
Heat risk 3/10 · Minor
- Hot days now (above 96°F)
- 7 days/yr
- Hot days in 30 yrs
- 16 days/yr
Wind risk 1/10 · Minimal
- Chance of severe wind over 30 yrs
- —
Air-quality risk 2/10 · Minimal
- Unhealthy air days now
- 1 days/yr
- Unhealthy air days in 30 yrs
- 2 days/yr
Risk factors via First Street. Map © Google.
Why this score? — see what drove the D- grade
The composite is a weighted blend of 9 inputs, each scored 0–100. Each bar is that input's sub-score; the figure is the points it added to the 100-point composite (weight × sub-score).
- Cash flow +11.3/30.0
- ARV discount +7.5/15.0
- Rent growth +4.4/5.0
- Livability +4.0/5.0
- DSCR +3.3/10.0
- 1% rule +2.8/10.0
- Condition / age +2.5/5.0
- Schools +2.1/10.0
- Appreciation +0.0/10.0
$175,000
🖨 Deal sheet (PDF) 📄 Offer letter ✓ Due diligence
Listing remarks
Nothing but opportunity with this turn key property! Freshly updated and ready for first time buyers, anyone looking for more space, or investors alike! With a first floor primary and full bath this home provides a growing family the option for aging in place or wonderful layout for investors. Enjoy the spacious front porch with friendly neighbors or an evening on the back deck with family. Located near main roads, shopping, and entertainment; but still tucked back in the neighborhood, this location provides the perfect blend of convenience and comfort. Schedule your showing today!
Key facts
- Full bath
- Spacious front porch
- Back deck
Tags
Property features AI
Finance
- Financial info: Annual tax amount reported
Exterior
- Parking: 2-car garage; Driveway; Concrete parking
- Utilities: Public water; Public sewer
- Home design: Vinyl siding; Asphalt roof; Block foundation; Built per public records
- Construction: Vinyl siding construction; Asphalt roof; Block foundation; Year built from public records
- Exterior features: Public sewer; Public water
Interior
- Bedrooms: 1 main-level bedroom
- Bathrooms: 2 full bathrooms; 1 main-level bathroom
- Heating & cooling: Gas heating; Central air conditioning
- Interior features: Has basement; 6 total rooms
Neighborhood map
What this means for you Summary
Snapshot
- This is a 3-bed/1.0-bath single-family listed at $175k.
Deal economics
- At list price, monthly cash flow is $-63 ($-755/yr) — negative.
- To cash-flow at today's rent, offer at most $164k (6.4% below list).
- To meet the 1% rule (rent ≥ 1% of price), the offer needs to be $136k (22.4% below list).
- Recommended offer: $136k (22.4% below list) — sets the bar for 1% rule.
Location & tenants
- Location reads 81/100 on livability (#104 in OH, #1,591 nationally) — a professional / high-income tenant draw. Strengths: amenities A+, commute A+, cost of living A+; Watch: crime F, employment F.
- Akron City (urban): math 22% / reading 30% proficiency, ranked #602 of 656 in OH (top 92%) — low school quality limits family demand, transient renter base, plan for 1-2y turnover; 66% free/reduced lunch — lower-income household profile, screen leases tightly.
- Zoned schools: David Hill Community Learning Center (math 8% / reading 17%, grade F, #1,434 of 1,584 statewide, top 92%, 258 students, 0% FRL); National Inventors Hall of Fame School Center For Stem (math 45% / reading 56%, grade C, #413 of 654 statewide, top 63%, 406 students, 0% FRL); Akron Early College High School (math 62% / reading 98%, grade A, #34 of 781 statewide, top 4%, 377 students, 0% FRL) — zoned schools average 0% FRL vs 66% district-wide (66 pts lower); this property's tenant base skews higher-income than the district average.
- Zoned-school proficiency averages 48% at this address vs 26% district-wide (+22 pts) — the actual schools serving this property are materially stronger than the Akron City average implies; a family-tenant draw the district grade alone would hide.
- Market conditions: Rents rising fast (+7.6%/yr); 71 active listings in the ZIP; 22 comparable units currently listed for rent nearby; rentals lingering (median 46d on market — plan ~5-8 weeks vacancy on turnover, expect pricing pressure); 50% of comp listings sitting > 30 days — soft ceiling on asking rent; lower-income renter base — watch delinquency; 1,114 units permitted in Summit County in 2024 (397 in 5+ unit buildings).
- This rent runs 39% of the median local income ($42k/yr) — at the standard rent-burdened threshold; future hikes will face affordability resistance.
Forward outlook
- Local home prices are declining (-3.0%/yr); year-one equity from $1k of loan paydown is wiped out by about $5k of value loss. Plan a longer hold.
- Summit County population projected to shrink 6% by 2050 — rents likely to lag national; underwrite the cash flow, not the appreciation.
Negotiation context
- Only 9 days on market — expect competitive offers; lowballing is unlikely to land.
- Current owner paid $17k; list at $175k implies a 929% gain — meaningful room to come down on a strong offer.
Risks & watch-outs
- Watch-outs: built in 1916 — expect roof / HVAC / electrical / plumbing capex.
Questions for the listing agent
- What do current leases actually rent for vs. the listed asking? Can we see a recent rent roll and the last 12 months of T-12 income?
- Built in 1916 — when were the roof, HVAC, electrical panel, plumbing, and water heater last replaced?
- Is there a deadline driving the sale (1031 exchange, divorce, estate, relocation)? That informs how much negotiation room exists.
- Crime grade is F in this area — have there been break-ins, vandalism, or insurance claims at this property in the last 3 years? What carrier currently insures it and at what premium?
- The area grade is low — what's the realistic commute time and amenity access for the typical tenant pool here? Any planned neighborhood developments (good or bad) we should know about?
- What's the average days-on-market for RENTAL listings here right now (not sales)? A rising rental-DOM trend means longer vacancies and softer asking-rent achievability than the comps imply.
- What's the recent tenant-quality profile in this submarket — average credit score on applications, eviction rate, late-payment / NSF rate, and stable-employment percentage? A property-management company in the area should have these aggregated.
- How much new for-sale + rental construction is in the pipeline within 1–3 miles? Heavy new supply typically softens prices + rents 12–24 months out; constrained supply supports both.
Investment metrics
- 1% rule
- 0.78% ✗
- Cap rate
- 5.86%
- Cash-on-cash
- -1.54%
- DSCR
- 0.93
- GRM
- 10.7
CMA / ARV
- ARV (on-the-fly)
- $108,934
- Comps found
- 6
Show comp detail 6 sales within ~0.75 mi
| Address | Dist | Beds/Ba | Sqft | Sold | Price | $/sf | Match |
|---|---|---|---|---|---|---|---|
| 941 Hunt St | 0.23mi | 4/2.0 (+1) | 1,761 (+0%) | 2mo | $154,000 | $87 | 79 |
| 974 E Archwood Ave | 0.20mi | 4/1.0 (+1) | 1,863 (+6%) | 10mo | $115,000 | $62 | 67 |
| 846 Minota Ave | 0.68mi | 4/2.0 (+1) | 1,746 (-1%) | 11mo | $83,000 | $48 | 49 |
| 897 Davies Ave | 0.32mi | 4/3.0 (+1) | 1,500 (-15%) | 4mo | $89,000 | $59 | 44 |
| 907 Mckinley Ave | 0.63mi | 3/1.0 | 1,584 (-10%) | 21mo | $54,000 | $34 | 36 |
| 824 Concord Ave | 0.49mi | 4/2.0 (+1) | 1,983 (+13%) | 18mo | $150,000 | $76 | 32 |
Match score weights: distance 35% · size 25% · config 20% · recency 20%. Top-matched comps best support the ARV.
Projected returns pro-forma
-3.0% appreciation · 7.63% rent growth · sell at horizon
- IRR
- -14.1%
- Equity multiple
- 0.47×
- Total profit
- $-25,768
- Equity at exit
- $26,093
- IRR
- 0.5%
- Equity multiple
- 1.05×
- Total profit
- $2,210
- Equity at exit
- $15,131
Cash invested: $49,000 (down + closing). Projections, not guarantees.
Landlord ↔ Tenant lean methodology
- Overall (STATE)
- 73 Landlord-Friendly
- State Ohio
- 73 Landlord-Friendly · R+6
- County
- — inherits STATE
- City
- — inherits STATE
ZIP-level market 44306
- Rents YoY
- 7.6%
- Active inventory
- 71
- Price-to-rent
- 10.7×
Monthly cashflow live
- Estimated rent
- $1,358 high interval (Pro) →
- Mortgage (P&I)
- −$918
- Tax from tax record
- −$145 /mo · $1,746/yr
- Insurance
- −$73
- HOA
- −$0
- Vacancy / Maint / Mgmt
- −$285
- Net cashflow
- $-63
Break-even live
Sensitivity live
| Price | -10% $36 | -5% $-13 | +0% $-63 | +5% $-112 | +10% $-162 |
|---|---|---|---|---|---|
| Rent | -10% $-170 | -5% $-117 | +0% $-63 | +5% $-9 | +10% $44 |
| Rate | -1.0pp $25 | -0.5pp $-18 | base $-63 | +0.5pp $-108 | +1.0pp $-154 |
UW: 25.0% down · 7.5% · 30yr · 1.5% tax · 5.0% vac · 8.0% maint · 8.0% mgmt
Financing live
Cash to close
- Down payment
- $43,750
- Closing costs
- $5,250
- Reserves months
- —
- Total cash needed
- —
Loan-product check · same deal, 3 products live
Conventional
25% down · 7.5% · 30yr
- Down + closing
- —
- Monthly P&I
- —
- Monthly cashflow
- —
- DSCR
- —
- Eligible?
- —
Personal DTI + credit; lowest rate.
DSCR
20% down · 8.5% · 30yr
- Down + closing
- —
- Monthly P&I
- —
- Monthly cashflow
- —
- DSCR
- —
- Eligible?
- —
No personal income docs; deal must DSCR.
Hard money
10% down · 12.0% · 12mo
- Down + closing
- —
- Monthly P&I
- —
- Monthly cashflow
- —
- DSCR
- —
- Eligible?
- —
Short-term bridge; refi at stabilization.
Rent comps 22 comps
| Address | Beds | Baths | Sqft | Rent | $/sqft | DOM | Units | Dist |
|---|---|---|---|---|---|---|---|---|
| 1070 Super Genius Cir Akron, OH | 2.0–4.0 | 1.0–2.0 | 1145 | $1,174 | $1.03 | 16d | 1 | 0.51mi |
| 516 Whitney Ave Akron, OH | 4.0 | 2.0 | 1676 | $1,500 | $0.89 | 45d | 1 | 0.67mi |
| 497 Lucy St Akron, OH | 4.0 | 1.0 | 1600 | $1,500 | $0.94 | 45d | 1 | 0.68mi |
| 488 Alexander St Akron, OH | 4.0 | 2.0 | 1311 | $1,350 | $1.03 | 25d | 1 | 0.69mi |
| 1182 5th Ave Akron, OH | 3.0 | 1.0 | 1248 | $1,250 | $1.00 | 16d | 1 | 0.86mi |
| 1040 Neptune Ave Akron, OH | 4.0 | 1.0 | 1400 | $1,300 | $0.93 | 45d | 1 | 0.92mi |
| 979 Neptune Ave Akron, OH | 3.0 | 1.0 | 1248 | $1,250 | $1.00 | 25d | 1 | 0.93mi |
| 1085 Herberich Ave Akron, OH | 4.0 | 1.0 | 1350 | $1,400 | $1.04 | 45d | 1 | 0.95mi |
| 1114 Herberich Ave Akron, OH | 4.0 | 1.0 | 1308 | $1,200 | $0.92 | 45d | 1 | 0.96mi |
| 1125 2nd Ave Akron, OH | 3.0 | 1.0 | 1373 | $1,100 | $0.80 | 25d | 1 | 1.04mi |
| 1012 Brown St Akron, OH | 4.0 | 2.0 | 1518 | $1,295 | $0.85 | 45d | 1 | 1.12mi |
| 432 N Firestone Blvd Unit 1496097P Akron, OH | 4.0 | 2.0 | 1926 | $6,253 | $3.25 | 23d | 1 | 1.16mi |
| 466 Adkins Ave Akron, OH | 4.0 | 1.5 | 1800 | $1,450 | $0.81 | 45d | 1 | 1.17mi |
| 885 Brown St Akron, OH | 4.0 | 2.0 | 1280 | $1,400 | $1.09 | 25d | 1 | 1.19mi |
| 1076 Ackley St Akron, OH | 4.0 | 2.0 | 1998 | $2,000 | $1.00 | 16d | 1 | 1.21mi |
| 450 Stanton Ave Akron, OH | 3.0 | 2.0 | 1927 | $1,425 | $0.74 | 45d | 1 | 1.21mi |
| 1028 Kling St Akron, OH | 4.0 | 2.0 | 1500 | $1,450 | $0.97 | 45d | 1 | 1.21mi |
| 373 N Firestone Blvd Akron, OH | 4.0 | 1.5 | 1590 | $1,550 | $0.97 | 45d | 1 | 1.26mi |
| 907 Kling St Akron, OH | 3.0 | 1.0 | 1248 | $1,250 | $1.00 | 16d | 1 | 1.26mi |
| 435 Margaret St Akron, OH | 4.0 | 2.0 | 1900 | $1,450 | $0.76 | 45d | 1 | 1.35mi |
| 987 Boone St Akron, OH | 3.0 | 1.0 | 1248 | $1,100 | $0.88 | 25d | 1 | 1.37mi |
| 1200 Girard St Akron, OH | 3.0 | 2.0 | 1438 | $1,100 | $0.76 | 16d | 1 | 1.45mi |
Listing history 7 events
-
2026-06-21days on market $175,000 Active 9 DOM
-
2026-06-18days on market $175,000 Active 6 DOM
-
2026-06-17days on market $175,000 Active 5 DOM
-
2026-06-16days on market $175,000 Active 4 DOM
-
2026-06-15days on market $175,000 Active 3 DOM
-
2026-06-13remarks 590-char remark
-
2026-06-13$175,000 Active 1 DOM
ⓘ Source: listings_history table (triggers on properties + properties_extension) + one-shot
backfill from property_details.listing_events for pre-trigger history.
Tax reassessment forecast OH · Partial reset (capped growth)
- Current annual tax
- $1,746 · $145/mo
- Projected year-2 tax
- $2,238 · $186/mo
- Expected delta
- +$492/yr (+$41/mo · 28.2%)
ⓘ Screening estimate from a state-policy table — verify with the county assessor before closing.
Climate risk First Street
- Flood 1/10 Low FEMA zone X (unshaded) · 0% chance over 30 yrs
- Wildfire 1/10 Low
- Heat 3/10 Moderate 7 d/yr ≥96°F today · 16 d/yr by 30 yrs out
- Wind 1/10 Low
- Air quality 2/10 Low 1 unhealthy d/yr today · 2 by 30 yrs out
Nearby sold comps map
Loading sold comps map…
Walkable amenities ~0.75 mi
Loading nearby amenities…
Taxation est. · year 1
- Rental income
- $16,301
- − Mortgage interest
- −$9,803
- − Property taxes
- −$1,746
- − Insurance
- −$875
- − Repairs & maintenance
- −$1,304
- − Management
- −$1,304
- − Depreciation
- −$5,091
- Taxable loss
- −$3,821
- Est. tax savings @ 24.0%
- +$917
- After-tax cash flow
- $162/yr
For passive investors: Depreciation is non-cash, so a rental often shows a tax loss while cash-flowing — sheltering income. Rental losses are passive: they offset passive income freely, and up to $25,000/yr can offset ordinary (W-2) income if you actively participate and your MAGI is under $100k (phasing out to $0 by $150k); unused losses carry forward. On sale, claimed depreciation is recaptured at up to 25%, and gains may owe capital-gains tax (a 1031 exchange can defer both). Figures are a year-1 estimate at your 24.0% rate — not tax advice; consult a CPA.
Schools (NCES district)
- District
- Akron City
- NCES district ID
- 3904348
- Math proficiency
- 22% ▼ -17.00%
- Reading proficiency
- 30% ▼ -12.00%
- Median HH income
- $33,811
- Composite
- 21.31/100
- National rank
- #8383
- State rank
- #602 of 656 in OH
Livability — Akron
- Score
- 81/100
- State rank
- #104
- US rank
- #1591
Category grades
Schools grade is shown separately in the Schools card above.
Census & demographics
- Census place
- Akron, OH
- County
- Summit County · 440,783 people
- City population
- 174,375
- Metro
- Akron, OH
- Population (ZIP)
- 20,905
- Household income
- $41,688
- Rent vs Own
- Severe rent burden
- 1251.0
Population outlook (Summit County) Hauer SSP2
- Today (2025)
- 546,583 people
- By 2030
- 544,028 · -0.5%
- By 2040
- 531,363 · -2.8%
- By 2050
- 514,923 · -5.8%
- By 2075
- 481,765 · -11.9%
- By 2100
- 432,265 · -20.9%
Race, ethnicity, and origin ACS 2023
- Neighborhood character
- Diverse neighborhood (Simpson 0.62)
- Race & ethnicity
- White 48% Black 38% Two or more races 8% Hispanic / Latino 3% Asian 2%
- Common ancestry
- Lithuanian 2% Iranian 1% Scotch-Irish 1%
- Foreign-born
- 4% · Vietnam, Canada, Philippines
- Languages at home
- 94% English-only · Spanish 2% Other Asian/Pacific 1% Vietnamese 1%
Political lean MEDSL · Summit
- 2024 margin
- Lean D (+7.0) · D 53.0% · R 46.0%
- 2008→2024 swing
- -9.6pp toward R · 2008: 16.6pp · 2024: 7.0pp
- All cycles
- 2024: D+7.0 2020: D+9.6 2016: D+8.2 2012: D+14.8 2008: D+16.6
Not yet ingested
- Civics
- —
Market trends
- HPI YoY
- ▼ -101.46%
- Current HPI
- 132.768
- Rent YoY
- ▲ 7.63%
- Metro
- Akron, OH
- State GDP YoY
- ▲ 1.98%
- F500 in state
- 48
Industry mix (Fortune 500 HQ in OH)
| Industry | F500 HQs | Revenue |
|---|---|---|
| Insurance | 3 | $145B |
|
||
| Industrial Machinery | 3 | $49B |
|
||
| Financial Services | 3 | $24B |
|
||
| Consumer Goods | 2 | $93B |
|
||
| Aerospace / Defense | 2 | $47B |
|
||
| Utilities | 2 | $33B |
|
||
Price history
+929.4% since first listed2 events — show timeline
- 2026-06-12 Listed $175,000 MLSNOW
- 2015-05-20 Sold (Public Records) $17,000 Public Records
Property tax history
+24.9%/yrLatest (2025): $1,746 · +4.1% YoY. Source: county tax records.
Cash-flow waterfall
monthlySold comps — $/sqft
last 12 mo · ≤1 miLoading sold comps…