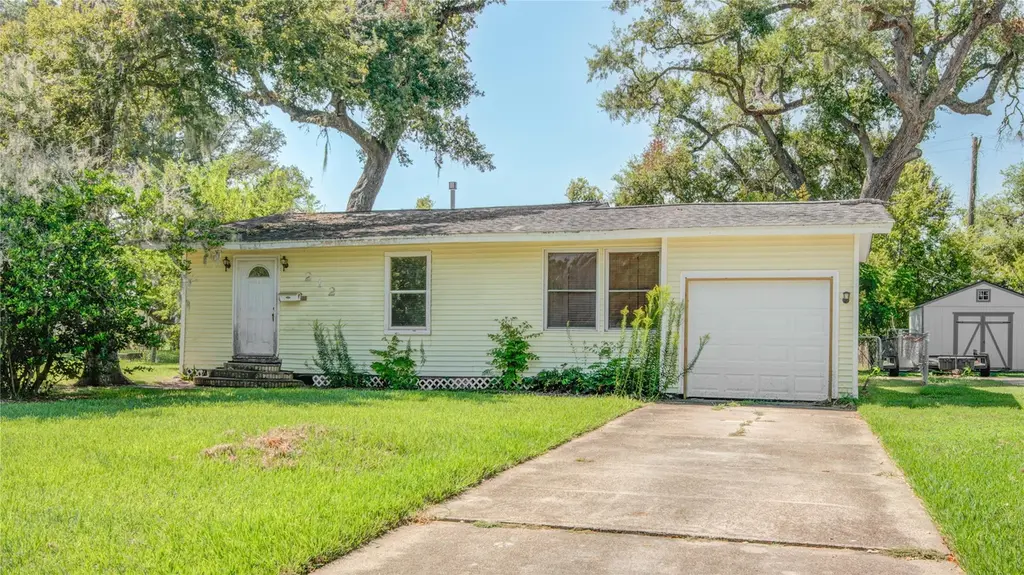
212 Winding Way St · Lake Jackson, TX
Flood risk 5/10 · Moderate
- FEMA flood zone
- X
- Chance of flooding over 30 yrs
- 0.26%
- Est. flood insurance / yr
- $507 – $1,088
Fire risk 4/10 · Minor
- Est. fire insurance / yr
- $1,222 – $2,270
Heat risk 10/10 · Severe
- Hot days now (above 114°F)
- 7 days/yr
- Hot days in 30 yrs
- 26 days/yr
Wind risk 9/10 · Severe
- Chance of severe wind over 30 yrs
- 99.0%
Air-quality risk 2/10 · Minimal
- Unhealthy air days now
- 1 days/yr
- Unhealthy air days in 30 yrs
- 1 days/yr
Risk factors via First Street. Map © Google.
Why this score? — see what drove the C grade
The composite is a weighted blend of 9 inputs, each scored 0–100. Each bar is that input's sub-score; the figure is the points it added to the 100-point composite (weight × sub-score).
- Cash flow +19.3/30.0
- ARV discount +15.0/15.0
- 1% rule +6.7/10.0
- DSCR +6.1/10.0
- Livability +3.9/5.0
- Schools +3.7/10.0
- Condition / age +2.5/5.0
- Rent growth +2.2/5.0
- Appreciation +0.0/10.0
$99,900
🖨 Deal sheet (PDF) 📄 Offer letter ✓ Due diligence
Listing remarks MLS
READY FOR MOVE IN, NEW CARPET, TILE, COVERED PATIO, QUITE NEIGHBORHOOD, NEAR DOWNTOWN, FENCED BACK YARD, ROOF IS 4 YEARS OLD, SOME CLEANING ON GOING
Key facts
- 0.27 acre lot
- Garage
- Built 1945
Property features AI
Exterior
- Parking: Attached garage (1 car)
- Utilities: Public water; Public sewer
- Home design: Residential property; Single-story (first-floor living)
- Construction: Built in 1945; Vinyl siding; Composition roof; Block foundation
- Exterior features: Fence enclosing the backyard; Subdivision lot
Interior
- Kitchen: Gas range
- Bedrooms: Primary bedroom on the first floor (approx. 15 x 11); Bedroom on the first floor (approx. 10 x 12); Bonus room on the first floor (approx. 8 x 11)
- Flooring: Carpet; Laminate
- Bathrooms: 1 full bathroom
- Heating & cooling: Central heating (gas); Central electric air conditioning
- Interior features: Pantry; Tub with shower
Neighborhood map
What this means for you Summary
Snapshot
- This is a 2-bed/1.0-bath single-family listed at $100k.
Deal economics
- At list price, monthly cash flow is $110 ($1k/yr) — positive.
- The deal already cash-flows at list — no discount required.
- Meets the 1% rule at list price ($1k rent vs $100k).
- Cap rate 7.6% vs local median 3.8% in Lake Jackson — top-decile yield for the area; either an underpriced asset or a hidden risk that comps aren't pricing in. Stress-test before assuming the spread holds.
Location & tenants
- Location reads 78/100 on livability (#76 in TX, #2,709 nationally) — a middle-class / working-renter tenant base. Strengths: employment A+, cost of living A+, housing A+; Watch: amenities C-, commute F.
- Brazosport ISD (suburban): math 43% / reading 41% proficiency, ranked #305 of 826 in TX (top 37%) — families likely to look elsewhere, expect single-tenant / working-renter base with shorter leases.
- Zoned schools: Elisabet Ney Pre-Kindergarten Campus (213 students, 75% FRL); Rasco Middle (math 45% / reading 50%, grade C-, #408 of 1,662 statewide, top 25%, 731 students, 58% FRL); Brazoswood H S (math 38% / reading 44%, grade F, #774 of 1,632 statewide, top 49%, 2,398 students, 54% FRL).
- Market conditions: Rents soft (-1.1%/yr); 231 active listings in the ZIP; 13 comparable units currently listed for rent nearby; rentals lingering (median 45d on market — plan ~5-8 weeks vacancy on turnover, expect pricing pressure); 69% of comp listings sitting > 30 days — soft ceiling on asking rent; solid renter incomes; 3,960 units permitted in Brazoria County in 2024 (593 in 5+ unit buildings).
- This rent is only 15% of the median local income ($93k/yr) — well below the 30% rent-burden line; pricing power to push rent on renewal without tenant pushback.
Forward outlook
- Local home prices are declining (-3.0%/yr); year-one equity from $691 of loan paydown is wiped out by about $3k of value loss. Plan a longer hold.
- Brazoria County population projected at +44% by 2050 — long-run rental-demand tailwind backs the buy-and-hold thesis.
Negotiation context
- Only 10 days on market — expect competitive offers; lowballing is unlikely to land.
- 3 sale attempts since 13y ago with the ask held roughly flat each time — persistent listings suggest the price (not the market) is what's stuck; bring a comps-based counter.
Risks & watch-outs
- Watch-outs: property tax is 2.9% of price; built in 1945 — expect roof / HVAC / electrical / plumbing capex.
- Climate carrying-cost: moderate flood risk; severe wind risk, 99% chance of damaging wind over 30y; extreme-heat days projected 7→26/yr by 2055 (HVAC capex compounding) — expect insurance premiums to compound above CPI over the hold.
Questions for the listing agent
- Built in 1945 — when were the roof, HVAC, electrical panel, plumbing, and water heater last replaced?
- Property tax is high relative to price — has the assessment been appealed recently, and will the sale trigger a re-assessment?
- Is there a deadline driving the sale (1031 exchange, divorce, estate, relocation)? That informs how much negotiation room exists.
- What's the average days-on-market for RENTAL listings here right now (not sales)? A rising rental-DOM trend means longer vacancies and softer asking-rent achievability than the comps imply.
- What's the recent tenant-quality profile in this submarket — average credit score on applications, eviction rate, late-payment / NSF rate, and stable-employment percentage? A property-management company in the area should have these aggregated.
- How much new for-sale + rental construction is in the pipeline within 1–3 miles? Heavy new supply typically softens prices + rents 12–24 months out; constrained supply supports both.
Investment metrics
- 1% rule
- 1.17% ✓
- Cap rate
- 7.62%
- Cash-on-cash
- 4.72%
- DSCR
- 1.21
- GRM
- 7.2
CMA / ARV
- ARV (median comp)
- $157,724
- List price
- $99,900
- Delta
- -20.81%
- Verdict
- UNDERPRICED
- Comps
- 20 within 1.0 mi
Show comp detail 12 sales within ~0.75 mi
| Address | Dist | Beds/Ba | Sqft | Sold | Price | $/sf | Match |
|---|---|---|---|---|---|---|---|
| 312 Center Way St | 0.26mi | 3/1.0 (+1) | 966 (-1%) | 5mo | $154,000 | $159 | 78 |
| 209 Center Way St | 0.13mi | 3/1.0 (+1) | 1,026 (+6%) | 11mo | $189,900 | $185 | 71 |
| 55 Blue Bonnet Ct | 0.30mi | 2/1.0 | 916 (-6%) | 9mo | $109,900 | $120 | 69 |
| 110 Cherry St | 0.35mi | 3/1.0 (+1) | 990 (+2%) | 9mo | $164,900 | $167 | 68 |
| 103 Laurel Street St | 0.41mi | 3/1.0 (+1) | 988 (+2%) | 12mo | $165,500 | $168 | 63 |
| 110 S Magnolia St | 0.57mi | 3/1.0 (+1) | 1,005 (+3%) | 4mo | $199,900 | $199 | 59 |
| 508 Center Way St | 0.54mi | 3/1.0 (+1) | 940 (-3%) | 7mo | $185,000 | $197 | 58 |
| 104 Mimosa St | 0.56mi | 3/1.0 (+1) | 1,043 (+7%) | 2mo | $175,000 | $168 | 55 |
| 103 Palm Ln | 0.72mi | 3/1.0 (+1) | 1,032 (+6%) | 2mo | $149,900 | $145 | 50 |
| 318 Acacia St | 0.62mi | 3/1.0 (+1) | 920 (-5%) | 9mo | $189,900 | $206 | 49 |
| 105 Wisteria St | 0.31mi | 3/2.0 (+1) | 1,113 (+14%) | 9mo | $205,000 | $184 | 45 |
| 225 Laurel St | 0.75mi | 3/1.0 (+1) | 1,030 (+6%) | 10mo | $160,000 | $155 | 41 |
Match score weights: distance 35% · size 25% · config 20% · recency 20%. Top-matched comps best support the ARV.
Projected returns pro-forma
-3.0% appreciation · 0.0% rent growth · sell at horizon
- IRR
- -12.8%
- Equity multiple
- 0.55×
- Total profit
- $-12,495
- Equity at exit
- $14,895
- IRR
- -10.2%
- Equity multiple
- 0.48×
- Total profit
- $-14,664
- Equity at exit
- $8,638
Cash invested: $27,972 (down + closing). Projections, not guarantees.
Landlord ↔ Tenant lean methodology
- Overall (STATE)
- 87 Strongly Landlord-Friendly
- State Texas
- 87 Strongly Landlord-Friendly · R+5
- County
- — inherits STATE
- City
- — inherits STATE
ZIP-level market 77566
- Home prices YoY
- -25.2%
- Rents YoY
- -1.1%
- Active inventory
- 231
- Price-to-rent
- 7.2×
Monthly cashflow live
- Estimated rent
- $1,164 high interval (Pro) →
- Mortgage (P&I)
- −$524
- Tax from tax record
- −$244 /mo · $2,928/yr
- Insurance
- −$42
- HOA
- −$0
- Vacancy / Maint / Mgmt
- −$244
- Net cashflow
- $110
Break-even live
Sensitivity live
| Price | -10% $167 | -5% $138 | +0% $110 | +5% $82 | +10% $54 |
|---|---|---|---|---|---|
| Rent | -10% $18 | -5% $64 | +0% $110 | +5% $156 | +10% $202 |
| Rate | -1.0pp $160 | -0.5pp $136 | base $110 | +0.5pp $84 | +1.0pp $58 |
UW: 25.0% down · 7.5% · 30yr · 1.5% tax · 5.0% vac · 8.0% maint · 8.0% mgmt
Financing live
Cash to close
- Down payment
- $24,975
- Closing costs
- $2,997
- Reserves months
- —
- Total cash needed
- —
Loan-product check · same deal, 3 products live
Conventional
25% down · 7.5% · 30yr
- Down + closing
- —
- Monthly P&I
- —
- Monthly cashflow
- —
- DSCR
- —
- Eligible?
- —
Personal DTI + credit; lowest rate.
DSCR
20% down · 8.5% · 30yr
- Down + closing
- —
- Monthly P&I
- —
- Monthly cashflow
- —
- DSCR
- —
- Eligible?
- —
No personal income docs; deal must DSCR.
Hard money
10% down · 12.0% · 12mo
- Down + closing
- —
- Monthly P&I
- —
- Monthly cashflow
- —
- DSCR
- —
- Eligible?
- —
Short-term bridge; refi at stabilization.
Rent comps 13 comps
| Address | Beds | Baths | Sqft | Rent | $/sqft | DOM | Units | Dist |
|---|---|---|---|---|---|---|---|---|
| 130 Oyster Creek Dr Unit OYS3019 Lake Jackson, TX | 2.0 | 1.0 | 817 | $875 | $1.07 | 3d | 1 | 0.61mi |
| 148 Oyster Creek Dr Lake Jackson, TX | 2.0 | 1.0 | 865 | $975 | $1.13 | 45d | 1 | 0.84mi |
| 460 TX-332 Lake Jackson, TX | 1.0–3.0 | 1.0–2.0 | 836 | $1,026 | $1.23 | 45d | 17 | 0.92mi |
| 460 TX-332 Lake Jackson, TX | 1.0–3.0 | 1.0–2.0 | 836 | $972 | $1.16 | 0d | 10 | 0.92mi |
| 520 That Way Lake Jackson, TX | 1.0 | 1.0 | 848 | $1,002 | $1.18 | 45d | 1 | 1.01mi |
| 111 Any Way St Lake Jackson, TX | 1.0 | 1.0 | 648 | $803 | $1.24 | 45d | 1 | 1.02mi |
| 500 Willow Dr Unit WILC1 Lake Jackson, TX | 2.0 | 2.0 | 937 | $995 | $1.06 | 11d | 1 | 1.06mi |
| 500 Willow Dr Unit WILA8 Lake Jackson, TX | 2.0 | 2.0 | 937 | $935 | $1.00 | 45d | 1 | 1.06mi |
| 116 Lake Rd Lake Jackson, TX | 1.0 | 1.0 | 552 | $837 | $1.52 | 45d | 1 | 1.13mi |
| 106 Cactus St Lake Jackson, TX | 2.0 | 2.0 | 1104 | $1,496 | $1.36 | 45d | 1 | 1.25mi |
| 100 Cactus St Lake Jackson, TX | 1.0–2.0 | 1.0–2.0 | 950 | $1,895 | $1.99 | 0d | 22 | 1.26mi |
| 133 Plantation Dr W Lake Jackson, TX | 2.0 | 2.0 | 1070 | $1,149 | $1.07 | 45d | 1 | 1.43mi |
| 117 Loganberry St Lake Jackson, TX | 1.0 | 1.0 | 655 | $919 | $1.40 | 45d | 1 | 1.47mi |
Listing history 16 events
-
2026-06-15days on market $99,900 Pending 10 DOM
-
2026-06-13statusdays on market $99,900 Pending 9 DOM
-
2026-06-09days on market $99,900 Active 5 DOM
-
2026-06-08days on market $99,900 Active 4 DOM
-
2026-06-07pricestatusdays on market $99,900 Active 3 DOM
-
2026-05-18status Pending 357-char remark
-
2026-03-31price $124,900 357-char remark
-
2026-01-06price $134,900 357-char remark
-
2025-10-09$139,900 Active 357-char remark
-
2016-07-11soldstatus
-
2015-05-01soldstatus
-
2014-10-22soldstatus
-
2014-03-11soldstatus
-
2014-03-10soldstatus 148-char remark
Show marketing remark (148 chars)
READY FOR MOVE IN, NEW CARPET, TILE, COVERED PATIO, QUITE NEIGHBORHOOD, NEAR DOWNTOWN, FENCED BACK YARD, ROOF IS 4 YEARS OLD, SOME CLEANING ON GOING
-
2013-10-28$78,000 148-char remark
Show marketing remark (148 chars)
READY FOR MOVE IN, NEW CARPET, TILE, COVERED PATIO, QUITE NEIGHBORHOOD, NEAR DOWNTOWN, FENCED BACK YARD, ROOF IS 4 YEARS OLD, SOME CLEANING ON GOING
-
2007-05-07soldstatus
ⓘ Source: listings_history table (triggers on properties + properties_extension) + one-shot
backfill from property_details.listing_events for pre-trigger history.
Tax reassessment forecast TX · Resets to sale price
- Current annual tax
- $2,928 · $244/mo
- Projected year-2 tax
- $2,928 · $244/mo
- Expected delta
- $0/yr ($0/mo · 0.0%)
ⓘ Screening estimate from a state-policy table — verify with the county assessor before closing.
Climate risk First Street
- Flood 5/10 Major FEMA zone X · 26% chance over 30 yrs
- Wildfire 4/10 Moderate
- Heat 10/10 Extreme 7 d/yr ≥114°F today · 26 d/yr by 30 yrs out
- Wind 9/10 Extreme 99% chance of damaging wind over 30 yrs
- Air quality 2/10 Low 1 unhealthy d/yr today · 1 by 30 yrs out
Nearby sold comps map
Loading sold comps map…
Walkable amenities ~0.75 mi
Loading nearby amenities…
Taxation est. · year 1
- Rental income
- $13,969
- − Mortgage interest
- −$5,596
- − Property taxes
- −$2,928
- − Insurance
- −$500
- − Repairs & maintenance
- −$1,118
- − Management
- −$1,118
- − Depreciation
- −$2,906
- Taxable loss
- −$196
- Est. tax savings @ 24.0%
- +$47
- After-tax cash flow
- $1,368/yr
For passive investors: Depreciation is non-cash, so a rental often shows a tax loss while cash-flowing — sheltering income. Rental losses are passive: they offset passive income freely, and up to $25,000/yr can offset ordinary (W-2) income if you actively participate and your MAGI is under $100k (phasing out to $0 by $150k); unused losses carry forward. On sale, claimed depreciation is recaptured at up to 25%, and gains may owe capital-gains tax (a 1031 exchange can defer both). Figures are a year-1 estimate at your 24.0% rate — not tax advice; consult a CPA.
Schools (NCES district)
- District
- Brazosport ISD
- NCES district ID
- 4811190
- Math proficiency
- 43% ▼ -6.00%
- Reading proficiency
- 41% ▼ -2.00%
- Median HH income
- $57,024
- Composite
- 36.84/100
- National rank
- #4557
- State rank
- #305 of 826 in TX
Livability — Lake Jackson
- Score
- 78/100
- State rank
- #76
- US rank
- #2709
Category grades
Schools grade is shown separately in the Schools card above.
Census & demographics
- Census place
- Lake Jackson, TX
- County
- Brazoria County · 374,982 people
- City population
- 30,246
- Metro
- Houston-The Woodlands-Sugar Land, TX
- Population (ZIP)
- 30,246
- Household income
- $92,586
- Rent vs Own
- Severe rent burden
- 1126.0
Population outlook (Brazoria County) Hauer SSP2
- Today (2025)
- 420,414 people
- By 2030
- 457,585 · +8.8%
- By 2040
- 532,232 · +26.6%
- By 2050
- 605,399 · +44.0%
- By 2075
- 779,358 · +85.4%
- By 2100
- 883,759 · +110.2%
Race, ethnicity, and origin ACS 2023
- Neighborhood character
- Diverse neighborhood (Simpson 0.56)
- Race & ethnicity
- White 60% Hispanic / Latino 28% Two or more races 16% Black 7% Asian 2%
- Hispanic origin (detail)
- Mexican 24%
- Common ancestry
- Lithuanian 3% Serbian 2% Italian 1%
- Foreign-born
- 8% · Canada, South Korea
- Languages at home
- 83% English-only · Spanish 15% Arabic 1% Tagalog/Filipino 1%
Political lean MEDSL · Brazoria
- 2024 margin
- R (+19.7) · D 39.5% · R 59.2% · Other 1.3%
- 2008→2024 swing
- +9.9pp toward D · 2008: -29.6pp · 2024: -19.7pp
- All cycles
- 2024: R+19.7 2020: R+18.2 2016: R+24.6 2012: R+34.2 2008: R+29.6
Not yet ingested
- Civics
- —
Market trends
- HPI YoY
- ▼ -84.81%
- Current HPI
- 251.8234
- Rent YoY
- ▼ -1.11%
- Metro
- Houston-The Woodlands-Sugar Land, TX
- State GDP YoY
- ▲ 3.95%
- F500 in state
- 110
Industry mix (Fortune 500 HQ in TX)
| Industry | F500 HQs | Revenue |
|---|---|---|
| Energy | 16 | $1,198B |
|
||
| Technology | 5 | $198B |
|
||
| Engineering / Construction | 4 | $72B |
|
||
| Energy Services | 3 | $60B |
|
||
| Utilities | 3 | $41B |
|
||
| Healthcare | 2 | $330B |
|
||
Price history
+28.1% since first listed16 events — show timeline
- 2026-06-15 Pending — HARMLS
- 2026-06-10 Pending — HARMLS
- 2026-06-04 Listed $99,900 HARMLS
- 2026-05-27 Pending — HARMLS
- 2026-05-18 Pending — HARMLS
- 2026-05-18 Listing Removed — HARMLS
- 2026-03-31 Price Changed $124,900 HARMLS
- 2026-01-06 Price Changed $134,900 HARMLS
- 2025-10-09 Listed $139,900 HARMLS
- 2016-07-11 Sold (Public Records) — Public Records
- 2015-05-01 Sold (Public Records) — Public Records
- 2014-10-22 Sold (Public Records) — Public Records
- 2014-03-11 Sold (Public Records) — Public Records
- 2014-03-10 Sold (MLS) — BCBR
- 2013-10-28 Listed $78,000 BCBR
- 2007-05-07 Sold (Public Records) — Public Records
Property tax history
+4.2%/yrLatest (2025): $2,928 · +2.3% YoY. Source: county tax records.
Cash-flow waterfall
monthlySold comps — $/sqft
last 12 mo · ≤1 miLoading sold comps…