24437 Harborview Rd #55 · Charlotte Harbor, FL
Flood risk 9/10 · Severe
- FEMA flood zone
- AE
- Chance of flooding over 30 yrs
- 0.99%
- Est. flood insurance / yr
- $1,737 – $8,500
Fire risk 1/10 · Minimal
- Est. fire insurance / yr
- $947 – $1,759
Heat risk 10/10 · Severe
- Hot days now (above 107°F)
- 7 days/yr
- Hot days in 30 yrs
- 28 days/yr
Wind risk 10/10 · Severe
- Chance of severe wind over 30 yrs
- 99.0%
Air-quality risk 2/10 · Minimal
- Unhealthy air days now
- 2 days/yr
- Unhealthy air days in 30 yrs
- 2 days/yr
Risk factors via First Street. Map © Google.
Why this score? — see what drove the B- grade
The composite is a weighted blend of 9 inputs, each scored 0–100. Each bar is that input's sub-score; the figure is the points it added to the 100-point composite (weight × sub-score).
- Cash flow +30.0/30.0
- 1% rule +10.0/10.0
- DSCR +10.0/10.0
- ARV discount +7.5/15.0
- Schools +4.6/10.0
- Livability +3.4/5.0
- Condition / age +2.5/5.0
- Rent growth +1.5/5.0
- Appreciation +0.0/10.0
$75,900
🖨 Deal sheet 📄 Offer letter ✓ Due diligence
Listing remarks
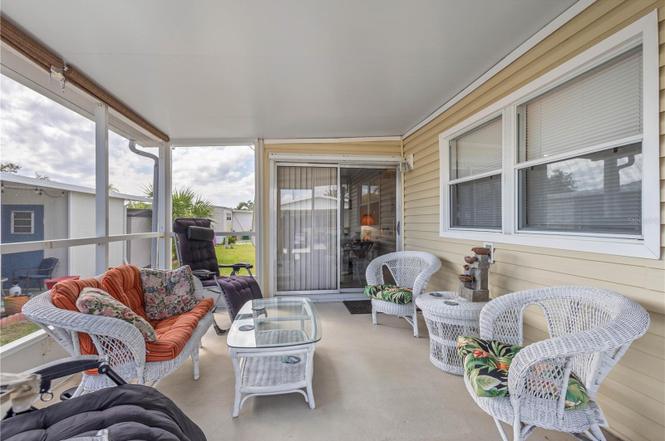
Great New Price !! Coastal living has never been so affordable!! Well-Maintained Home in Desirable Mary Lu 55+ Resident-Owned Park! Park sits on the Peace Rive/Charlotte Harbor, so if you enjoy the water you will fall in love with this location. Welcome to this nicely maintained 2-bedroom, 1-bath mobile home located in the sought-after Mary Lu Park, a quiet and well-kept 55+ resident-owned community with just 104 units. This intimate park offers a peaceful atmosphere while remaining close to everything you need. The home has been lovingly cared for and offers comfortable living with a functional layout and comes fully furnished. Low monthly maintenance fees include water, sewer, trash, a
Key facts
- Quiet atmosphere
- Fully furnished
- 4,023 sq ft lot
Tags
Property features AI
Finance
- Other: Turnkey (furnished); Annual total fees reported as $3,000
- HOA & community: Monthly association fee of $250; Association covers grounds maintenance, private road, sewer, trash, and water; Community clubhouse and park; Senior community; Cats allowed
Exterior
- Parking: Carport with 2 spaces
- Utilities: Public water; Public sewer; Electricity connected; Cable available; Sewer connected; Water connected
- Home design: Residential mobile home; Single wide; One level; East-facing
- Construction: Vinyl siding; Built-up roof; Membrane roof; Built in 1980s–2000s (estimated based on property type and size)
- Exterior features: Exterior lighting; Outdoor storage
Interior
- Kitchen: Range; Refrigerator
- Bedrooms: 2 bedrooms
- Flooring: Carpet; Laminate; Linoleum
- Bathrooms: 1 full bathroom
- Heating & cooling: Central heating; Central air conditioning
- Interior features: Ceiling fans; Kitchen open to family room; Open floor plan
- Laundry & utility: Washer; Dryer; Laundry closet; Electric water heater
Neighborhood map
What this means for you Summary
Snapshot
- This is a 2-bed/2.0-bath manufactured listed at $76k.
Deal economics
- At list price, monthly cash flow is $58 ($695/yr) — positive.
- The deal already cash-flows at list — no discount required.
- Meets the 1% rule at list price ($2k rent vs $76k).
- Recommended offer: $67k (12.0% below list) — sets the bar for market timing.
Location & tenants
- Location reads 68/100 on livability (#536 in FL) — a middle-class / working-renter tenant base. Strengths: cost of living A+, housing A+, crime A-; Watch: employment D+, schools F, amenities F.
- Charlotte (suburban): math 54% / reading 54% proficiency, ranked #22 of 73 in FL (top 30%) — acceptable for families but not a draw, mixed tenant base, ~2y average lease.
- Market conditions: Rents falling (-4.0%/yr); 600 active listings in the ZIP; 4,585 units permitted in Charlotte County in 2024 (703 in 5+ unit buildings).
- This rent runs 31% of the median local income ($64k/yr) — at the standard rent-burdened threshold; future hikes will face affordability resistance.
Forward outlook
- Local home prices are declining (-3.0%/yr); year-one equity from $525 of loan paydown is wiped out by about $2k of value loss. Plan a longer hold.
- Charlotte County population projected at +24% by 2050 — long-run rental-demand tailwind backs the buy-and-hold thesis.
Negotiation context
- It's been on market 152 days — a 12% lower offer ($67k) is reasonable based on typical stale-listing flexibility.
- 2 sale attempts; this cycle's ask has dropped $4k (5%) from the opening price — seller is motivated, your offer sets the floor, not the list.
Risks & watch-outs
- Watch-outs: flood insurance adds $427/mo.
- Climate carrying-cost: in FEMA flood zone AE (mandatory federal flood insurance); severe wind risk, 99% chance of damaging wind over 30y; extreme-heat days projected 7→28/yr by 2055 (HVAC capex compounding) — expect insurance premiums to compound above CPI over the hold.
Questions for the listing agent
- It's been on market 152 days. Have you received any prior offers? Is the seller open to a 12% concession, seller financing, or rate buy-down credit?
- Built in 1972 — when were the roof, HVAC, electrical panel, plumbing, and water heater last replaced?
- What's the actual annual flood-insurance premium (NFIP or private), and is the property in a SFHA with mandatory coverage?
- What does the HOA fee cover, when was the last increase, and are there any pending special assessments or reserve-fund shortfalls?
- Why hasn't it sold? Are there any deal-killer items the seller is aware of (foundation, flood, title, zoning, code violations)?
- Is there a deadline driving the sale (1031 exchange, divorce, estate, relocation)? That informs how much negotiation room exists.
- Schools are F-rated, which usually means shorter tenancies and higher turnover. Who's the typical renter profile here, and what's been the actual vacancy rate?
- What's the average days-on-market for RENTAL listings here right now (not sales)? A rising rental-DOM trend means longer vacancies and softer asking-rent achievability than the comps imply.
- What's the recent tenant-quality profile in this submarket — average credit score on applications, eviction rate, late-payment / NSF rate, and stable-employment percentage? A property-management company in the area should have these aggregated.
- How much new for-sale + rental construction is in the pipeline within 1–3 miles? Heavy new supply typically softens prices + rents 12–24 months out; constrained supply supports both.
Investment metrics
- 1% rule
- 2.16% ✓
- Cap rate
- 13.95%
- Cash-on-cash
- 27.35%
- DSCR
- 2.22
- GRM
- 3.9
CMA / ARV
No comps found within radius.
Projected returns pro-forma
-3.0% appreciation · 0.0% rent growth · sell at horizon
- IRR
- -18.5%
- Equity multiple
- 0.39×
- Total profit
- $-12,952
- Equity at exit
- $11,317
- IRR
- -46.4%
- Equity multiple
- -0.09×
- Total profit
- $-23,211
- Equity at exit
- $6,562
Cash invested: $21,252 (down + closing). Projections, not guarantees.
Landlord ↔ Tenant lean methodology
- Overall (STATE)
- 87 Strongly Landlord-Friendly
- State Florida
- 87 Strongly Landlord-Friendly · R+3
- County
- — inherits STATE
- City
- — inherits STATE
ZIP-level market 33980
- Home prices YoY
- -5.0%
- Rents YoY
- -4.0%
- Active inventory
- 600
- Price-to-rent
- 3.9×
Monthly cashflow live
- Estimated rent
- $1,639 medium interval (Pro) →
- Mortgage (P&I)
- −$398
- Tax from tax record
- −$130 /mo · $1,565/yr
- Insurance
- −$32
- Flood insurance flood zone
- −$427 /mo · $5,118/yr
- HOA
- −$250
- Vacancy / Maint / Mgmt
- −$344
- Net cashflow
- $58
Break-even live
UW: 25.0% down · 7.5% · 30yr · 1.5% tax · 5.0% vac · 8.0% maint · 8.0% mgmt
Financing live
Cash to close
- Down payment
- $18,975
- Closing costs
- $2,277
- Reserves months
- —
- Total cash needed
- —
Loan-product check · same deal, 3 products live
Conventional
25% down · 7.5% · 30yr
- Down + closing
- —
- Monthly P&I
- —
- Monthly cashflow
- —
- DSCR
- —
- Eligible?
- —
Personal DTI + credit; lowest rate.
DSCR
20% down · 8.5% · 30yr
- Down + closing
- —
- Monthly P&I
- —
- Monthly cashflow
- —
- DSCR
- —
- Eligible?
- —
No personal income docs; deal must DSCR.
Hard money
10% down · 12.0% · 12mo
- Down + closing
- —
- Monthly P&I
- —
- Monthly cashflow
- —
- DSCR
- —
- Eligible?
- —
Short-term bridge; refi at stabilization.
HOA detail
- Monthly dues
- $250 · $3,000/yr
- Likely covers
- watersewertrash
Listing history 19 events
-
2026-06-19price $75,900 Active 152 DOM
-
2026-06-18days on market $79,900 Active 152 DOM
-
2026-06-17days on market $79,900 Active 151 DOM
-
2026-06-16days on market $79,900 Active 150 DOM
-
2026-06-15days on market $79,900 Active 149 DOM
-
2026-06-14days on market $79,900 Active 147 DOM
-
2026-06-13days on market $79,900 Active 146 DOM
-
2026-06-10days on market $79,900 Active 144 DOM
-
2026-06-09days on market $79,900 Active 143 DOM
-
2026-06-08days on market $79,900 Active 142 DOM
-
2026-06-05days on market $79,900 Active 138 DOM
-
2026-06-03days on market $79,900 Active 137 DOM
-
2026-06-02days on market $79,900 Active 136 DOM
-
2026-06-01days on market $79,900 Active 135 DOM
-
2026-05-31days on market $79,900 Active 134 DOM
-
2026-05-30days on market $79,900 Active 133 DOM
-
2026-01-17$79,900 Active
-
2025-12-11historical
-
2025-03-15$85,000 Active
ⓘ Source: listings_history table (triggers on properties + properties_extension) + one-shot
backfill from property_details.listing_events for pre-trigger history.
Tax reassessment forecast FL · Resets to sale price
- Current annual tax
- $1,565 · $130/mo
- Projected year-2 tax
- $1,565 · $130/mo
- Expected delta
- $0/yr ($0/mo · 0.0%)
ⓘ Screening estimate from a state-policy table — verify with the county assessor before closing.
Climate risk First Street
- Flood 9/10 Extreme FEMA zone AE · 99% chance over 30 yrs
- Wildfire 1/10 Low
- Heat 10/10 Extreme 7 d/yr ≥107°F today · 28 d/yr by 30 yrs out
- Wind 10/10 Extreme 99% chance of damaging wind over 30 yrs
- Air quality 2/10 Low 2 unhealthy d/yr today · 2 by 30 yrs out
Nearby sold comps map
Loading sold comps map…
Walkable amenities ~0.75 mi
Loading nearby amenities…
Taxation est. · year 1
- Rental income
- $19,663
- − Mortgage interest
- −$4,252
- − Property taxes
- −$1,565
- − Insurance
- −$5,498
- − Repairs & maintenance
- −$1,573
- − Management
- −$1,573
- − HOA
- −$3,000
- − Depreciation
- −$2,208
- Taxable loss
- −$6
- Est. tax savings @ 24.0%
- +$1
- After-tax cash flow
- $696/yr
For passive investors: Depreciation is non-cash, so a rental often shows a tax loss while cash-flowing — sheltering income. Rental losses are passive: they offset passive income freely, and up to $25,000/yr can offset ordinary (W-2) income if you actively participate and your MAGI is under $100k (phasing out to $0 by $150k); unused losses carry forward. On sale, claimed depreciation is recaptured at up to 25%, and gains may owe capital-gains tax (a 1031 exchange can defer both). Figures are a year-1 estimate at your 24.0% rate — not tax advice; consult a CPA.
Schools (NCES district)
- District
- Charlotte
- NCES district ID
- 1200240
- Math proficiency
- 54% ▼ -6.00%
- Reading proficiency
- 54% ▼ -1.00%
- Median HH income
- $44,864
- Composite
- 45.62/100
- National rank
- #2586
- State rank
- #22 of 73 in FL
Livability — Charlotte Harbor
- Score
- 68/100
- State rank
- #536
- US rank
- #10043
Category grades
Schools grade is shown separately in the Schools card above.
Census & demographics
- Census place
- Charlotte Harbor, FL
- County
- Charlotte County · 196,994 people
- City population
- 102,180
- Metro
- Punta Gorda, FL
- Population (ZIP)
- 13,120
- Household income
- $63,591
- Rent vs Own
- Severe rent burden
- 612.0
Population outlook (Charlotte County) Hauer SSP2
- Today (2025)
- 198,646 people
- By 2030
- 210,507 · +6.0%
- By 2040
- 230,857 · +16.2%
- By 2050
- 247,148 · +24.4%
- By 2075
- 281,777 · +41.8%
- By 2100
- 293,609 · +47.8%
Race, ethnicity, and origin ACS 2023
- Neighborhood character
- Predominantly White (75%)
- Race & ethnicity
- White 75% Hispanic / Latino 10% Two or more races 10% Black 9%
- Hispanic origin (detail)
- Puerto Rican 3% Cuban 2% Dominican 2%
- Common ancestry
- Romanian 5% Hispanic 4% Slovak 3%
- Foreign-born
- 16% · Canada, Jamaica
- Languages at home
- 85% English-only · Spanish 8% French/Haitian/Cajun 5% German/W. Germanic 1%
Political lean MEDSL · Charlotte
- 2024 margin
- Solid R (+34.0) · D 32.7% · R 66.7%
- 2008→2024 swing
- -26.7pp toward R · 2008: -7.2pp · 2024: -34.0pp
- All cycles
- 2024: R+34.0 2020: R+26.6 2016: R+27.8 2012: R+14.3 2008: R+7.2
Not yet ingested
- Civics
- —
Market trends
- HPI YoY
- ▼ -16.02%
- Current HPI
- 306.3331
- Rent YoY
- ▼ -4.04%
- Metro
- Punta Gorda, FL
- State GDP YoY
- ▲ 3.28%
- F500 in state
- 36
Industry mix (Fortune 500 HQ in FL)
| Industry | F500 HQs | Revenue |
|---|---|---|
| Industrial Technology | 2 | $29B |
|
||
| Insurance | 2 | $17B |
|
||
| Retail | 1 | $60B |
|
||
| Technology Distribution | 1 | $58B |
|
||
| Homebuilding | 1 | $35B |
|
||
| Technology Manufacturing | 1 | $35B |
|
||
Price history
-6.0% since first listed3 events — show timeline
- 2026-01-17 Listed $79,900 Stellar MLS as Distributed by MLS Grid
- 2025-12-11 Listing Removed — Stellar MLS as Distributed by MLS Grid
- 2025-03-15 Listed $85,000 Stellar MLS as Distributed by MLS Grid
Property tax history
+13.0%/yrLatest (2025): $1,565 · +0.7% YoY. Source: county tax records.
Cash-flow waterfall
monthlySold comps — $/sqft
last 12 mo · ≤1 miLoading sold comps…