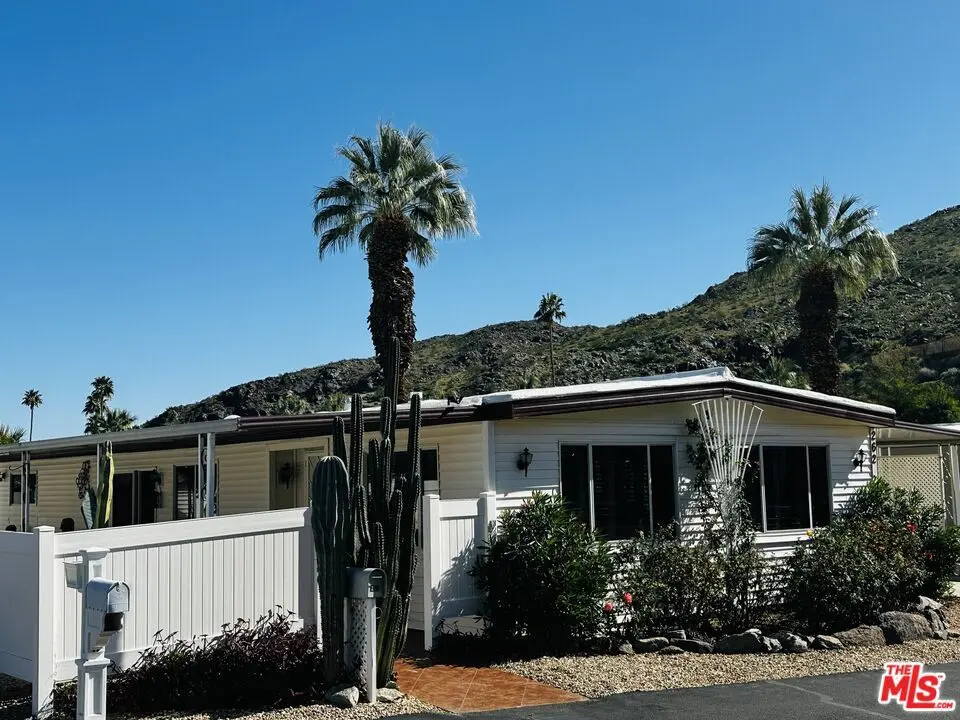
262 Costa Mesa Dr · Palm Springs, CA
Flood risk 1/10 · Minimal
- FEMA flood zone
- X (unshaded)
- Chance of flooding over 30 yrs
- 0.0%
- Est. flood insurance / yr
- $507 – $1,088
Fire risk 4/10 · Minor
- Est. fire insurance / yr
- $659 – $1,223
Heat risk 9/10 · Severe
- Hot days now (above 112°F)
- 8 days/yr
- Hot days in 30 yrs
- 24 days/yr
Wind risk 1/10 · Minimal
- Chance of severe wind over 30 yrs
- —
Air-quality risk 5/10 · Moderate
- Unhealthy air days now
- 6 days/yr
- Unhealthy air days in 30 yrs
- 8 days/yr
Risk factors via First Street. Map © Google.
Why this score? — see what drove the C+ grade
The composite is a weighted blend of 9 inputs, each scored 0–100. Each bar is that input's sub-score; the figure is the points it added to the 100-point composite (weight × sub-score).
- Cash flow +30.0/30.0
- 1% rule +10.0/10.0
- DSCR +10.0/10.0
- Livability +3.3/5.0
- Schools +2.7/10.0
- Condition / age +2.5/5.0
- Rent growth +2.4/5.0
- ARV discount +0.0/15.0
- Appreciation +0.0/10.0
$139,900
🖨 Deal sheet (PDF) 📄 Offer letter ✓ Due diligence
Listing remarks MLS
Welcome to 262 Costa Mesa - a large, fully furnished double-wide in a secluded, quiet area of fun & funky Safari Park! With 1,440 square feet of living space, this home has been well cared for and meticulously maintained. It features two bedrooms & two en-suite baths, a large living room, a formal dining room w/ built-ins, family room / den area, updated kitchen w/ all appliances (including a brand new dishwasher), laundry room with washer & dryer, plenty of closet space, sliding glass doors to a private, fenced patio & back yard, two-car carport, two storage sheds (one functions as a workshop), central heat & air conditioning, dual pane windows, insulated exterior walls. .. There's even an in-ground, flowing stream! And talk about affordability! The lot rent is well below the average for the Coachella Valley - at just $754.75 per month ($799.28 including water, sewer & trash). Safari Park is a 55+ community. Park approval required for residency. Sorry, Safari Park does not allow rentals. This one is priced to move. Schedule your tour today!
Key facts
- Central heat
- Secluded area
- Private fenced patio
Tags
Neighborhood map
What this means for you Summary
Snapshot
- This is a 2-bed/2.0-bath manufactured listed at $140k.
Deal economics
- At list price, monthly cash flow is $2k ($19k/yr) — positive.
- The deal already cash-flows at list — no discount required.
- Meets the 1% rule at list price ($3k rent vs $140k).
- Recommended offer: $123k (12.0% below list) — sets the bar for market timing.
- Cap rate 19.7% vs local median 2.7% in Palm Springs — top-decile yield for the area; either an underpriced asset or a hidden risk that comps aren't pricing in. Stress-test before assuming the spread holds.
Location & tenants
- Location reads 66/100 on livability (#348 in CA) — a middle-class / working-renter tenant base. Strengths: amenities A+, commute A+; Watch: schools C-, crime F, cost of living F.
- Palm Springs Unified (suburban): math 21% / reading 42% proficiency, ranked #328 of 517 in CA (top 63%) — families likely to look elsewhere, expect single-tenant / working-renter base with shorter leases; 73% free/reduced lunch — lower-income household profile, screen leases tightly.
- Market conditions: Rents soft (-0.4%/yr); 492 active listings in the ZIP; 40 comparable units currently listed for rent nearby; rentals lingering (median 45d on market — plan ~5-8 weeks vacancy on turnover, expect pricing pressure); 55% of comp listings sitting > 30 days — soft ceiling on asking rent; solid renter incomes; 9,195 units permitted in Riverside County in 2024 (1,512 in 5+ unit buildings).
- At $3,203/mo this rent would consume 49% of the median local household income ($78k/yr) (locally 1215% of renters already pay >50% of income on rent) — very limited rent-growth headroom before tenants either downsize or default.
Forward outlook
- Local home prices are declining (-3.0%/yr); year-one equity from $967 of loan paydown is wiped out by about $4k of value loss. Plan a longer hold.
- Riverside County population projected at +22% by 2050 — long-run rental-demand tailwind backs the buy-and-hold thesis.
- At projected returns (-3.0% appreciation + 0.0% rent growth), your $39k cash investment doubles in ~3 years — after that, you're playing with house money.
Negotiation context
- It's been on market 135 days — a 12% lower offer ($123k) is reasonable based on typical stale-listing flexibility.
- 2 sale attempts since 25y ago with the ask held roughly flat each time — persistent listings suggest the price (not the market) is what's stuck; bring a comps-based counter.
Risks & watch-outs
- Climate carrying-cost: extreme-heat days projected 8→24/yr by 2055 (HVAC capex compounding) — expect insurance premiums to compound above CPI over the hold.
Questions for the listing agent
- It's been on market 135 days. Have you received any prior offers? Is the seller open to a 12% concession, seller financing, or rate buy-down credit?
- Built in 1970 — when were the roof, HVAC, electrical panel, plumbing, and water heater last replaced?
- Why hasn't it sold? Are there any deal-killer items the seller is aware of (foundation, flood, title, zoning, code violations)?
- Is there a deadline driving the sale (1031 exchange, divorce, estate, relocation)? That informs how much negotiation room exists.
- Crime grade is F in this area — have there been break-ins, vandalism, or insurance claims at this property in the last 3 years? What carrier currently insures it and at what premium?
- What's the average days-on-market for RENTAL listings here right now (not sales)? A rising rental-DOM trend means longer vacancies and softer asking-rent achievability than the comps imply.
- What's the recent tenant-quality profile in this submarket — average credit score on applications, eviction rate, late-payment / NSF rate, and stable-employment percentage? A property-management company in the area should have these aggregated.
- How much new for-sale + rental construction is in the pipeline within 1–3 miles? Heavy new supply typically softens prices + rents 12–24 months out; constrained supply supports both.
Investment metrics
- 1% rule
- 2.29% ✓
- Cap rate
- 19.70%
- Cash-on-cash
- 47.89%
- DSCR
- 3.13
- GRM
- 3.6
CMA / ARV
- ARV (median comp)
- $107,500
- List price
- $139,900
- Delta
- 30.14%
- Verdict
- OVERPRICED
- Comps
- 4 within 1.0 mi
Show comp detail 5 sales within ~0.75 mi
| Address | Dist | Beds/Ba | Sqft | Sold | Price | $/sf | Match |
|---|---|---|---|---|---|---|---|
| 137 Camarillo St | 0.09mi | 2/2.0 | 1,390 (-4%) | 4mo | $90,000 | $65 | 87 |
| 236 Del Mar | 0.03mi | 3/2.0 (+1) | 1,500 (+4%) | 13mo | $147,000 | $98 | 76 |
| 190 Mercury St | 0.20mi | 3/2.0 (+1) | 1,440 (0%) | 16mo | $175,000 | $122 | 72 |
| 41 Santa Ana St | 0.13mi | 2/2.0 | 1,248 (-13%) | 9mo | $130,000 | $104 | 64 |
| 186 Vega | 0.21mi | 2/3.0 | 1,320 (-8%) | 18mo | $80,000 | $61 | 57 |
Match score weights: distance 35% · size 25% · config 20% · recency 20%. Top-matched comps best support the ARV.
Projected returns pro-forma
-3.0% appreciation · 0.0% rent growth · sell at horizon
- IRR
- 41.9%
- Equity multiple
- 2.72×
- Total profit
- $67,558
- Equity at exit
- $20,860
- IRR
- 46.7%
- Equity multiple
- 4.85×
- Total profit
- $150,958
- Equity at exit
- $12,096
Cash invested: $39,172 (down + closing). Projections, not guarantees.
Landlord ↔ Tenant lean methodology
- Overall (STATE)
- 18 Strongly Tenant-Friendly
- State California
- 18 Strongly Tenant-Friendly · D+13
- County
- — inherits STATE
- City
- — inherits STATE
ZIP-level market 92264
- Rents YoY
- -0.4%
- Active inventory
- 492
- Price-to-rent
- 3.6×
Monthly cashflow live
- Estimated rent
- $3,203 high interval (Pro) →
- Mortgage (P&I)
- −$734
- Tax est. 1.5%
- −$175 /mo · $2,098/yr
- Insurance
- −$58
- HOA
- −$0
- Vacancy / Maint / Mgmt
- −$673
- Net cashflow
- $1,563
Break-even live
Sensitivity live
| Price | -10% $1,660 | -5% $1,612 | +0% $1,563 | +5% $1,515 | +10% $1,467 |
|---|---|---|---|---|---|
| Rent | -10% $1,310 | -5% $1,437 | +0% $1,563 | +5% $1,690 | +10% $1,816 |
| Rate | -1.0pp $1,634 | -0.5pp $1,599 | base $1,563 | +0.5pp $1,527 | +1.0pp $1,490 |
UW: 25.0% down · 7.5% · 30yr · 1.5% tax · 5.0% vac · 8.0% maint · 8.0% mgmt
Financing live
Cash to close
- Down payment
- $34,975
- Closing costs
- $4,197
- Reserves months
- —
- Total cash needed
- —
Loan-product check · same deal, 3 products live
Conventional
25% down · 7.5% · 30yr
- Down + closing
- —
- Monthly P&I
- —
- Monthly cashflow
- —
- DSCR
- —
- Eligible?
- —
Personal DTI + credit; lowest rate.
DSCR
20% down · 8.5% · 30yr
- Down + closing
- —
- Monthly P&I
- —
- Monthly cashflow
- —
- DSCR
- —
- Eligible?
- —
No personal income docs; deal must DSCR.
Hard money
10% down · 12.0% · 12mo
- Down + closing
- —
- Monthly P&I
- —
- Monthly cashflow
- —
- DSCR
- —
- Eligible?
- —
Short-term bridge; refi at stabilization.
Rent comps 40 comps
| Address | Beds | Baths | Sqft | Rent | $/sqft | DOM | Units | Dist |
|---|---|---|---|---|---|---|---|---|
| 2120 Southridge Dr Palm Springs, CA | 2.0 | 2.0 | 1600 | $3,000 | $1.88 | 45d | 1 | 0.34mi |
| 2391 Mira Monte Cir W Palm Springs, CA | 2.0 | 2.0 | 1180 | $2,850 | $2.42 | 44d | 1 | 0.40mi |
| 2350 Miramonte Cir E Unit E Palm Springs, CA | 2.0 | 2.0 | 1241 | $4,500 | $3.63 | 44d | 1 | 0.44mi |
| 2350 Miramonte Cir E Unit A Palm Springs, CA | 2.0 | 2.0 | 1264 | $3,000 | $2.37 | 25d | 1 | 0.44mi |
| 449 Desert Lakes Dr Palm Springs, CA | 2.0 | 2.0 | 1778 | $3,000 | $1.69 | 25d | 1 | 0.48mi |
| 2550 Miramonte Cir E Unit C Palm Springs, CA | 3.0 | 2.5 | 1397 | $2,730 | $1.95 | 25d | 1 | 0.48mi |
| 24 Desert Lakes Dr Palm Springs, CA | 2.0 | 2.0 | 1545 | $9,500 | $6.15 | 44d | 1 | 0.51mi |
| 177 Westlake Dr Palm Springs, CA | 2.0 | 2.0 | 1545 | $12,500 | $8.09 | 44d | 1 | 0.57mi |
| 2601 S Broadmoor Dr Palm Springs, CA | 2.0 | 2.0 | 1178 | $2,050 | $1.74 | 44d | 2 | 0.63mi |
| 3545 Ridgeview Cir Palm Springs, CA | 3.0 | 2.5 | 1783 | $9,750 | $5.47 | 25d | 1 | 0.63mi |
| 3545 Ridgeview Cir Palm Springs, CA | 3.0 | 2.5 | 1783 | $9,750 | $5.47 | 3d | 1 | 0.63mi |
| 3545 Ridgeview Cir Palm Springs, CA | 3.0 | 3.0 | 1783 | $5,675 | $3.18 | 44d | 1 | 0.63mi |
| 272 Desert Lakes Dr Palm Springs, CA | 2.0 | 2.0 | 1545 | $7,000 | $4.53 | 44d | 1 | 0.63mi |
| 70 Lakeview Dr Palm Springs, CA | 2.0 | 2.0 | 1545 | $9,000 | $5.83 | 22d | 1 | 0.64mi |
| 2441 S Birdie Way Unit E Palm Springs, CA | 2.0 | 2.0 | 1438 | $3,250 | $2.26 | 25d | 1 | 0.67mi |
| 4850 N Winners Cir Unit A Palm Springs, CA | 2.0 | 2.0 | 1275 | $2,700 | $2.12 | 17d | 1 | 0.70mi |
| 1700 S Araby Dr Palm Springs, CA | 1.0–2.0 | 1.0–2.0 | 871 | $2,682 | $3.08 | 0d | 5 | 0.72mi |
| 306 Desert Lakes Dr Palm Springs, CA | 2.0 | 2.0 | 1545 | $8,000 | $5.18 | 44d | 1 | 0.73mi |
| 320 Desert Lakes Dr Palm Springs, CA | 2.0 | 2.0 | 1545 | $8,500 | $5.50 | 44d | 1 | 0.76mi |
| 2104 S Birdie Way Palm Springs, CA | 3.0 | 2.0 | 1456 | $3,600 | $2.47 | 44d | 1 | 0.77mi |
| 3180 E Escoba Dr Palm Springs, CA | 3.0 | 2.0 | 1532 | $7,500 | $4.90 | 0d | 1 | 0.78mi |
| 5225 E Waverly Dr #66 Palm Springs, CA | 1.0 | 2.0 | 887 | $3,600 | $4.06 | 44d | 1 | 0.79mi |
| 2716 Anza Trl Palm Springs, CA | 3.0 | 2.0 | 1508 | $4,950 | $3.28 | 44d | 1 | 0.79mi |
| 5301 E Waverly Dr #192 Palm Springs, CA | 2.0 | 2.0 | 979 | $2,300 | $2.35 | 25d | 1 | 0.91mi |
| 5301 E Waverly Dr #120 Palm Springs, CA | 1.0 | 2.0 | 887 | $2,800 | $3.16 | 44d | 1 | 0.91mi |
| 3113 E San Martin Cir Palm Springs, CA | 3.0 | 2.0 | 1737 | $3,950 | $2.27 | 44d | 1 | 0.91mi |
| 1816 Pintura Cir W Palm Springs, CA | 2.0 | 3.0 | 1650 | $3,145 | $1.91 | 44d | 1 | 0.92mi |
| 5301 E Waverly Dr Palm Springs, CA | 1.0–2.0 | 2.0 | 933 | $2,300 | $2.47 | 15d | 2 | 0.99mi |
| 5301 E Waverly Dr Palm Springs, CA | 1.0–2.0 | 2.0 | 933 | $2,300 | $2.47 | 19d | 2 | 0.99mi |
| 2800 Lawrence Crossley Rd Palm Springs, CA | 2.0 | 2.0 | 905 | $2,022 | $2.23 | 44d | 1 | 1.08mi |
| 2700 Lawrence Crossley Rd Unit B15 Palm Springs, CA | 2.0 | 2.0 | 885 | $1,950 | $2.20 | 44d | 1 | 1.10mi |
| 2700 Lawrence Crossley Rd #18 Palm Springs, CA | 2.0 | 2.0 | 885 | $2,050 | $2.32 | 19d | 1 | 1.10mi |
| 5314 Los Coyotes Dr Palm Springs, CA | 3.0 | 3.0 | 1550 | $2,600 | $1.68 | 20d | 1 | 1.11mi |
| 2420 Los Coyotes Dr Palm Springs, CA | 2.0 | 3.0 | 1608 | $2,600 | $1.62 | 44d | 1 | 1.27mi |
| 26 Pueblo Vista Dr Palm Springs, CA | 3.0 | 2.0 | 1487 | $3,200 | $2.15 | 44d | 1 | 1.31mi |
| 2701 E Mesquite Ave Palm Springs, CA | 2.0 | 2.0 | 1175 | $3,435 | $2.92 | 21d | 4 | 1.32mi |
| 2701 E Mesquite Ave Palm Springs, CA | 2.0 | 2.0 | 1175 | $2,898 | $2.47 | 15d | 4 | 1.32mi |
| 2701 E Mesquite Ave Palm Springs, CA | 2.0 | 2.0 | 1175 | $2,982 | $2.54 | 25d | 5 | 1.32mi |
| 2700 E Mesquite Ave Palm Springs, CA | 2.0 | 2.0 | 1175 | $3,025 | $2.57 | 44d | 2 | 1.35mi |
| 5951 Montecito Dr #5 Palm Springs, CA | 3.0 | 2.5 | 1551 | $2,300 | $1.48 | 44d | 1 | 1.40mi |
Listing history 17 events
-
2026-06-18days on market $139,900 Active 135 DOM
-
2026-06-17days on market $139,900 Active 134 DOM
-
2026-06-16days on market $139,900 Active 133 DOM
-
2026-06-15days on market $139,900 Active 132 DOM
-
2026-06-13days on market $139,900 Active 130 DOM
-
2026-06-13days on market $139,900 Active 129 DOM
-
2026-06-09days on market $139,900 Active 126 DOM
-
2026-06-08days on market $139,900 Active 125 DOM
-
2026-06-07days on market $139,900 Active 124 DOM
-
2026-06-04days on market $139,900 Active 121 DOM
-
2026-06-03days on market $139,900 Active 120 DOM
-
2026-06-02days on market $139,900 Active 119 DOM
-
2026-06-01days on market $139,900 Active 118 DOM
-
2026-05-31days on market $139,900 Active 117 DOM
-
2026-02-03$139,900 Active 1094-char remark
Show marketing remark (1094 chars)
Welcome to 262 Costa Mesa - a large, fully furnished double-wide in a secluded, quiet area of fun & funky Safari Park! With 1,440 square feet of living space, this home has been well cared for and meticulously maintained. It features two bedrooms & two en-suite baths, a large living room, a formal dining room w/ built-ins, family room / den area, updated kitchen w/ all appliances (including a brand new dishwasher), laundry room with washer & dryer, plenty of closet space, sliding glass doors to a private, fenced patio & back yard, two-car carport, two storage sheds (one functions as a workshop), central heat & air conditioning, dual pane windows, insulated exterior walls. .. There's even an in-ground, flowing stream! And talk about affordability! The lot rent is well below the average for the Coachella Valley - at just $754.75 per month ($799.28 including water, sewer & trash). Safari Park is a 55+ community. Park approval required for residency. Sorry, Safari Park does not allow rentals. This one is priced to move. Schedule your tour today!
-
2001-06-01historical
-
2001-05-02$26,900
ⓘ Source: listings_history table (triggers on properties + properties_extension) + one-shot
backfill from property_details.listing_events for pre-trigger history.
Climate risk First Street
- Flood 1/10 Low FEMA zone X (unshaded) · 0% chance over 30 yrs
- Wildfire 4/10 Moderate
- Heat 9/10 Extreme 8 d/yr ≥112°F today · 24 d/yr by 30 yrs out
- Wind 1/10 Low
- Air quality 5/10 Major 6 unhealthy d/yr today · 8 by 30 yrs out
Nearby sold comps map
Loading sold comps map…
Walkable amenities ~0.75 mi
Loading nearby amenities…
Taxation est. · year 1
- Rental income
- $38,432
- − Mortgage interest
- −$7,837
- − Property taxes
- −$2,098
- − Insurance
- −$700
- − Repairs & maintenance
- −$3,075
- − Management
- −$3,075
- − Depreciation
- −$4,070
- Taxable income
- $17,578
- Est. tax owed @ 24.0%
- −$4,219
- After-tax cash flow
- $14,540/yr
For passive investors: Depreciation is non-cash, so a rental often shows a tax loss while cash-flowing — sheltering income. Rental losses are passive: they offset passive income freely, and up to $25,000/yr can offset ordinary (W-2) income if you actively participate and your MAGI is under $100k (phasing out to $0 by $150k); unused losses carry forward. On sale, claimed depreciation is recaptured at up to 25%, and gains may owe capital-gains tax (a 1031 exchange can defer both). Figures are a year-1 estimate at your 24.0% rate — not tax advice; consult a CPA.
Schools (NCES district)
- District
- Palm Springs Unified
- NCES district ID
- 0629550
- Math proficiency
- 21% ▼ -7.00%
- Reading proficiency
- 42% ▬ 0.00%
- Median HH income
- $43,638
- Composite
- 26.76/100
- National rank
- #7131
- State rank
- #328 of 517 in CA
Livability — Palm Springs
- Score
- 66/100
- State rank
- #348
- US rank
- #11850
Category grades
Schools grade is shown separately in the Schools card above.
Census & demographics
- Census place
- Palm Springs, CA
- County
- Riverside County · 2,287,001 people
- City population
- 46,786
- Metro
- Riverside-San Bernardino-Ontario, CA
- Population (ZIP)
- 19,899
- Household income
- $77,688
- Rent vs Own
- Severe rent burden
- 1215.0
Population outlook (Riverside County) Hauer SSP2
- Today (2025)
- 2,664,475 people
- By 2030
- 2,802,692 · +5.2%
- By 2040
- 3,050,904 · +14.5%
- By 2050
- 3,256,783 · +22.2%
- By 2075
- 3,655,058 · +37.2%
- By 2100
- 3,766,594 · +41.4%
Race, ethnicity, and origin ACS 2023
- Neighborhood character
- Predominantly White (68%)
- Race & ethnicity
- White 68% Hispanic / Latino 20% Two or more races 12% Asian 6% Black 2% Native American 1%
- Hispanic origin (detail)
- Mexican 16%
- Common ancestry
- Lithuanian 4% Romanian 3% Slovak 3%
- Foreign-born
- 16% · Canada, China, South Korea
- Languages at home
- 81% English-only · Spanish 13% Tagalog/Filipino 2% Other Asian/Pacific 1%
Political lean MEDSL · Riverside
- 2024 margin
- Toss-up / Even · D 48.0% · R 49.3% · Other 2.6%
- 2008→2024 swing
- -3.6pp toward R · 2008: 2.3pp · 2024: -1.3pp
- All cycles
- 2024: R+1.3 2020: D+8.0 2016: D+4.3 2012: R+0.4 2008: D+2.3
Not yet ingested
- Civics
- —
Market trends
- HPI YoY
- ▼ -489.04%
- Current HPI
- 357.0969
- Rent YoY
- ▼ -0.43%
- Metro
- Riverside-San Bernardino-Ontario, CA
- State GDP YoY
- ▲ 3.21%
- F500 in state
- 116
Industry mix (Fortune 500 HQ in CA)
| Industry | F500 HQs | Revenue |
|---|---|---|
| Technology | 27 | $1,492B |
|
||
| Financial Services | 3 | $174B |
|
||
| Retail | 3 | $44B |
|
||
| Insurance | 3 | $26B |
|
||
| Media / Entertainment | 2 | $115B |
|
||
| Pharmaceuticals / Biotech | 2 | $62B |
|
||
Price history
+420.1% since first listed3 events — show timeline
- 2026-02-03 Listed $139,900 TheMLS
- 2001-06-01 Listing Removed — GPSMLS
- 2001-05-02 Listed $26,900 GPSMLS
Cash-flow waterfall
monthlySold comps — $/sqft
last 12 mo · ≤1 miLoading sold comps…