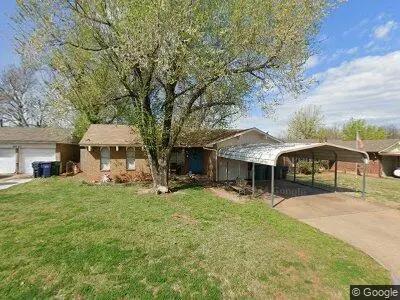
4921 Creekwood Ter · Oklahoma City, OK
Flood risk 1/10 · Minimal
- FEMA flood zone
- X (unshaded)
- Chance of flooding over 30 yrs
- 0.0%
- Est. flood insurance / yr
- $507 – $1,088
Fire risk 1/10 · Minimal
- Est. fire insurance / yr
- $2,463 – $4,575
Heat risk 6/10 · Moderate
- Hot days now (above 107°F)
- 7 days/yr
- Hot days in 30 yrs
- 19 days/yr
Wind risk 2/10 · Minimal
- Chance of severe wind over 30 yrs
- 4.0%
Air-quality risk 1/10 · Minimal
- Unhealthy air days now
- 0 days/yr
- Unhealthy air days in 30 yrs
- 0 days/yr
Risk factors via First Street. Map © Google.
Why this score? — see what drove the C- grade
The composite is a weighted blend of 9 inputs, each scored 0–100. Each bar is that input's sub-score; the figure is the points it added to the 100-point composite (weight × sub-score).
- Cash flow +23.7/30.0
- DSCR +7.6/10.0
- ARV discount +6.1/15.0
- 1% rule +5.6/10.0
- Livability +4.0/5.0
- Rent growth +3.7/5.0
- Condition / age +2.5/5.0
- Schools +0.7/10.0
- Appreciation +0.0/10.0
$127,000
🖨 Deal sheet 📄 Offer letter ✓ Due diligence
Listing remarks MLS
Looking for a nicely updated affordable home in Oklahoma City? Then look no more. This house is a three bed with one and half bath. The house has all new floors, wood look vinyl in the kitchen, dining and bath with carpet throughout the rest of the house. This house lots of windows to let in plenty of natural light. The kitchen is updated with fresh paint and new countertops. The garage has plenty of room plus a carport out front. The backyard also has a storage unit to store all your stuff. The front and back yard are also filled with beautiful trees to make a backyard oasis.
Key facts
- 8ft privacy fence
- Natural light
- Covered patio
Tags
Property features AI
Exterior
- Home design: Built in 1971; Single-family property
- Construction: Construction completed in 1971
- Exterior features: Located in the Central Oklahoma City subdivision
Neighborhood map
What this means for you Summary
Snapshot
- This is a 3-bed/2.0-bath single-family listed at $127k.
Deal economics
- At list price, monthly cash flow is $242 ($3k/yr) — positive.
- The deal already cash-flows at list — no discount required.
- Meets the 1% rule at list price ($1k rent vs $127k).
- Recommended offer: $125k (1.5% below list) — sets the bar for market timing.
- Cap rate 8.6% vs local median 3.7% in Oklahoma City — top-decile yield for the area; either an underpriced asset or a hidden risk that comps aren't pricing in. Stress-test before assuming the spread holds.
Location & tenants
- Location reads 80/100 on livability (#3 in OK, #1,635 nationally) — a professional / high-income tenant draw. Strengths: amenities A+, commute A+, cost of living A+; Watch: schools F, crime F.
- Oklahoma City (urban): math 7% / reading 10% proficiency, ranked #254 of 270 in OK (top 94%) — low school quality limits family demand, transient renter base, plan for 1-2y turnover; 82% free/reduced lunch — lower-income household profile, screen leases tightly.
- Market conditions: Rents rising fast (+4.8%/yr); 89 active listings in the ZIP; 40 comparable units currently listed for rent nearby; rentals at typical pace (median 15d on market — plan ~3-4 weeks tenant-placement turnaround); 5,365 units permitted in Oklahoma County in 2024 (569 in 5+ unit buildings).
Forward outlook
- Local home prices are declining (-3.0%/yr); year-one equity from $878 of loan paydown is wiped out by about $4k of value loss. Plan a longer hold.
- Oklahoma County population projected at +41% by 2050 — long-run rental-demand tailwind backs the buy-and-hold thesis.
- At projected returns (-3.0% appreciation + 4.8% rent growth), your $36k cash investment doubles in ~10 years — after that, you're playing with house money.
Negotiation context
- It's been on market 20 days — a 2% lower offer ($125k) is reasonable based on typical stale-listing flexibility.
- 2 sale attempts since 9y ago with the ask held roughly flat each time — persistent listings suggest the price (not the market) is what's stuck; bring a comps-based counter.
- Current owner paid $73k; list at $127k implies a 74% gain — meaningful room to come down on a strong offer.
Risks & watch-outs
- Climate carrying-cost: extreme-heat days projected 7→19/yr by 2055 (HVAC capex compounding) — expect insurance premiums to compound above CPI over the hold.
Questions for the listing agent
- Built in 1971 — when were the roof, HVAC, electrical panel, plumbing, and water heater last replaced?
- Is there a deadline driving the sale (1031 exchange, divorce, estate, relocation)? That informs how much negotiation room exists.
- Schools are F-rated, which usually means shorter tenancies and higher turnover. Who's the typical renter profile here, and what's been the actual vacancy rate?
- Crime grade is F in this area — have there been break-ins, vandalism, or insurance claims at this property in the last 3 years? What carrier currently insures it and at what premium?
- What's the average days-on-market for RENTAL listings here right now (not sales)? A rising rental-DOM trend means longer vacancies and softer asking-rent achievability than the comps imply.
- What's the recent tenant-quality profile in this submarket — average credit score on applications, eviction rate, late-payment / NSF rate, and stable-employment percentage? A property-management company in the area should have these aggregated.
- How much new for-sale + rental construction is in the pipeline within 1–3 miles? Heavy new supply typically softens prices + rents 12–24 months out; constrained supply supports both.
Investment metrics
- 1% rule
- 1.06% ✓
- Cap rate
- 8.58%
- Cash-on-cash
- 8.18%
- DSCR
- 1.36
- GRM
- 7.8
CMA / ARV
- ARV (on-the-fly)
- $123,299
- Comps found
- 12
Show comp detail 12 sales within ~0.75 mi
| Address | Dist | Beds/Ba | Sqft | Sold | Price | $/sf | Match |
|---|---|---|---|---|---|---|---|
| 5113 Creekwood Ter | 0.15mi | 3/1.5 | 1,039 (+2%) | 1mo | $72,000 | $69 | 86 |
| 5104 Gaines St | 0.23mi | 3/1.5 | 1,052 (+3%) | 4mo | $172,500 | $164 | 78 |
| 3329 Dentwood Ter | 0.46mi | 3/1.0 | 985 (-3%) | 4mo | $75,000 | $76 | 65 |
| 3608 SE 57th Cir | 0.70mi | 3/2.0 | 1,036 (+2%) | 4mo | $130,900 | $126 | 62 |
| 3100 Dentwood Ter | 0.49mi | 3/1.5 | 924 (-9%) | 0mo | $150,000 | $162 | 59 |
| 5404 S Huddleston St | 0.68mi | 3/2.0 | 963 (-6%) | 0mo | $81,500 | $85 | 59 |
| 3409 Chetwood Dr | 0.68mi | 3/2.0 | 986 (-3%) | 5mo | $119,000 | $121 | 59 |
| 3000 Chetwood Dr | 0.66mi | 3/1.5 | 1,064 (+4%) | 3mo | $100,000 | $94 | 57 |
| 3017 SE 56th St | 0.48mi | 3/2.0 | 1,137 (+12%) | 4mo | $175,000 | $154 | 56 |
| 3217 SE 56th St | 0.49mi | 3/1.5 | 1,134 (+11%) | 2mo | $110,000 | $97 | 54 |
| 3432 Parker Dr | 0.58mi | 3/1.0 | 937 (-8%) | 3mo | $140,500 | $150 | 54 |
| 5101 S Karen St | 0.74mi | 3/1.5 | 941 (-8%) | 3mo | $75,000 | $80 | 48 |
Match score weights: distance 35% · size 25% · config 20% · recency 20%. Top-matched comps best support the ARV.
Projected returns pro-forma
-3.0% appreciation · 4.76% rent growth · sell at horizon
- IRR
- -2.0%
- Equity multiple
- 0.92×
- Total profit
- $-2,717
- Equity at exit
- $18,936
- IRR
- 9.4%
- Equity multiple
- 1.78×
- Total profit
- $27,807
- Equity at exit
- $10,981
Cash invested: $35,560 (down + closing). Projections, not guarantees.
Landlord ↔ Tenant lean methodology
- Overall (STATE)
- 83 Strongly Landlord-Friendly
- State Oklahoma
- 83 Strongly Landlord-Friendly · R+20
- County
- — inherits STATE
- City
- — inherits STATE
ZIP-level market 73135
- Home prices YoY
- -8.0%
- Rents YoY
- 4.8%
- Active inventory
- 89
- Price-to-rent
- 7.8×
Monthly cashflow live
- Estimated rent
- $1,349 high interval (Pro) →
- Mortgage (P&I)
- −$666
- Tax from tax record
- −$104 /mo · $1,251/yr
- Insurance
- −$53
- HOA
- −$0
- Vacancy / Maint / Mgmt
- −$283
- Net cashflow
- $242
Break-even live
UW: 25.0% down · 7.5% · 30yr · 1.5% tax · 5.0% vac · 8.0% maint · 8.0% mgmt
Financing live
Cash to close
- Down payment
- $31,750
- Closing costs
- $3,810
- Reserves months
- —
- Total cash needed
- —
Loan-product check · same deal, 3 products live
Conventional
25% down · 7.5% · 30yr
- Down + closing
- —
- Monthly P&I
- —
- Monthly cashflow
- —
- DSCR
- —
- Eligible?
- —
Personal DTI + credit; lowest rate.
DSCR
20% down · 8.5% · 30yr
- Down + closing
- —
- Monthly P&I
- —
- Monthly cashflow
- —
- DSCR
- —
- Eligible?
- —
No personal income docs; deal must DSCR.
Hard money
10% down · 12.0% · 12mo
- Down + closing
- —
- Monthly P&I
- —
- Monthly cashflow
- —
- DSCR
- —
- Eligible?
- —
Short-term bridge; refi at stabilization.
Rent comps 40 comps
| Address | Beds | Baths | Sqft | Rent | $/sqft | DOM | Units | Dist |
|---|---|---|---|---|---|---|---|---|
| 5012 Creekwood Ter Oklahoma City, OK | 3.0 | 1.5 | 1250 | $1,395 | $1.12 | 43d | 1 | 0.10mi |
| 5024 Brookdale St Oklahoma City, OK | 3.0 | 1.5 | 1039 | $1,550 | $1.49 | 21d | 1 | 0.15mi |
| 3005 SE 51st St Oklahoma City, OK | 2.0 | 1.0 | 842 | $995 | $1.18 | 43d | 1 | 0.18mi |
| 2908 SE 47th St Oklahoma City, OK | 3.0 | 1.0 | 1100 | $1,350 | $1.23 | 2d | 1 | 0.19mi |
| 5216 Foster Dr Oklahoma City, OK | 3.0 | 1.5 | 894 | $995 | $1.11 | 43d | 1 | 0.25mi |
| 5305 Brookdale St Oklahoma City, OK | 3.0 | 2.0 | 1205 | $1,195 | $0.99 | 11d | 1 | 0.31mi |
| 5316 S Briarwood Dr Oklahoma City, OK | 3.0 | 2.0 | 980 | $1,149 | $1.17 | 23d | 1 | 0.37mi |
| 2621 SE 50th St Oklahoma City, OK | 3.0 | 1.5 | 1022 | $1,150 | $1.13 | 2d | 1 | 0.40mi |
| 3205 SE 55th St Oklahoma City, OK | 3.0 | 1.5 | 1119 | $1,300 | $1.16 | 43d | 1 | 0.45mi |
| 2532 SE 47th St Oklahoma City, OK | 4.0 | 1.0 | 1215 | $1,550 | $1.28 | 1d | 1 | 0.45mi |
| 3305 Neighbors Ln Oklahoma City, OK | 3.0 | 1.0 | 945 | $1,250 | $1.32 | 2d | 1 | 0.48mi |
| 3224 Lazy Ln Oklahoma City, OK | 3.0 | 2.0 | 1440 | $1,300 | $0.90 | 23d | 1 | 0.53mi |
| 3741 SE 48th Pl Oklahoma City, OK | 3.0 | 2.0 | 1370 | $1,225 | $0.89 | 2d | 1 | 0.53mi |
| 3409 Parker Dr Oklahoma City, OK | 3.0 | 1.0 | 918 | $1,250 | $1.36 | 4d | 1 | 0.54mi |
| 5609 Evanbrook Ter Oklahoma City, OK | 3.0 | 2.0 | 1175 | $1,395 | $1.19 | 2d | 1 | 0.55mi |
| 5609 Evanbrook Ter Oklahoma City, OK | 3.0 | 2.0 | 1175 | $1,395 | $1.19 | 23d | 1 | 0.55mi |
| 3451 SE 44th St Oklahoma City, OK | 1.0–3.0 | 1.0–2.0 | 974 | $950 | $0.98 | 11d | 4 | 0.56mi |
| 3451 SE 44th St Unit 269 Del City, OK | 2.0 | 1.0 | 924 | $850 | $0.92 | 3d | 1 | 0.56mi |
| 4700 Clendon Way Oklahoma City, OK | 3.0 | 2.0 | 1434 | $1,450 | $1.01 | 14d | 1 | 0.57mi |
| 3424 Parker Dr Oklahoma City, OK | 3.0 | 1.0 | 1125 | $450 | $0.40 | 43d | 1 | 0.57mi |
| 4909 Cinderella Dr Oklahoma City, OK | 3.0 | 2.0 | 1113 | $1,150 | $1.03 | 2d | 1 | 0.62mi |
| 4912 S Fairmont Ave Oklahoma City, OK | 3.0 | 2.0 | 1330 | $1,450 | $1.09 | 2d | 1 | 0.64mi |
| 4816 S Fairmont Ave Oklahoma City, OK | 3.0 | 2.0 | 1091 | $1,275 | $1.17 | 23d | 1 | 0.64mi |
| 3916 SE 46th St Oklahoma City, OK | 3.0 | 1.5 | 1220 | $1,295 | $1.06 | 23d | 1 | 0.69mi |
| 4008 SE 47th St Oklahoma City, OK | 3.0 | 1.5 | 1082 | $1,145 | $1.06 | 3d | 1 | 0.75mi |
| 4917 S Karen St Oklahoma City, OK | 3.0 | 1.5 | 960 | $1,100 | $1.15 | 23d | 1 | 0.75mi |
| 4004 SE 45th Ter Oklahoma City, OK | 3.0 | 1.0 | 1006 | $995 | $0.99 | 23d | 1 | 0.76mi |
| 4101 SE 48th St Oklahoma City, OK | 3.0 | 1.0 | 974 | $1,245 | $1.28 | 16d | 1 | 0.77mi |
| 4016 SE 47th St Oklahoma City, OK | 3.0 | 1.5 | 1245 | $1,199 | $0.96 | 4d | 1 | 0.77mi |
| 3925 SE 59th St Oklahoma City, OK | 2.0 | 1.5 | 993 | $1,211 | $1.22 | 21d | 1 | 0.79mi |
| 4104 SE 45th Ter Oklahoma City, OK | 4.0 | 1.5 | 1111 | $1,275 | $1.15 | 2d | 1 | 0.82mi |
| 4900 S Dimple Dr Oklahoma City, OK | 3.0 | 1.5 | 1463 | $1,025 | $0.70 | 2d | 1 | 0.83mi |
| 4215 SE 53rd St Oklahoma City, OK | 1.0–2.0 | 1.0 | 769 | $915 | $1.19 | 23d | 1 | 0.91mi |
| 4220 SE 49th St Oklahoma City, OK | 3.0 | 2.0 | 1223 | $1,175 | $0.96 | 23d | 1 | 0.91mi |
| 4217 SE 48th Ter Oklahoma City, OK | 3.0 | 1.5 | 1043 | $1,295 | $1.24 | 23d | 1 | 0.92mi |
| 5537 S Sunnylane Rd Oklahoma City, OK | 1.0–2.0 | 1.0–1.5 | 840 | $850 | $1.01 | 2d | 11 | 0.96mi |
| 4309 SE 48th Ter Oklahoma City, OK | 3.0 | 2.0 | 1458 | $1,525 | $1.05 | 1d | 1 | 0.98mi |
| 4116 Overland Dr Oklahoma City, OK | 3.0 | 2.0 | 1363 | $1,500 | $1.10 | 1d | 1 | 1.03mi |
| 4900 Sunny Ct Oklahoma City, OK | 3.0 | 2.0 | 1281 | $1,600 | $1.25 | 3d | 1 | 1.03mi |
| 4305 S Nebraska Ave Oklahoma City, OK | 3.0 | 2.0 | 1145 | $1,200 | $1.05 | 43d | 1 | 1.28mi |
Listing history 16 events
-
2026-06-15days on market $127,000 Active 20 DOM
-
2026-06-13days on market $127,000 Active 18 DOM
-
2026-06-09days on market $127,000 Active 14 DOM
-
2026-06-08days on market $127,000 Active 13 DOM
-
2026-06-07days on market $127,000 Active 12 DOM
-
2026-06-05days on market $127,000 Active 9 DOM
-
2026-06-03days on market $127,000 Active 8 DOM
-
2026-06-02days on market $127,000 Active 7 DOM
-
2026-06-01days on market $127,000 Active 6 DOM
-
2026-05-31days on market $127,000 Active 5 DOM
-
2026-05-27$127,000 Active
-
2018-08-22soldstatus $73,000
-
2018-08-20soldstatus $73,000 Sold 588-char remark
Show marketing remark (588 chars)
Looking for a nicely updated affordable home in Oklahoma City? Then look no more. This house is a three bed with one and half bath. The house has all new floors, wood look vinyl in the kitchen, dining and bath with carpet throughout the rest of the house. This house lots of windows to let in plenty of natural light. The kitchen is updated with fresh paint and new countertops. The garage has plenty of room plus a carport out front. The backyard also has a storage unit to store all your stuff. The front and back yard are also filled with beautiful trees to make a backyard oasis.
-
2017-10-09status Pending 588-char remark
Show marketing remark (588 chars)
Looking for a nicely updated affordable home in Oklahoma City? Then look no more. This house is a three bed with one and half bath. The house has all new floors, wood look vinyl in the kitchen, dining and bath with carpet throughout the rest of the house. This house lots of windows to let in plenty of natural light. The kitchen is updated with fresh paint and new countertops. The garage has plenty of room plus a carport out front. The backyard also has a storage unit to store all your stuff. The front and back yard are also filled with beautiful trees to make a backyard oasis.
-
2017-10-02price $79,900 588-char remark
Show marketing remark (588 chars)
Looking for a nicely updated affordable home in Oklahoma City? Then look no more. This house is a three bed with one and half bath. The house has all new floors, wood look vinyl in the kitchen, dining and bath with carpet throughout the rest of the house. This house lots of windows to let in plenty of natural light. The kitchen is updated with fresh paint and new countertops. The garage has plenty of room plus a carport out front. The backyard also has a storage unit to store all your stuff. The front and back yard are also filled with beautiful trees to make a backyard oasis.
-
2017-08-25$84,900 Active 588-char remark
Show marketing remark (588 chars)
Looking for a nicely updated affordable home in Oklahoma City? Then look no more. This house is a three bed with one and half bath. The house has all new floors, wood look vinyl in the kitchen, dining and bath with carpet throughout the rest of the house. This house lots of windows to let in plenty of natural light. The kitchen is updated with fresh paint and new countertops. The garage has plenty of room plus a carport out front. The backyard also has a storage unit to store all your stuff. The front and back yard are also filled with beautiful trees to make a backyard oasis.
ⓘ Source: listings_history table (triggers on properties + properties_extension) + one-shot
backfill from property_details.listing_events for pre-trigger history.
Tax reassessment forecast OK · Resets to sale price
- Current annual tax
- $1,251 · $104/mo
- Projected year-2 tax
- $1,251 · $104/mo
- Expected delta
- $0/yr ($0/mo · 0.0%)
ⓘ Screening estimate from a state-policy table — verify with the county assessor before closing.
Climate risk First Street
- Flood 1/10 Low FEMA zone X (unshaded) · 0% chance over 30 yrs
- Wildfire 1/10 Low
- Heat 6/10 Major 7 d/yr ≥107°F today · 19 d/yr by 30 yrs out
- Wind 2/10 Low 4% chance of damaging wind over 30 yrs
- Air quality 1/10 Low 0 unhealthy d/yr today · 0 by 30 yrs out
Nearby sold comps map
Loading sold comps map…
Walkable amenities ~0.75 mi
Loading nearby amenities…
Taxation est. · year 1
- Rental income
- $16,187
- − Mortgage interest
- −$7,114
- − Property taxes
- −$1,251
- − Insurance
- −$635
- − Repairs & maintenance
- −$1,295
- − Management
- −$1,295
- − Depreciation
- −$3,695
- Taxable income
- $903
- Est. tax owed @ 24.0%
- −$217
- After-tax cash flow
- $2,693/yr
For passive investors: Depreciation is non-cash, so a rental often shows a tax loss while cash-flowing — sheltering income. Rental losses are passive: they offset passive income freely, and up to $25,000/yr can offset ordinary (W-2) income if you actively participate and your MAGI is under $100k (phasing out to $0 by $150k); unused losses carry forward. On sale, claimed depreciation is recaptured at up to 25%, and gains may owe capital-gains tax (a 1031 exchange can defer both). Figures are a year-1 estimate at your 24.0% rate — not tax advice; consult a CPA.
Schools (NCES district)
- District
- Oklahoma City
- NCES district ID
- 4022770
- Math proficiency
- 7% ▼ -5.00%
- Reading proficiency
- 10% ▼ -6.00%
- Median HH income
- $35,606
- Composite
- 7.0/100
- National rank
- #9970
- State rank
- #254 of 270 in OK
Livability — Oklahoma City
- Score
- 80/100
- State rank
- #3
- US rank
- #1635
Category grades
Schools grade is shown separately in the Schools card above.
Census & demographics
- Census place
- Oklahoma City, OK
- County
- Oklahoma County · 771,644 people
- City population
- 498,656
- Metro
- Oklahoma City, OK
- Population (ZIP)
- 22,022
- Household income
- $63,478
- Rent vs Own
- Severe rent burden
- 1083.0
Population outlook (Oklahoma County) Hauer SSP2
- Today (2025)
- 911,875 people
- By 2030
- 982,413 · +7.7%
- By 2040
- 1,130,468 · +24.0%
- By 2050
- 1,288,422 · +41.3%
- By 2075
- 1,711,482 · +87.7%
- By 2100
- 2,088,448 · +129.0%
Race, ethnicity, and origin ACS 2023
- Neighborhood character
- Highly diverse neighborhood (Simpson 0.73)
- Race & ethnicity
- White 41% Black 25% Hispanic / Latino 19% Two or more races 15% Asian 6% Native American 2%
- Hispanic origin (detail)
- Mexican 15%
- Common ancestry
- Italian 1% Lithuanian 1% Slovak 1%
- Foreign-born
- 9% · Canada, Vietnam
- Languages at home
- 83% English-only · Spanish 11% Vietnamese 3% Other Asian/Pacific 1%
Political lean MEDSL · Oklahoma
- 2024 margin
- Toss-up / Even · D 48.0% · R 49.7% · Other 2.3%
- 2008→2024 swing
- +15.1pp toward D · 2008: -16.8pp · 2024: -1.7pp
- All cycles
- 2024: R+1.7 2020: R+1.1 2016: R+10.5 2012: R+16.7 2008: R+16.8
Not yet ingested
- Civics
- —
Market trends
- HPI YoY
- ▼ -20.17%
- Current HPI
- 232.4241
- Rent YoY
- ▲ 4.76%
- Metro
- Oklahoma City, OK
- State GDP YoY
- ▲ 1.55%
- F500 in state
- 6
Industry mix (Fortune 500 HQ in OK)
| Industry | F500 HQs | Revenue |
|---|---|---|
| Energy | 3 | $48B |
|
||
Price history
+49.6% since first listed6 events — show timeline
- 2026-05-27 Listed $127,000 FSBO.com
- 2018-08-22 Sold (Public Records) $73,000 Public Records
- 2018-08-20 Sold (MLS) $73,000 MLSOK
- 2017-10-09 Pending — MLSOK
- 2017-10-02 Price Changed $79,900 MLSOK
- 2017-08-25 Listed $84,900 MLSOK
Property tax history
+7.8%/yrLatest (2025): $1,251 · +4.2% YoY. Source: county tax records.
Cash-flow waterfall
monthlySold comps — $/sqft
last 12 mo · ≤1 miLoading sold comps…