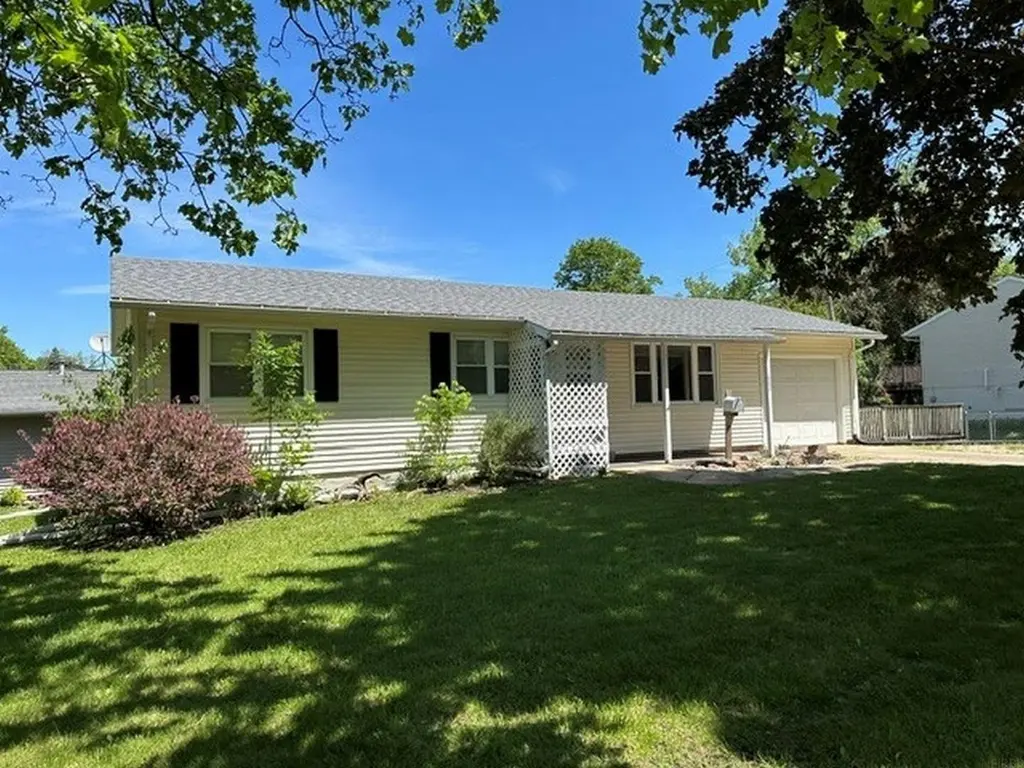
607 9th St · Charles City, IA
Flood risk 5/10 · Moderate
- FEMA flood zone
- X (unshaded)
- Chance of flooding over 30 yrs
- 0.65%
- Est. flood insurance / yr
- $473 – $860
Fire risk 2/10 · Minimal
- Est. fire insurance / yr
- $902 – $1,676
Heat risk 2/10 · Minimal
- Hot days now (above 103°F)
- 7 days/yr
- Hot days in 30 yrs
- 16 days/yr
Wind risk 2/10 · Minimal
- Chance of severe wind over 30 yrs
- —
Air-quality risk 1/10 · Minimal
- Unhealthy air days now
- 0 days/yr
- Unhealthy air days in 30 yrs
- 0 days/yr
Risk factors via First Street. Map © Google.
Why this score? — see what drove the B+ grade
The composite is a weighted blend of 9 inputs, each scored 0–100. Each bar is that input's sub-score; the figure is the points it added to the 100-point composite (weight × sub-score).
- Cash flow +30.0/30.0
- ARV discount +15.0/15.0
- DSCR +10.0/10.0
- 1% rule +8.4/10.0
- Schools +4.7/10.0
- Livability +3.9/5.0
- Rent growth +2.5/5.0
- Condition / age +2.5/5.0
- Appreciation +0.0/10.0
$100,000
🖨 Deal sheet 📄 Offer letter ✓ Due diligence
Listing remarks
Situated on a spacious corner lot, this well-maintained 3-bedroom, 1-bath ranch-style residence offers comfortable one-level living with an attached single-stall garage. Built in 1963, the home features approximately 1,435 finished square feet of living space. Interior highlights include a functional kitchen with adjacent dining area, main-level laundry combined with a three-quarter bath, and convenient access to the attached garage. Exterior amenities include low-maintenance vinyl siding, a partially fenced backyard, and a wood deck ideal for outdoor enjoyment and entertaining. Whether you are searching for your first home, looking to downsize, or seeking an affordable investment opportuni
Key facts
- Functional kitchen
- Wood deck
- Main-level laundry
Tags
Property features AI
Finance
- Other: Zoning: R-2
- Financial info: Financial details not provided
- HOA & community: Sidewalks in the community
Exterior
- Parking: Attached garage with garage door opener; One-car carport
- Security: Security features not specified
- Utilities: Public water; Public sewer
- Home design: Single-family residence; One story
- Construction: Vinyl siding; Asphalt roof; Basement with block construction; Basement includes sump pump; Below-grade finished area
- Exterior features: Deck; Fenced yard; Paved road access; Corner, level lot
Interior
- Kitchen: Dishwasher; Free-standing range; Refrigerator
- Bedrooms: Bedrooms not specified
- Flooring: Flooring not specified
- Bathrooms: 1 full bathroom
- Heating & cooling: Central air; Ceiling fan(s) for cooling; Forced air heating; Natural gas heating
- Interior features: Ceiling fans throughout
- Laundry & utility: Washer and dryer included; Main level laundry; Gas water heater
Neighborhood map
What this means for you Summary
Snapshot
- This is a 4-bed/2.5-bath single-family listed at $100k.
Deal economics
- At list price, monthly cash flow is $387 ($5k/yr) — positive.
- The deal already cash-flows at list — no discount required.
- Meets the 1% rule at list price ($1k rent vs $100k).
- Cap rate 10.9% vs local median 6.5% in Charles City — top-decile yield for the area; either an underpriced asset or a hidden risk that comps aren't pricing in. Stress-test before assuming the spread holds.
Location & tenants
- Location reads 77/100 on livability (#161 in IA, #2,944 nationally) — a middle-class / working-renter tenant base. Strengths: cost of living A+, health & safety A+, housing A; Watch: amenities F, commute F, employment F.
- Charles City Community School District (town): math 52% / reading 61% proficiency, ranked #262 of 289 in IA (top 91%) — acceptable for families but not a draw, mixed tenant base, ~2y average lease.
- Zoned schools: Charles City Ms (math 51% / reading 59%, grade B-, #201 of 246 statewide, top 82%, 423 students, 54% FRL); Charles City High School (math 47% / reading 67%, grade C, #279 of 336 statewide, top 85%, 534 students, 47% FRL).
- Market conditions: 70 active listings in the ZIP; 38 units permitted in Floyd County in 2024 (0 in 5+ unit buildings).
Forward outlook
- Local home prices are declining (-3.0%/yr); year-one equity from $691 of loan paydown is wiped out by about $3k of value loss. Plan a longer hold.
- Floyd County population projected to shrink 6% by 2050 — rents likely to lag national; underwrite the cash flow, not the appreciation.
- At projected returns (-3.0% appreciation + 3.0% rent growth), your $28k cash investment doubles in ~8 years — after that, you're playing with house money.
Negotiation context
- Only 5 days on market — expect competitive offers; lowballing is unlikely to land.
- Current owner paid $76k; 32% above their basis — modest negotiation headroom, anchor on the comps not their cost.
Risks & watch-outs
- Climate carrying-cost: moderate flood risk — expect insurance premiums to compound above CPI over the hold.
Questions for the listing agent
- Built in 1963 — when were the roof, HVAC, electrical panel, plumbing, and water heater last replaced?
- Is there a deadline driving the sale (1031 exchange, divorce, estate, relocation)? That informs how much negotiation room exists.
- What's the average days-on-market for RENTAL listings here right now (not sales)? A rising rental-DOM trend means longer vacancies and softer asking-rent achievability than the comps imply.
- What's the recent tenant-quality profile in this submarket — average credit score on applications, eviction rate, late-payment / NSF rate, and stable-employment percentage? A property-management company in the area should have these aggregated.
- How much new for-sale + rental construction is in the pipeline within 1–3 miles? Heavy new supply typically softens prices + rents 12–24 months out; constrained supply supports both.
Investment metrics
- 1% rule
- 1.34% ✓
- Cap rate
- 10.94%
- Cash-on-cash
- 16.60%
- DSCR
- 1.74
- GRM
- 6.2
CMA / ARV
- ARV (on-the-fly)
- $133,455
- Comps found
- 11
Show comp detail 11 sales within ~0.75 mi
| Address | Dist | Beds/Ba | Sqft | Sold | Price | $/sf | Match |
|---|---|---|---|---|---|---|---|
| 812 8th St | 0.21mi | 3/2.0 (-1) | 1,391 (-3%) | 8mo | $140,000 | $101 | 72 |
| 1007 Cedar St | 0.11mi | 3/1.5 (-1) | 1,508 (+5%) | 8mo | $129,000 | $86 | 71 |
| 1107 Hildreth St | 0.12mi | 3/3.0 (-1) | 1,322 (-8%) | 10mo | $122,500 | $93 | 66 |
| 800 8th Street St | 0.14mi | 3/2.0 (-1) | 1,302 (-9%) | 14mo | $125,000 | $96 | 59 |
| 911 Clinton St | 0.17mi | 3/2.0 (-1) | 1,344 (-6%) | 23mo | $192,000 | $143 | 56 |
| 903 S Johnson St | 0.29mi | 3/1.0 (-1) | 1,536 (+7%) | 11mo | $107,500 | $70 | 54 |
| 600 Freeman St | 0.45mi | 3/2.0 (-1) | 1,540 (+7%) | 8mo | $142,500 | $93 | 53 |
| 510 S Jackson St | 0.45mi | 3/1.5 (-1) | 1,334 (-7%) | 6mo | $155,000 | $116 | 53 |
| 708 Allison St | 0.41mi | 4/2.5 | 1,644 (+15%) | 21mo | $122,000 | $74 | 39 |
| 1204 Grove St | 0.73mi | 3/2.0 (-1) | 1,456 (+2%) | 22mo | $130,000 | $89 | 38 |
| 301 S Joslin St | 0.74mi | 3/2.0 (-1) | 1,456 (+2%) | 22mo | $165,000 | $113 | 38 |
Match score weights: distance 35% · size 25% · config 20% · recency 20%. Top-matched comps best support the ARV.
Projected returns pro-forma
-3.0% appreciation · 3.0% rent growth · sell at horizon
- IRR
- 7.7%
- Equity multiple
- 1.30×
- Total profit
- $8,473
- Equity at exit
- $14,910
- IRR
- 17.0%
- Equity multiple
- 2.40×
- Total profit
- $39,178
- Equity at exit
- $8,646
Cash invested: $28,000 (down + closing). Projections, not guarantees.
Landlord ↔ Tenant lean methodology
- Overall (STATE)
- 83 Strongly Landlord-Friendly
- State Iowa
- 83 Strongly Landlord-Friendly · R+6
- County
- — inherits STATE
- City
- — inherits STATE
ZIP-level market 50616
- Home prices YoY
- -19.7%
- Active inventory
- 70
- Price-to-rent
- 6.2×
Monthly cashflow live
- Estimated rent
- $1,341 medium interval (Pro) →
- Mortgage (P&I)
- −$524
- Tax from tax record
- −$106 /mo · $1,274/yr
- Insurance
- −$42
- HOA
- −$0
- Vacancy / Maint / Mgmt
- −$282
- Net cashflow
- $387
Break-even live
UW: 25.0% down · 7.5% · 30yr · 1.5% tax · 5.0% vac · 8.0% maint · 8.0% mgmt
Financing live
Cash to close
- Down payment
- $25,000
- Closing costs
- $3,000
- Reserves months
- —
- Total cash needed
- —
Loan-product check · same deal, 3 products live
Conventional
25% down · 7.5% · 30yr
- Down + closing
- —
- Monthly P&I
- —
- Monthly cashflow
- —
- DSCR
- —
- Eligible?
- —
Personal DTI + credit; lowest rate.
DSCR
20% down · 8.5% · 30yr
- Down + closing
- —
- Monthly P&I
- —
- Monthly cashflow
- —
- DSCR
- —
- Eligible?
- —
No personal income docs; deal must DSCR.
Hard money
10% down · 12.0% · 12mo
- Down + closing
- —
- Monthly P&I
- —
- Monthly cashflow
- —
- DSCR
- —
- Eligible?
- —
Short-term bridge; refi at stabilization.
Listing history 5 events
-
2026-06-14status $100,000 Pending 5 DOM
-
2026-06-13days on market $100,000 Active 5 DOM
-
2026-06-12days on market $100,000 Active 4 DOM
-
2026-06-09remarks 699-char remark
-
2026-06-09$100,000 Active 1 DOM
ⓘ Source: listings_history table (triggers on properties + properties_extension) + one-shot
backfill from property_details.listing_events for pre-trigger history.
Tax reassessment forecast IA · Partial reset (capped growth)
- Current annual tax
- $1,274 · $106/mo
- Projected year-2 tax
- $1,422 · $118/mo
- Expected delta
- +$148/yr (+$12/mo · 11.6%)
ⓘ Screening estimate from a state-policy table — verify with the county assessor before closing.
Climate risk First Street
- Flood 5/10 Major FEMA zone X (unshaded) · 65% chance over 30 yrs
- Wildfire 2/10 Low
- Heat 2/10 Low 7 d/yr ≥103°F today · 16 d/yr by 30 yrs out
- Wind 2/10 Low
- Air quality 1/10 Low 0 unhealthy d/yr today · 0 by 30 yrs out
Nearby sold comps map
Loading sold comps map…
Walkable amenities ~0.75 mi
Loading nearby amenities…
Taxation est. · year 1
- Rental income
- $16,095
- − Mortgage interest
- −$5,602
- − Property taxes
- −$1,274
- − Insurance
- −$500
- − Repairs & maintenance
- −$1,288
- − Management
- −$1,288
- − Depreciation
- −$2,909
- Taxable income
- $3,235
- Est. tax owed @ 24.0%
- −$776
- After-tax cash flow
- $3,871/yr
For passive investors: Depreciation is non-cash, so a rental often shows a tax loss while cash-flowing — sheltering income. Rental losses are passive: they offset passive income freely, and up to $25,000/yr can offset ordinary (W-2) income if you actively participate and your MAGI is under $100k (phasing out to $0 by $150k); unused losses carry forward. On sale, claimed depreciation is recaptured at up to 25%, and gains may owe capital-gains tax (a 1031 exchange can defer both). Figures are a year-1 estimate at your 24.0% rate — not tax advice; consult a CPA.
Schools (NCES district)
- District
- Charles City Community School District
- NCES district ID
- 1907080
- Math proficiency
- 52% ▼ -3.00%
- Reading proficiency
- 61% ▲ 9.00%
- Median HH income
- $41,414
- Composite
- 47.32/100
- National rank
- #2299
- State rank
- #262 of 289 in IA
Livability — Charles City
- Score
- 77/100
- State rank
- #161
- US rank
- #2944
Category grades
Schools grade is shown separately in the Schools card above.
Census & demographics
- Census place
- Charles City, IA
- City population
- 9,419
- Population (ZIP)
- 9,419
Population outlook (Floyd County) Hauer SSP2
- Today (2025)
- 15,524 people
- By 2030
- 15,254 · -1.7%
- By 2040
- 14,830 · -4.5%
- By 2050
- 14,660 · -5.6%
- By 2075
- 15,548 · +0.2%
- By 2100
- 17,406 · +12.1%
Race, ethnicity, and origin ACS 2023
- Neighborhood character
- Predominantly White (87%)
- Race & ethnicity
- White 87% Two or more races 6% Hispanic / Latino 5% Asian 2% Black 2%
- Hispanic origin (detail)
- Mexican 4%
- Common ancestry
- Portuguese 6% Scandinavian 2% Lithuanian 2%
- Foreign-born
- 5% · Canada
- Languages at home
- 94% English-only · Spanish 2% Other Asian/Pacific 1% Tagalog/Filipino 1%
Political lean MEDSL · Floyd
- 2024 margin
- Strong R (+25.7) · D 36.5% · R 62.2% · Other 1.3%
- 2008→2024 swing
- -47.6pp toward R · 2008: 21.9pp · 2024: -25.7pp
- All cycles
- 2024: R+25.7 2020: R+19.4 2016: R+14.9 2012: D+14.7 2008: D+21.9
Not yet ingested
- Civics
- —
Market trends
- HPI YoY
- ▼ -46.03%
- Current HPI
- 187.4742
- Rent YoY
- —
- Metro
- —
- State GDP YoY
- ▲ 2.48%
- F500 in state
- 4
Industry mix (Fortune 500 HQ in IA)
| Industry | F500 HQs | Revenue |
|---|---|---|
| Financial Services | 1 | $16B |
|
||
| Retail / Convenience | 1 | $15B |
|
||
Price history
+32.5% since first listed2 events — show timeline
- 2026-06-08 Listed $100,000 NEIRBR as distributed by MLS GRID
- 2001-10-17 Sold (Public Records) $75,500 Public Records
Property tax history
-0.6%/yrLatest (2025): $1,274 · +0.8% YoY. Source: county tax records.
Cash-flow waterfall
monthlySold comps — $/sqft
last 12 mo · ≤1 miLoading sold comps…