 🏗️ New Construction
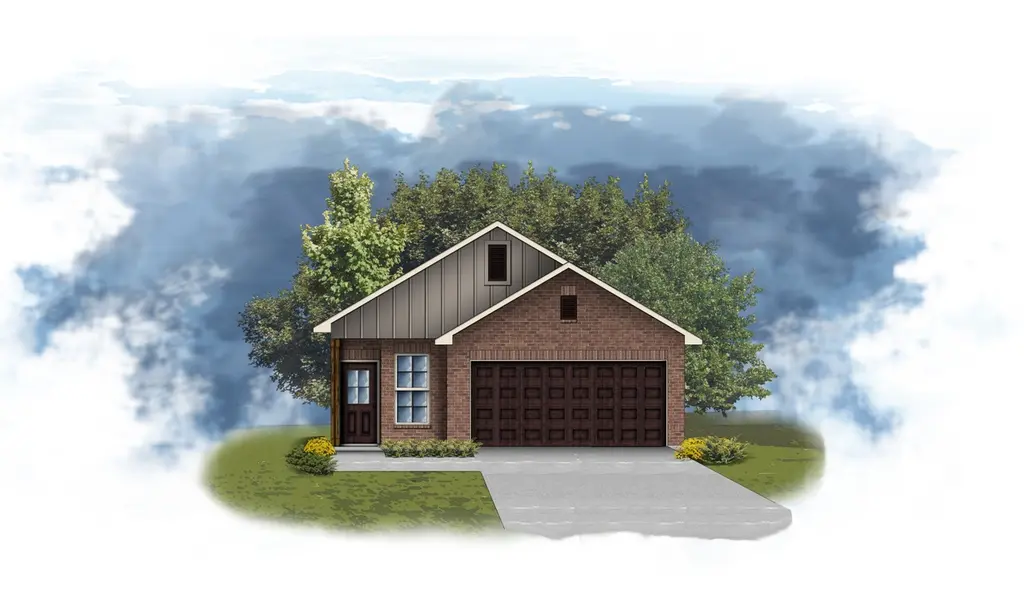
Idlewood II H Plan · Magnolia, TX
Flood risk No data
- FEMA flood zone
- —
- Chance of flooding over 30 yrs
- —
- Est. flood insurance / yr
- —
Fire risk No data
- Est. fire insurance / yr
- —
Heat risk No data
- Hot days now (above threshold)
- —
- Hot days in 30 yrs
- —
Wind risk No data
- Chance of severe wind over 30 yrs
- —
Air-quality risk No data
- Unhealthy air days now
- —
- Unhealthy air days in 30 yrs
- —
Risk factors via First Street. Map © Google.
Why this score? — see what drove the D+ grade
The composite is a weighted blend of 9 inputs, each scored 0–100. Each bar is that input's sub-score; the figure is the points it added to the 100-point composite (weight × sub-score).
- Appreciation +10.0/10.0
- Cash flow +9.5/30.0
- ARV discount +7.5/15.0
- Schools +3.9/10.0
- Condition / age +3.8/5.0
- Livability +3.7/5.0
- 1% rule +2.9/10.0
- DSCR +2.7/10.0
- Rent growth +2.6/5.0
$239,990
🖨 Deal sheet (PDF) 📄 Offer letter ✓ Due diligence
Listing remarks MLS
The Idlewood II H Floor Plan by DSLD Homes offers modern living at its finest, blending style, comfort, and energy efficiency into a beautifully designed home. With 3 spacious bedrooms and 2 full bathrooms across 1,392 square feet, this layout provides the ideal space for growing families and those who love to entertain. Exterior features include elegant brick siding, a covered rear patio perfect for outdoor relaxation, and a two-car garage. Inside, you'll find an open-concept floor plan with recessed lighting in the kitchen and living areas, a walk-in pantry for ample storage, and a convenient boot bench in the mudroom. The master suite is a private retreat, complete with a double vanity, separate walk-in shower, and large walk-in closet. Thoughtfully designed for everyday functionality and long-term value, the Idlewood II H combines high-quality craftsmanship with the signature energy efficiency DSLD Homes is known for.
Key facts
- 2 garage spots
- Listed 470 days
Neighborhood map
What this means for you Summary
Snapshot
- This is a 3-bed/2.0-bath single-family listed at $240k. Condition is rated good.
Deal economics
- At list price, monthly cash flow is $-186 ($-2k/yr) — negative.
- To cash-flow at today's rent, offer at most $237k (1.1% below list).
- To meet the 1% rule (rent ≥ 1% of price), the offer needs to be $208k (13.5% below list).
- Recommended offer: $208k (13.5% below list) — sets the bar for 1% rule.
- Cap rate 5.4% vs local median 3.4% in Magnolia — top-decile yield for the area; either an underpriced asset or a hidden risk that comps aren't pricing in. Stress-test before assuming the spread holds.
Location & tenants
- Location reads 73/100 on livability (#222 in TX) — a middle-class / working-renter tenant base. Strengths: crime A+, cost of living A+, housing A+; Watch: schools D+, amenities F, commute F.
- Magnolia ISD (rural): math 42% / reading 45% proficiency, ranked #247 of 826 in TX (top 30%) — families likely to look elsewhere, expect single-tenant / working-renter base with shorter leases.
- Market conditions: Rents flat; 1604 active listings in the ZIP; 4 comparable units currently listed for rent nearby; rentals leasing fast (median 11d on market — plan ~1-2 weeks tenant-placement turnaround); high-income renter base; 13,259 units permitted in Montgomery County in 2024 (1,402 in 5+ unit buildings).
Forward outlook
- In year one you build about $28k of equity ($2k loan paydown + $26k appreciation (10.0% local appreciation)).
- Montgomery County population projected at +65% by 2050 — long-run rental-demand tailwind backs the buy-and-hold thesis.
- By year 2, paydown + projected appreciation supports a ~$45k cash-out refi (75% LTV) — recoverable capital for the next deal without selling this one.
Negotiation context
- It's been on market 471 days — a 12% lower offer ($211k) is reasonable based on typical stale-listing flexibility.
Questions for the listing agent
- What do current leases actually rent for vs. the listed asking? Can we see a recent rent roll and the last 12 months of T-12 income?
- It's been on market 471 days. Have you received any prior offers? Is the seller open to a 13% concession, seller financing, or rate buy-down credit?
- Why hasn't it sold? Are there any deal-killer items the seller is aware of (foundation, flood, title, zoning, code violations)?
- Is there a deadline driving the sale (1031 exchange, divorce, estate, relocation)? That informs how much negotiation room exists.
- Schools are D-rated, which usually means shorter tenancies and higher turnover. Who's the typical renter profile here, and what's been the actual vacancy rate?
- The area grade is low — what's the realistic commute time and amenity access for the typical tenant pool here? Any planned neighborhood developments (good or bad) we should know about?
- What's the average days-on-market for RENTAL listings here right now (not sales)? A rising rental-DOM trend means longer vacancies and softer asking-rent achievability than the comps imply.
- What's the recent tenant-quality profile in this submarket — average credit score on applications, eviction rate, late-payment / NSF rate, and stable-employment percentage? A property-management company in the area should have these aggregated.
- How much new for-sale + rental construction is in the pipeline within 1–3 miles? Heavy new supply typically softens prices + rents 12–24 months out; constrained supply supports both.
Investment metrics
- 1% rule
- 0.79% ✗
- Cap rate
- 5.45%
- Cash-on-cash
- -3.02%
- DSCR
- 0.87
- GRM
- 10.6
CMA / ARV
- ARV (median comp)
- $264,249
- List price
- $239,990
- Delta
- -9.18%
- Verdict
- FAIR
- Comps
- 20 within 1.0 mi
Show comp detail 12 sales within ~0.75 mi
| Address | Dist | Beds/Ba | Sqft | Sold | Price | $/sf | Match |
|---|---|---|---|---|---|---|---|
| 40635 Mostyn Lake Dr | 0.07mi | 3/2.0 | 1,479 (+6%) | 6mo | $267,990 | $181 | 81 |
| 12975 Daniel Springs Ln | 0.12mi | 3/2.0 | 1,479 (+6%) | 4mo | $267,990 | $181 | 81 |
| 12846 Hannah Springs Ln | 0.13mi | 3/2.0 | 1,475 (+6%) | 12mo | $272,360 | $185 | 74 |
| 12963 Daniel Springs Ln | 0.13mi | 3/2.0 | 1,242 (-11%) | 3mo | $256,990 | $207 | 74 |
| 13082 Sarah Springs Way | 0.18mi | 3/2.0 | 1,518 (+9%) | 5mo | $244,990 | $161 | 72 |
| 40723 Mostyn Lake Dr | 0.19mi | 3/2.0 | 1,518 (+9%) | 6mo | $252,990 | $167 | 72 |
| 13070 Sarah Springs Way | 0.19mi | 3/2.0 | 1,518 (+9%) | 8mo | $239,990 | $158 | 70 |
| 12759 Dina Springs Ln | 0.06mi | 4/2.0 (+1) | 1,597 (+15%) | 1mo | $268,990 | $168 | 67 |
| 40700 Pessi Rd | 0.24mi | 3/2.0 | 1,240 (-11%) | 6mo | $239,990 | $194 | 66 |
| 40769 Mostyn Lake Dr | 0.21mi | 3/2.0 | 1,518 (+9%) | 11mo | $239,990 | $158 | 66 |
| 40688 Pessi Rd | 0.23mi | 3/2.0 | 1,242 (-11%) | 11mo | $234,990 | $189 | 62 |
| 40784 Mostyn Lake Dr | 0.25mi | 4/2.0 (+1) | 1,598 (+15%) | 8mo | $264,990 | $166 | 52 |
Match score weights: distance 35% · size 25% · config 20% · recency 20%. Top-matched comps best support the ARV.
Projected returns pro-forma
10.0% appreciation · 0.32% rent growth · sell at horizon
- IRR
- 21.3%
- Equity multiple
- 2.71×
- Total profit
- $126,648
- Equity at exit
- $238,057
- IRR
- 18.7%
- Equity multiple
- 6.03×
- Total profit
- $372,441
- Equity at exit
- $513,378
Cash invested: $73,990 (down + closing). Projections, not guarantees.
Landlord ↔ Tenant lean methodology
- Overall (STATE)
- 87 Strongly Landlord-Friendly
- State Texas
- 87 Strongly Landlord-Friendly · R+5
- County
- — inherits STATE
- City
- — inherits STATE
ZIP-level market 77354
- Home prices YoY
- 2.4%
- Rents YoY
- 0.3%
- Active inventory
- 1604
- Price-to-rent
- 9.6×
Monthly cashflow live
- Estimated rent
- $2,076 medium interval (Pro) →
- Mortgage (P&I)
- −$1,386
- Tax est. 1.5%
- −$330 /mo · $3,964/yr
- Insurance
- −$110
- HOA
- −$0
- Vacancy / Maint / Mgmt
- −$436
- Net cashflow
- $-186
Break-even live
Sensitivity live
| Price | -10% $-3 | -5% $-95 | +0% $-186 | +5% $-277 | +10% $-369 |
|---|---|---|---|---|---|
| Rent | -10% $-350 | -5% $-268 | +0% $-186 | +5% $-104 | +10% $-22 |
| Rate | -1.0pp $-53 | -0.5pp $-119 | base $-186 | +0.5pp $-254 | +1.0pp $-324 |
UW: 25.0% down · 7.5% · 30yr · 1.5% tax · 5.0% vac · 8.0% maint · 8.0% mgmt
Financing live
Cash to close
- Down payment
- $66,062
- Closing costs
- $7,927
- Reserves months
- —
- Total cash needed
- —
Loan-product check · same deal, 3 products live
Conventional
25% down · 7.5% · 30yr
- Down + closing
- —
- Monthly P&I
- —
- Monthly cashflow
- —
- DSCR
- —
- Eligible?
- —
Personal DTI + credit; lowest rate.
DSCR
20% down · 8.5% · 30yr
- Down + closing
- —
- Monthly P&I
- —
- Monthly cashflow
- —
- DSCR
- —
- Eligible?
- —
No personal income docs; deal must DSCR.
Hard money
10% down · 12.0% · 12mo
- Down + closing
- —
- Monthly P&I
- —
- Monthly cashflow
- —
- DSCR
- —
- Eligible?
- —
Short-term bridge; refi at stabilization.
Rent comps 4 comps
| Address | Beds | Baths | Sqft | Rent | $/sqft | DOM | Units | Dist |
|---|---|---|---|---|---|---|---|---|
| 40700 Pessi Rd Magnolia, TX | 3.0 | 2.0 | 1240 | $2,100 | $1.69 | 44d | 1 | 0.21mi |
| 4255 Magnolia Village Dr Unit 2228 Magnolia, TX | 2.0 | 2.0 | 1131 | $1,792 | $1.58 | 3d | 1 | 1.18mi |
| 4255 Magnolia Village Dr Unit 4292 Magnolia, TX | 2.0 | 2.0 | 1131 | $1,824 | $1.61 | 11d | 1 | 1.18mi |
| 4225 Magnolia Village Dr Magnolia, TX | 1.0–2.0 | 1.0–2.0 | 994 | $1,992 | $2.00 | 2d | 31 | 1.23mi |
Listing history 15 events
-
2026-06-18days on market $239,990 Active 471 DOM
-
2026-06-17days on market $239,990 Active 470 DOM
-
2026-06-16days on market $239,990 Active 469 DOM
-
2026-06-15days on market $239,990 Active 468 DOM
-
2026-06-13days on market $239,990 Active 466 DOM
-
2026-06-09days on market $239,990 Active 462 DOM
-
2026-06-08days on market $239,990 Active 461 DOM
-
2026-06-07days on market $239,990 Active 460 DOM
-
2026-06-04days on market $239,990 Active 457 DOM
-
2026-06-03days on market $239,990 Active 456 DOM
-
2026-06-02days on market $239,990 Active 455 DOM
-
2026-06-01days on market $239,990 Active 454 DOM
-
2026-05-31days on market $239,990 Active 453 DOM
-
2026-01-29price $239,990 935-char remark
Show marketing remark (935 chars)
The Idlewood II H Floor Plan by DSLD Homes offers modern living at its finest, blending style, comfort, and energy efficiency into a beautifully designed home. With 3 spacious bedrooms and 2 full bathrooms across 1,392 square feet, this layout provides the ideal space for growing families and those who love to entertain. Exterior features include elegant brick siding, a covered rear patio perfect for outdoor relaxation, and a two-car garage. Inside, you'll find an open-concept floor plan with recessed lighting in the kitchen and living areas, a walk-in pantry for ample storage, and a convenient boot bench in the mudroom. The master suite is a private retreat, complete with a double vanity, separate walk-in shower, and large walk-in closet. Thoughtfully designed for everyday functionality and long-term value, the Idlewood II H combines high-quality craftsmanship with the signature energy efficiency DSLD Homes is known for.
-
2025-03-05$263,990 Active 935-char remark
Show marketing remark (935 chars)
The Idlewood II H Floor Plan by DSLD Homes offers modern living at its finest, blending style, comfort, and energy efficiency into a beautifully designed home. With 3 spacious bedrooms and 2 full bathrooms across 1,392 square feet, this layout provides the ideal space for growing families and those who love to entertain. Exterior features include elegant brick siding, a covered rear patio perfect for outdoor relaxation, and a two-car garage. Inside, you'll find an open-concept floor plan with recessed lighting in the kitchen and living areas, a walk-in pantry for ample storage, and a convenient boot bench in the mudroom. The master suite is a private retreat, complete with a double vanity, separate walk-in shower, and large walk-in closet. Thoughtfully designed for everyday functionality and long-term value, the Idlewood II H combines high-quality craftsmanship with the signature energy efficiency DSLD Homes is known for.
ⓘ Source: listings_history table (triggers on properties + properties_extension) + one-shot
backfill from property_details.listing_events for pre-trigger history.
Nearby sold comps map
Loading sold comps map…
Walkable amenities ~0.75 mi
Loading nearby amenities…
Taxation est. · year 1
- Rental income
- $24,914
- − Mortgage interest
- −$14,802
- − Property taxes
- −$3,964
- − Insurance
- −$1,321
- − Repairs & maintenance
- −$1,993
- − Management
- −$1,993
- − Depreciation
- −$7,687
- Taxable loss
- −$6,847
- Est. tax savings @ 24.0%
- +$1,643
- After-tax cash flow
- $-589/yr
For passive investors: Depreciation is non-cash, so a rental often shows a tax loss while cash-flowing — sheltering income. Rental losses are passive: they offset passive income freely, and up to $25,000/yr can offset ordinary (W-2) income if you actively participate and your MAGI is under $100k (phasing out to $0 by $150k); unused losses carry forward. On sale, claimed depreciation is recaptured at up to 25%, and gains may owe capital-gains tax (a 1031 exchange can defer both). Figures are a year-1 estimate at your 24.0% rate — not tax advice; consult a CPA.
Condition & rehab AI · 1 photo
This Idlewood II H Plan home is in good condition with minimal repairs needed. Painting and landscaping improvements would significantly enhance its curb appeal and value.
Value-add opportunities
- Both Painting exterior and interior — Enhances curb appeal and interior aesthetics
- Both Landscaping improvements — Enhances curb appeal and adds value
- Both New flooring in bathrooms and kitchen — Improves functionality and aesthetics
- Both New windows and doors — Enhances energy efficiency and curb appeal
Renovation cost estimate screening
Value-add ROI direction
- Both Painting exterior and interior — Enhances curb appeal and interior aesthetics ↑
- Both Landscaping improvements — Enhances curb appeal and adds value ↑
- Both New flooring in bathrooms and kitchen — Improves functionality and aesthetics ↑
- Both New windows and doors — Enhances energy efficiency and curb appeal ↑
ⓘ Cost ranges are severity-bucket heuristics (US national rule-of-thumb). Get contractor quotes + a written scope before underwriting a rehab budget.
Schools (NCES district)
- District
- Magnolia ISD
- NCES district ID
- 4828740
- Math proficiency
- 42% ▼ -7.00%
- Reading proficiency
- 45% ▼ -4.00%
- Median HH income
- $71,692
- Composite
- 39.46/100
- National rank
- #3958
- State rank
- #247 of 826 in TX
Livability — Magnolia
- Score
- 73/100
- State rank
- #222
- US rank
- #5442
Category grades
Schools grade is shown separately in the Schools card above.
Census & demographics
- County
- Montgomery County · 663,713 people
- City population
- 32,847
- Metro
- Houston-The Woodlands-Sugar Land, TX
- Population (ZIP)
- 44,900
- Household income
- $112,504
- Rent vs Own
- Severe rent burden
- 586.0
Population outlook (Montgomery County) Hauer SSP2
- Today (2025)
- 713,896 people
- By 2030
- 805,263 · +12.8%
- By 2040
- 992,708 · +39.1%
- By 2050
- 1,179,590 · +65.2%
- By 2075
- 1,628,084 · +128.1%
- By 2100
- 1,937,880 · +171.5%
Race, ethnicity, and origin ACS 2023
- Neighborhood character
- Predominantly White (66%)
- Race & ethnicity
- White 66% Hispanic / Latino 25% Two or more races 18% Black 3% Asian 1%
- Hispanic origin (detail)
- Mexican 14% Puerto Rican 1%
- Common ancestry
- Lithuanian 4% Slovak 2% Italian 2%
- Foreign-born
- 11% · Canada, Vietnam
- Languages at home
- 83% English-only · Spanish 15% Other Indo-European 1% German/W. Germanic 1%
Political lean MEDSL · Montgomery
- 2024 margin
- Solid R (+45.5) · D 26.8% · R 72.3%
- 2008→2024 swing
- +7.2pp toward D · 2008: -52.7pp · 2024: -45.5pp
- All cycles
- 2024: R+45.5 2020: R+43.8 2016: R+51.4 2012: R+60.7 2008: R+52.7
Not yet ingested
- Civics
- —
Market trends
- HPI YoY
- ▲ 12.09%
- Current HPI
- 512.87
- Rent YoY
- ▲ 0.32%
- Metro
- Houston-The Woodlands-Sugar Land, TX
- State GDP YoY
- ▲ 3.95%
- F500 in state
- 110
Industry mix (Fortune 500 HQ in TX)
| Industry | F500 HQs | Revenue |
|---|---|---|
| Energy | 16 | $1,198B |
|
||
| Technology | 5 | $198B |
|
||
| Engineering / Construction | 4 | $72B |
|
||
| Energy Services | 3 | $60B |
|
||
| Utilities | 3 | $41B |
|
||
| Healthcare | 2 | $330B |
|
||
Price history
-9.1% since first listed2 events — show timeline
- 2026-01-29 Price Changed $239,990 Zillow
- 2025-03-05 Listed $263,990 Zillow
Cash-flow waterfall
monthlySold comps — $/sqft
last 12 mo · ≤1 miLoading sold comps…