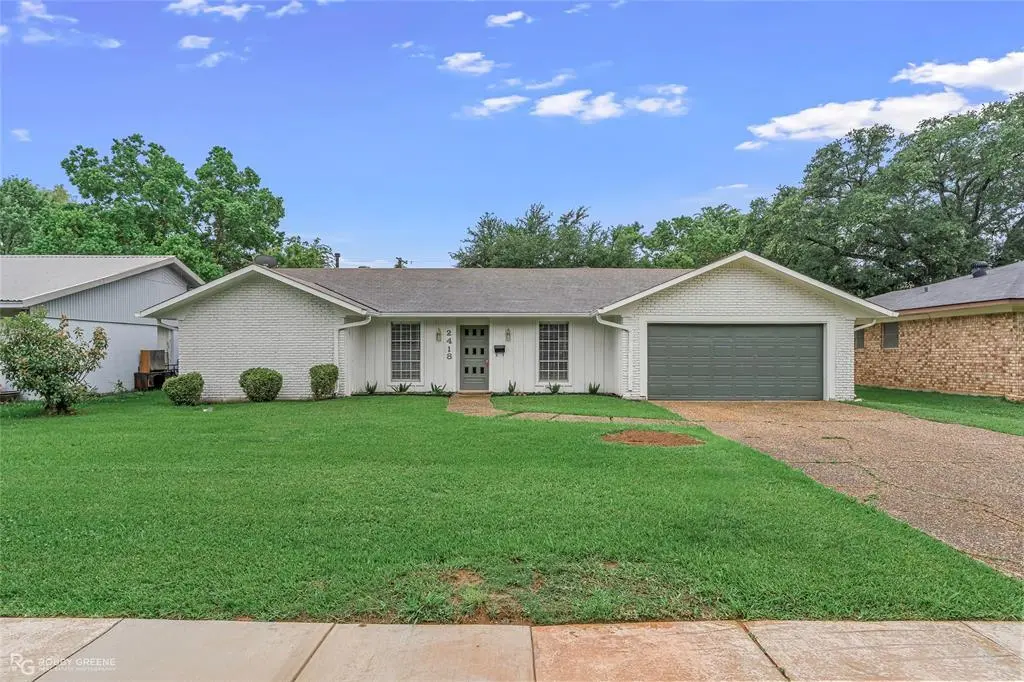
2418 Melrose Ave · Bossier City, LA
Flood risk 4/10 · Minor
- FEMA flood zone
- X (shaded)
- Chance of flooding over 30 yrs
- 0.22%
- Est. flood insurance / yr
- $507 – $1,088
Fire risk 1/10 · Minimal
- Est. fire insurance / yr
- $1,269 – $2,357
Heat risk 7/10 · Major
- Hot days now (above 110°F)
- 7 days/yr
- Hot days in 30 yrs
- 22 days/yr
Wind risk 6/10 · Moderate
- Chance of severe wind over 30 yrs
- 60.0%
Air-quality risk 2/10 · Minimal
- Unhealthy air days now
- 1 days/yr
- Unhealthy air days in 30 yrs
- 2 days/yr
Risk factors via First Street. Map © Google.
Why this score? — see what drove the D grade
The composite is a weighted blend of 9 inputs, each scored 0–100. Each bar is that input's sub-score; the figure is the points it added to the 100-point composite (weight × sub-score).
- Cash flow +14.7/30.0
- ARV discount +6.9/15.0
- DSCR +4.5/10.0
- Rent growth +4.1/5.0
- Schools +3.8/10.0
- Livability +3.6/5.0
- 1% rule +3.1/10.0
- Condition / age +2.5/5.0
- Appreciation +0.0/10.0
$215,000
🖨 Deal sheet 📄 Offer letter ✓ Due diligence
Listing remarks
Welcome home to this absolute showstopper! This top-to-bottom remodel perfectly blends modern chic with cozy charm. The Heart of the HomeCook like a pro in your stunning new kitchen! It features sparkling granite countertops, a brand-new sink, and high-end appliances—including a double oven perfect for holiday hosting. Spa-Like RetreatsBoth full bathrooms have been transformed with custom tile showers, elegant granite vanities, and all-new plumbing from the pipes to the faucets. Fresh & BrightDesigner Touch: New light fixtures and fresh paint inside and out. Space to Grow: Four spacious bedrooms and a formal dining room. Bonus Storage: A massive utility room with enough space fo
Key facts
- New kitchen
- Custom tile showers
- Massive utility room
Tags
Property features AI
Finance
- Other: Subdivision: Greenacres Sub; Directions: On Melrose between Airline and Benton road
- Financial info: Treat as clear loan type; No second mortgage
- HOA & community: No HOA / association
Exterior
- Parking: Attached 2-car garage; 2 covered parking spaces; Driveway
- Utilities: City water; City sewer; Electricity connected; Individual gas meter; Natural gas available; Concrete, curbs and sidewalk available
- Home design: Single-family residence; One story; Property attached: Yes
- Construction: Brick construction; Asphalt roof; Slab foundation; Built in 1970 (preowned)
- Exterior features: Covered porch; Covered patio/porch; Back yard fencing; Chain link fence; Lot less than 0.5 acre
Interior
- Kitchen: Dishwasher; Disposal; Gas cooktop; Gas oven; Microwave
- Bedrooms: Primary bedroom on main level; Total of 4 bedrooms
- Flooring: Carpet; Ceramic tile
- Bathrooms: 2 full bathrooms
- Heating & cooling: Central heating; Central air; Ceiling fan(s)
- Interior features: Cathedral ceilings; Decorative lighting; Granite counters; Kitchen island; Cable TV available; High-speed internet available; Window coverings
- Laundry & utility: Utility room
Neighborhood map
What this means for you Summary
Snapshot
- This is a 4-bed/2.0-bath single-family listed at $215k.
Deal economics
- At list price, monthly cash flow is $55 ($657/yr) — positive.
- The deal already cash-flows at list — no discount required.
- To meet the 1% rule (rent ≥ 1% of price), the offer needs to be $174k (19.0% below list).
- Recommended offer: $174k (19.0% below list) — sets the bar for 1% rule.
- Cap rate 6.6% vs local median 4.7% in Bossier City — top-decile yield for the area; either an underpriced asset or a hidden risk that comps aren't pricing in. Stress-test before assuming the spread holds.
Location & tenants
- Location reads 71/100 on livability (#47 in LA) — a middle-class / working-renter tenant base. Strengths: commute A+, cost of living A+, housing A+; Watch: employment D+, crime F, amenities F.
- Bossier Parish (urban): math 40% / reading 47% proficiency, ranked #17 of 98 in LA (top 17%) — families likely to look elsewhere, expect single-tenant / working-renter base with shorter leases.
- Zoned schools: Bossier Elementary School (math 8% / reading 17%, grade F, #550 of 646 statewide, top 88%, 222 students, 93% FRL) — zoned schools average 93% FRL vs 41% district-wide (52 pts higher); higher-poverty schools than district average — tighter screening recommended.
- Zoned-school proficiency averages 12% at this address vs 44% district-wide (-31 pts) — the specific schools serving this property underperform the Bossier Parish average; the district grade overstates school quality for this exact location.
- Market conditions: Rents rising fast (+6.6%/yr); 421 active listings in the ZIP; 6 comparable units currently listed for rent nearby; rentals at typical pace (median 21d on market — plan ~3-4 weeks tenant-placement turnaround); 716 units permitted in Bossier Parish in 2024 (0 in 5+ unit buildings).
- This rent runs 32% of the median local income ($65k/yr) — at the standard rent-burdened threshold; future hikes will face affordability resistance.
Forward outlook
- Local home prices are declining (-3.0%/yr); year-one equity from $1k of loan paydown is wiped out by about $6k of value loss. Plan a longer hold.
- Bossier County population projected at +28% by 2050 — long-run rental-demand tailwind backs the buy-and-hold thesis.
Negotiation context
- It's been on market 32 days — a 3% lower offer ($209k) is reasonable based on typical stale-listing flexibility.
Risks & watch-outs
- Climate carrying-cost: major wind risk, 60% chance of damaging wind over 30y; extreme-heat days projected 7→22/yr by 2055 (HVAC capex compounding) — expect insurance premiums to compound above CPI over the hold.
Questions for the listing agent
- It's been on market 32 days. Have you received any prior offers? Is the seller open to a 19% concession, seller financing, or rate buy-down credit?
- Built in 1970 — when were the roof, HVAC, electrical panel, plumbing, and water heater last replaced?
- Is there a deadline driving the sale (1031 exchange, divorce, estate, relocation)? That informs how much negotiation room exists.
- Schools are B-rated — typically a magnet for longer-tenancy family renters. What's the average tenant stay here, and is there a school-zone premium baked into asking?
- Crime grade is F in this area — have there been break-ins, vandalism, or insurance claims at this property in the last 3 years? What carrier currently insures it and at what premium?
- The area grade is low — what's the realistic commute time and amenity access for the typical tenant pool here? Any planned neighborhood developments (good or bad) we should know about?
- What's the average days-on-market for RENTAL listings here right now (not sales)? A rising rental-DOM trend means longer vacancies and softer asking-rent achievability than the comps imply.
- What's the recent tenant-quality profile in this submarket — average credit score on applications, eviction rate, late-payment / NSF rate, and stable-employment percentage? A property-management company in the area should have these aggregated.
- How much new for-sale + rental construction is in the pipeline within 1–3 miles? Heavy new supply typically softens prices + rents 12–24 months out; constrained supply supports both.
Investment metrics
- 1% rule
- 0.81% ✗
- Cap rate
- 6.60%
- Cash-on-cash
- 1.09%
- DSCR
- 1.05
- GRM
- 10.3
CMA / ARV
- ARV (median comp)
- $212,005
- List price
- $215,000
- Delta
- 1.41%
- Verdict
- FAIR
- Comps
- 20 within 1.0 mi
Show comp detail 12 sales within ~0.75 mi
| Address | Dist | Beds/Ba | Sqft | Sold | Price | $/sf | Match |
|---|---|---|---|---|---|---|---|
| 2426 Melrose Ave | 0.05mi | 4/2.0 | 1,730 (+5%) | 2mo | $239,900 | $139 | 87 |
| 2502 Ashland Ave | 0.19mi | 3/2.0 (-1) | 1,648 (+0%) | 5mo | $202,000 | $123 | 82 |
| 2512 Belmont Blvd | 0.18mi | 3/1.5 (-1) | 1,630 (-1%) | 4mo | $89,300 | $55 | 80 |
| 2520 Conrad St | 0.25mi | 3/2.0 (-1) | 1,600 (-3%) | 0mo | $145,000 | $91 | 79 |
| 2403 Douglas Dr | 0.32mi | 3/2.0 (-1) | 1,628 (-1%) | 2mo | $199,900 | $123 | 77 |
| 2433 Melrose Ave | 0.06mi | 4/2.0 | 1,459 (-11%) | 5mo | $120,500 | $83 | 75 |
| 2500 La Vonne Cir | 0.26mi | 4/2.0 | 1,823 (+11%) | 4mo | $199,999 | $110 | 66 |
| 2602 Ashland Ave | 0.28mi | 3/2.0 (-1) | 1,480 (-10%) | 1mo | $210,000 | $142 | 65 |
| 2517 Conrad St | 0.23mi | 3/2.0 (-1) | 1,469 (-11%) | 3mo | $200,000 | $136 | 64 |
| 2524 Belmont Blvd | 0.25mi | 3/2.0 (-1) | 1,463 (-11%) | 2mo | $154,900 | $106 | 64 |
| 2407 Douglas Dr | 0.31mi | 3/2.0 (-1) | 1,486 (-10%) | 2mo | $179,900 | $121 | 63 |
| 2214 Wakefield Ave | 0.41mi | 3/1.5 (-1) | 1,854 (+13%) | 4mo | $99,000 | $53 | 49 |
Match score weights: distance 35% · size 25% · config 20% · recency 20%. Top-matched comps best support the ARV.
Projected returns pro-forma
-3.0% appreciation · 6.56% rent growth · sell at horizon
- IRR
- -11.1%
- Equity multiple
- 0.59×
- Total profit
- $-24,967
- Equity at exit
- $32,057
- IRR
- 2.2%
- Equity multiple
- 1.18×
- Total profit
- $10,965
- Equity at exit
- $18,589
Cash invested: $60,200 (down + closing). Projections, not guarantees.
Landlord ↔ Tenant lean methodology
- Overall (STATE)
- 90 Strongly Landlord-Friendly
- State Louisiana
- 90 Strongly Landlord-Friendly · R+12
- County
- — inherits STATE
- City
- — inherits STATE
ZIP-level market 71111
- Home prices YoY
- -34.8%
- Rents YoY
- 6.6%
- Active inventory
- 421
- Price-to-rent
- 10.3×
Monthly cashflow live
- Estimated rent
- $1,741 high interval (Pro) →
- Mortgage (P&I)
- −$1,127
- Tax from tax record
- −$104 /mo · $1,242/yr
- Insurance
- −$90
- HOA
- −$0
- Vacancy / Maint / Mgmt
- −$366
- Net cashflow
- $55
Break-even live
UW: 25.0% down · 7.5% · 30yr · 1.5% tax · 5.0% vac · 8.0% maint · 8.0% mgmt
Financing live
Cash to close
- Down payment
- $53,750
- Closing costs
- $6,450
- Reserves months
- —
- Total cash needed
- —
Loan-product check · same deal, 3 products live
Conventional
25% down · 7.5% · 30yr
- Down + closing
- —
- Monthly P&I
- —
- Monthly cashflow
- —
- DSCR
- —
- Eligible?
- —
Personal DTI + credit; lowest rate.
DSCR
20% down · 8.5% · 30yr
- Down + closing
- —
- Monthly P&I
- —
- Monthly cashflow
- —
- DSCR
- —
- Eligible?
- —
No personal income docs; deal must DSCR.
Hard money
10% down · 12.0% · 12mo
- Down + closing
- —
- Monthly P&I
- —
- Monthly cashflow
- —
- DSCR
- —
- Eligible?
- —
Short-term bridge; refi at stabilization.
Rent comps 6 comps
| Address | Beds | Baths | Sqft | Rent | $/sqft | DOM | Units | Dist |
|---|---|---|---|---|---|---|---|---|
| 2505 Douglas Dr Bossier City, LA | 4.0 | 2.0 | 1640 | $1,700 | $1.04 | 43d | 1 | 0.27mi |
| 2400 Broadway Dr Bossier City, LA | 3.0 | 1.0 | 1295 | $1,450 | $1.12 | 13d | 1 | 0.70mi |
| 1518 Viosca St Bossier City, LA | 3.0 | 2.0 | 1434 | $1,200 | $0.84 | 21d | 1 | 0.91mi |
| 3009 Gaines St Bossier City, LA | 3.0 | 1.0 | 1060 | $1,200 | $1.13 | 21d | 1 | 0.96mi |
| 3200 Cottonwood St Bossier City, LA | 4.0 | 2.0 | 1116 | $1,075 | $0.96 | 21d | 1 | 1.17mi |
| 1005 Clarence St Bossier City, LA | 3.0 | 2.0 | 1203 | $1,300 | $1.08 | 43d | 1 | 1.19mi |
Listing history 7 events
-
2026-06-03status $215,000 Pending 32 DOM
-
2026-06-02days on market $215,000 Active 32 DOM
-
2026-06-01days on market $215,000 Active 31 DOM
-
2026-05-31days on market $215,000 Active 30 DOM
-
2026-05-30days on market $215,000 Active 29 DOM
-
2026-05-12price $219,000 881-char remark
-
2026-05-01$225,000 Active 881-char remark
ⓘ Source: listings_history table (triggers on properties + properties_extension) + one-shot
backfill from property_details.listing_events for pre-trigger history.
Tax reassessment forecast LA · Resets to sale price
- Current annual tax
- $1,242 · $104/mo
- Projected year-2 tax
- $1,242 · $104/mo
- Expected delta
- $0/yr ($0/mo · 0.0%)
ⓘ Screening estimate from a state-policy table — verify with the county assessor before closing.
Climate risk First Street
- Flood 4/10 Moderate FEMA zone X (shaded) · 22% chance over 30 yrs
- Wildfire 1/10 Low
- Heat 7/10 Severe 7 d/yr ≥110°F today · 22 d/yr by 30 yrs out
- Wind 6/10 Major 60% chance of damaging wind over 30 yrs
- Air quality 2/10 Low 1 unhealthy d/yr today · 2 by 30 yrs out
Nearby sold comps map
Loading sold comps map…
Walkable amenities ~0.75 mi
Loading nearby amenities…
Taxation est. · year 1
- Rental income
- $20,892
- − Mortgage interest
- −$12,043
- − Property taxes
- −$1,242
- − Insurance
- −$1,075
- − Repairs & maintenance
- −$1,671
- − Management
- −$1,671
- − Depreciation
- −$6,255
- Taxable loss
- −$3,066
- Est. tax savings @ 24.0%
- +$736
- After-tax cash flow
- $1,393/yr
For passive investors: Depreciation is non-cash, so a rental often shows a tax loss while cash-flowing — sheltering income. Rental losses are passive: they offset passive income freely, and up to $25,000/yr can offset ordinary (W-2) income if you actively participate and your MAGI is under $100k (phasing out to $0 by $150k); unused losses carry forward. On sale, claimed depreciation is recaptured at up to 25%, and gains may owe capital-gains tax (a 1031 exchange can defer both). Figures are a year-1 estimate at your 24.0% rate — not tax advice; consult a CPA.
Schools (NCES district)
- District
- Bossier Parish
- NCES district ID
- 2200270
- Math proficiency
- 40% ▼ -32.00%
- Reading proficiency
- 47% ▼ -28.00%
- Median HH income
- $51,326
- Composite
- 37.5/100
- National rank
- #4402
- State rank
- #17 of 98 in LA
Livability — Bossier City
- Score
- 71/100
- State rank
- #47
- US rank
- #7044
Category grades
Schools grade is shown separately in the Schools card above.
Census & demographics
- Census place
- Bossier City, LA
- County
- Bossier Parish · 98,704 people
- City population
- 91,925
- Metro
- Shreveport-Bossier City, LA
- Population (ZIP)
- 43,925
- Household income
- $65,292
- Rent vs Own
- Severe rent burden
- 1942.0
Population outlook (Bossier County) Hauer SSP2
- Today (2025)
- 143,247 people
- By 2030
- 151,802 · +6.0%
- By 2040
- 168,194 · +17.4%
- By 2050
- 183,533 · +28.1%
- By 2075
- 217,009 · +51.5%
- By 2100
- 230,091 · +60.6%
Race, ethnicity, and origin ACS 2023
- Neighborhood character
- Diverse neighborhood (Simpson 0.60)
- Race & ethnicity
- White 56% Black 29% Hispanic / Latino 9% Two or more races 8% Asian 3%
- Hispanic origin (detail)
- Mexican 5%
- Common ancestry
- Lithuanian 2% Iranian 1% Slovak 1%
- Foreign-born
- 5% · Canada, Vietnam
- Languages at home
- 90% English-only · Spanish 7% Vietnamese 1% French/Haitian/Cajun 1%
Political lean MEDSL · Bossier
- 2024 margin
- Solid R (+43.3) · D 27.7% · R 71.0% · Other 1.3%
- 2008→2024 swing
- +0.3pp no change · 2008: -43.7pp · 2024: -43.3pp
- All cycles
- 2024: R+43.3 2020: R+41.0 2016: R+45.8 2012: R+45.4 2008: R+43.7
Not yet ingested
- Civics
- —
Market trends
- HPI YoY
- ▼ -79.78%
- Current HPI
- 149.4336
- Rent YoY
- ▲ 6.56%
- Metro
- Shreveport-Bossier City, LA
- State GDP YoY
- ▲ 3.29%
- F500 in state
- 10
Industry mix (Fortune 500 HQ in LA)
| Industry | F500 HQs | Revenue |
|---|---|---|
| Telecommunications | 2 | $23B |
|
||
| Utilities | 1 | $12B |
|
||
| Wholesale / Distribution | 1 | $5B |
|
||
| Advertising | 1 | $2B |
|
||
Price history
-4.4% since first listed4 events — show timeline
- 2026-06-02 Pending — NTREIS
- 2026-05-21 Price Changed $215,000 NTREIS
- 2026-05-12 Price Changed $219,000 NTREIS
- 2026-05-01 Listed $225,000 NTREIS
Property tax history
-1.9%/yrLatest (2025): $1,242 · -1.3% YoY. Source: county tax records.
Cash-flow waterfall
monthlySold comps — $/sqft
last 12 mo · ≤1 miLoading sold comps…