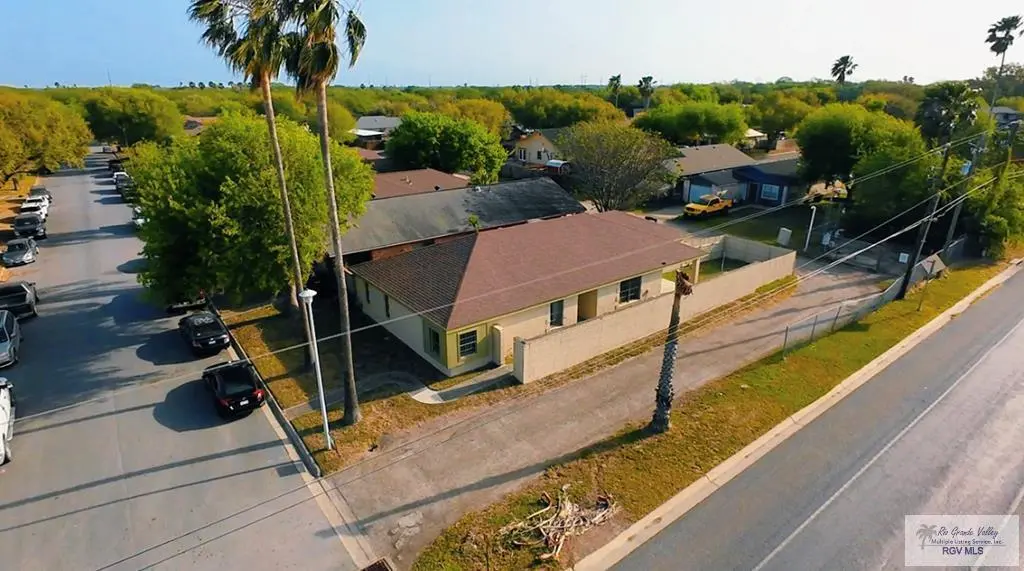
23919 Ellie Ln · Primera, TX
Flood risk 3/10 · Minor
- FEMA flood zone
- X (unshaded)
- Chance of flooding over 30 yrs
- 0.2%
- Est. flood insurance / yr
- $507 – $1,088
Fire risk 3/10 · Minor
- Est. fire insurance / yr
- $1,222 – $2,270
Heat risk 9/10 · Severe
- Hot days now (above 110°F)
- 7 days/yr
- Hot days in 30 yrs
- 23 days/yr
Wind risk 9/10 · Severe
- Chance of severe wind over 30 yrs
- 99.0%
Air-quality risk 1/10 · Minimal
- Unhealthy air days now
- 0 days/yr
- Unhealthy air days in 30 yrs
- 0 days/yr
Risk factors via First Street. Map © Google.
Why this score? — see what drove the D grade
The composite is a weighted blend of 9 inputs, each scored 0–100. Each bar is that input's sub-score; the figure is the points it added to the 100-point composite (weight × sub-score).
- ARV discount +15.0/15.0
- Cash flow +10.0/30.0
- 1% rule +3.0/10.0
- Livability +2.9/5.0
- DSCR +2.8/10.0
- Schools +2.5/10.0
- Condition / age +2.5/5.0
- Rent growth +2.0/5.0
- Appreciation +0.0/10.0
$205,000
🖨 Deal sheet 📄 Offer letter ✓ Due diligence
Listing remarks MLS
Welcome to 23919 Ellie Ln, Harlingen, TX—a beautifully remodeled home in a thriving area! This 3-bed, 2-bath home offers ~1,607 sqft of modern living space. Enjoy an open-concept design with new tile flooring, quartz countertops, and a spacious living area perfect for entertaining. The master suite features a luxurious walk-in shower for a spa-like feel. Located in the Harlingen CISD, top-rated schools are just minutes away. Parks like Arroyo Park and City Lake Park offer scenic trails, playgrounds, and picnic areas, enhancing your outdoor lifestyle. This home is move-in ready with contemporary upgrades in a growing community close to schools, parks, and shopping. Don't miss out—schedule a showing today!
Key facts
- Open-concept design
- New tile flooring
- Move-in ready
Tags
Neighborhood map
What this means for you Summary
Snapshot
- This is a 3-bed/2.0-bath single-family listed at $205k.
Deal economics
- At list price, monthly cash flow is $-124 ($-1k/yr) — negative.
- To cash-flow at today's rent, offer at most $187k (8.7% below list).
- To meet the 1% rule (rent ≥ 1% of price), the offer needs to be $164k (20.2% below list).
- Recommended offer: $164k (20.2% below list) — sets the bar for 1% rule.
Location & tenants
- Location reads 57/100 on livability (#1,263 in TX) — a working-class tenant base; expect higher turnover. Strengths: cost of living A+, housing A-; Watch: employment D+, schools F, crime D-.
- Harlingen CISD (urban): math 25% / reading 35% proficiency, ranked #647 of 826 in TX (top 78%) — families likely to look elsewhere, expect single-tenant / working-renter base with shorter leases; 74% free/reduced lunch — lower-income household profile, screen leases tightly.
- Market conditions: Rents soft (-1.9%/yr); 534 active listings in the ZIP; 11 comparable units currently listed for rent nearby; rentals leasing fast (median 14d on market — plan ~1-2 weeks tenant-placement turnaround); 2,326 units permitted in Cameron County in 2024 (503 in 5+ unit buildings).
Forward outlook
- Local home prices are declining (-3.0%/yr); year-one equity from $1k of loan paydown is wiped out by about $6k of value loss. Plan a longer hold.
- Cameron County population projected at +3% by 2050 — modest demand growth; plan on rents tracking national, not racing it.
Negotiation context
- Only 10 days on market — expect competitive offers; lowballing is unlikely to land.
Risks & watch-outs
- Climate carrying-cost: severe wind risk, 99% chance of damaging wind over 30y; extreme-heat days projected 7→23/yr by 2055 (HVAC capex compounding) — expect insurance premiums to compound above CPI over the hold.
Questions for the listing agent
- What do current leases actually rent for vs. the listed asking? Can we see a recent rent roll and the last 12 months of T-12 income?
- Is there a deadline driving the sale (1031 exchange, divorce, estate, relocation)? That informs how much negotiation room exists.
- Schools are F-rated, which usually means shorter tenancies and higher turnover. Who's the typical renter profile here, and what's been the actual vacancy rate?
- Crime grade is D in this area — have there been break-ins, vandalism, or insurance claims at this property in the last 3 years? What carrier currently insures it and at what premium?
- The area grade is low — what's the realistic commute time and amenity access for the typical tenant pool here? Any planned neighborhood developments (good or bad) we should know about?
- What's the average days-on-market for RENTAL listings here right now (not sales)? A rising rental-DOM trend means longer vacancies and softer asking-rent achievability than the comps imply.
- What's the recent tenant-quality profile in this submarket — average credit score on applications, eviction rate, late-payment / NSF rate, and stable-employment percentage? A property-management company in the area should have these aggregated.
- How much new for-sale + rental construction is in the pipeline within 1–3 miles? Heavy new supply typically softens prices + rents 12–24 months out; constrained supply supports both.
Investment metrics
- 1% rule
- 0.80% ✗
- Cap rate
- 5.57%
- Cash-on-cash
- -2.59%
- DSCR
- 0.88
- GRM
- 10.4
CMA / ARV
- ARV (median comp)
- $254,861
- List price
- $205,000
- Delta
- -7.79%
- Verdict
- FAIR
- Comps
- 20 within 1.0 mi
Show comp detail 10 sales within ~0.75 mi
| Address | Dist | Beds/Ba | Sqft | Sold | Price | $/sf | Match |
|---|---|---|---|---|---|---|---|
| 23717 Sun Chase Cir | 0.34mi | 3/2.5 | 1,697 (+6%) | 1mo | $240,000 | $141 | 72 |
| 2017 Stonebriar Rd | 0.37mi | 4/2.0 (+1) | 1,730 (+8%) | 8mo | $258,000 | $149 | 58 |
| 17200 Mandarin Ave | 0.67mi | 3/2.0 | 1,487 (-8%) | 2mo | $205,000 | $138 | 54 |
| 3822 Bea Ave | 0.38mi | 4/2.0 (+1) | 1,743 (+8%) | 12mo | $295,000 | $169 | 53 |
| 17282 Mandarin Ave | 0.60mi | 3/2.0 | 1,547 (-4%) | 16mo | $229,400 | $148 | 52 |
| 5113 Doral Ave | 0.69mi | 3/2.0 | 1,454 (-10%) | 3mo | $238,000 | $164 | 50 |
| 1206 Rio Panuco Ave | 0.53mi | 4/2.5 (+1) | 1,730 (+8%) | 15mo | $285,000 | $165 | 43 |
| 3717 Marco Ave | 0.64mi | 4/2.0 (+1) | 1,540 (-4%) | 22mo | $272,500 | $177 | 40 |
| 1206 Poza Rica Ave | 0.66mi | 4/2.0 (+1) | 1,680 (+4%) | 24mo | $295,500 | $176 | 37 |
| 3705 Marco Ave | 0.66mi | 4/2.5 (+1) | 1,820 (+13%) | 14mo | $299,500 | $165 | 28 |
Match score weights: distance 35% · size 25% · config 20% · recency 20%. Top-matched comps best support the ARV.
Projected returns pro-forma
-3.0% appreciation · 0.0% rent growth · sell at horizon
- IRR
- -24.0%
- Equity multiple
- 0.20×
- Total profit
- $-45,874
- Equity at exit
- $30,566
- IRR
- -30.7%
- Equity multiple
- -0.19×
- Total profit
- $-68,533
- Equity at exit
- $17,725
Cash invested: $57,400 (down + closing). Projections, not guarantees.
Landlord ↔ Tenant lean methodology
- Overall (STATE)
- 87 Strongly Landlord-Friendly
- State Texas
- 87 Strongly Landlord-Friendly · R+5
- County
- — inherits STATE
- City
- — inherits STATE
ZIP-level market 78552
- Home prices YoY
- -13.8%
- Rents YoY
- -1.9%
- Active inventory
- 534
- Price-to-rent
- 10.4×
Monthly cashflow live
- Estimated rent
- $1,637 high interval (Pro) →
- Mortgage (P&I)
- −$1,075
- Tax est. 1.5%
- −$256 /mo · $3,075/yr
- Insurance
- −$85
- HOA
- −$0
- Vacancy / Maint / Mgmt
- −$344
- Net cashflow
- $-124
Break-even live
UW: 25.0% down · 7.5% · 30yr · 1.5% tax · 5.0% vac · 8.0% maint · 8.0% mgmt
Financing live
Cash to close
- Down payment
- $51,250
- Closing costs
- $6,150
- Reserves months
- —
- Total cash needed
- —
Loan-product check · same deal, 3 products live
Conventional
25% down · 7.5% · 30yr
- Down + closing
- —
- Monthly P&I
- —
- Monthly cashflow
- —
- DSCR
- —
- Eligible?
- —
Personal DTI + credit; lowest rate.
DSCR
20% down · 8.5% · 30yr
- Down + closing
- —
- Monthly P&I
- —
- Monthly cashflow
- —
- DSCR
- —
- Eligible?
- —
No personal income docs; deal must DSCR.
Hard money
10% down · 12.0% · 12mo
- Down + closing
- —
- Monthly P&I
- —
- Monthly cashflow
- —
- DSCR
- —
- Eligible?
- —
Short-term bridge; refi at stabilization.
Rent comps 11 comps
| Address | Beds | Baths | Sqft | Rent | $/sqft | DOM | Units | Dist |
|---|---|---|---|---|---|---|---|---|
| 23861 Ellie Ln Harlingen, TX | 3.0 | 2.0 | 1220 | $1,650 | $1.35 | 21d | 1 | 0.04mi |
| 1007 El Paso Cir Harlingen, TX | 3.0 | 2.0 | 1201 | $1,600 | $1.33 | 43d | 1 | 0.40mi |
| 5408 Guava Dr Harlingen, TX | 2.0 | 2.0 | 1660 | $1,400 | $0.84 | 13d | 1 | 0.85mi |
| 1719 Brazo Cir Harlingen, TX | 2.0 | 2.0 | 2072 | $1,700 | $0.82 | 13d | 1 | 0.99mi |
| 1716 Palm Valley Dr W Harlingen, TX | 2.0 | 2.0 | 1180 | $1,450 | $1.23 | 13d | 1 | 1.01mi |
| 5108 Manana Cir Harlingen, TX | 3.0 | 2.0 | 1721 | $1,900 | $1.10 | 13d | 1 | 1.08mi |
| 1500 Palm Valley Dr W #12 Harlingen, TX | 2.0 | 2.0 | 1625 | $1,350 | $0.83 | 13d | 1 | 1.10mi |
| 17931 Spruce St Harlingen, TX | 3.0 | 2.0 | 1284 | $1,850 | $1.44 | 43d | 1 | 1.33mi |
| 5611 La Estrella Cir Harlingen, TX | 3.0 | 2.0 | 2218 | $2,295 | $1.03 | 13d | 1 | 1.46mi |
| 18586 Primera Rd Harlingen, TX | 2.0 | 2.0 | 1100 | $1,095 | $1.00 | 43d | 1 | 1.48mi |
| 5316 Palm Valley Dr S Harlingen, TX | 3.0 | 2.0 | 2090 | $2,100 | $1.00 | 43d | 1 | 1.48mi |
Listing history 11 events
-
2026-06-18days on market $205,000 Active 10 DOM
-
2026-06-17days on market $205,000 Active 9 DOM
-
2026-06-16days on market $205,000 Active 8 DOM
-
2026-06-15days on market $205,000 Active 7 DOM
-
2026-06-14days on market $205,000 Active 5 DOM
-
2026-06-10days on market $205,000 Active 2 DOM
-
2026-06-09pricedays on market $205,000 Active 1 DOM
-
2026-05-31days on market $235,000 Active 142 DOM
-
2026-05-30days on market $235,000 Active 141 DOM
-
2026-02-10price $235,000 725-char remark
Show marketing remark (725 chars)
Welcome to 23919 Ellie Ln, Harlingen, TX—a beautifully remodeled home in a thriving area! This 3-bed, 2-bath home offers ~1,607 sqft of modern living space. Enjoy an open-concept design with new tile flooring, quartz countertops, and a spacious living area perfect for entertaining. The master suite features a luxurious walk-in shower for a spa-like feel. Located in the Harlingen CISD, top-rated schools are just minutes away. Parks like Arroyo Park and City Lake Park offer scenic trails, playgrounds, and picnic areas, enhancing your outdoor lifestyle. This home is move-in ready with contemporary upgrades in a growing community close to schools, parks, and shopping. Don't miss out—schedule a showing today!
-
2026-01-09$210,000 Active 725-char remark
Show marketing remark (725 chars)
Welcome to 23919 Ellie Ln, Harlingen, TX—a beautifully remodeled home in a thriving area! This 3-bed, 2-bath home offers ~1,607 sqft of modern living space. Enjoy an open-concept design with new tile flooring, quartz countertops, and a spacious living area perfect for entertaining. The master suite features a luxurious walk-in shower for a spa-like feel. Located in the Harlingen CISD, top-rated schools are just minutes away. Parks like Arroyo Park and City Lake Park offer scenic trails, playgrounds, and picnic areas, enhancing your outdoor lifestyle. This home is move-in ready with contemporary upgrades in a growing community close to schools, parks, and shopping. Don't miss out—schedule a showing today!
ⓘ Source: listings_history table (triggers on properties + properties_extension) + one-shot
backfill from property_details.listing_events for pre-trigger history.
Climate risk First Street
- Flood 3/10 Moderate FEMA zone X (unshaded) · 20% chance over 30 yrs
- Wildfire 3/10 Moderate
- Heat 9/10 Extreme 7 d/yr ≥110°F today · 23 d/yr by 30 yrs out
- Wind 9/10 Extreme 99% chance of damaging wind over 30 yrs
- Air quality 1/10 Low 0 unhealthy d/yr today · 0 by 30 yrs out
Nearby sold comps map
Loading sold comps map…
Walkable amenities ~0.75 mi
Loading nearby amenities…
Taxation est. · year 1
- Rental income
- $19,639
- − Mortgage interest
- −$11,483
- − Property taxes
- −$3,075
- − Insurance
- −$1,025
- − Repairs & maintenance
- −$1,571
- − Management
- −$1,571
- − Depreciation
- −$5,964
- Taxable loss
- −$5,050
- Est. tax savings @ 24.0%
- +$1,212
- After-tax cash flow
- $-273/yr
For passive investors: Depreciation is non-cash, so a rental often shows a tax loss while cash-flowing — sheltering income. Rental losses are passive: they offset passive income freely, and up to $25,000/yr can offset ordinary (W-2) income if you actively participate and your MAGI is under $100k (phasing out to $0 by $150k); unused losses carry forward. On sale, claimed depreciation is recaptured at up to 25%, and gains may owe capital-gains tax (a 1031 exchange can defer both). Figures are a year-1 estimate at your 24.0% rate — not tax advice; consult a CPA.
Schools (NCES district)
- District
- Harlingen CISD
- NCES district ID
- 4822530
- Math proficiency
- 25% ▼ -28.00%
- Reading proficiency
- 35% ▼ -11.00%
- Median HH income
- $37,182
- Composite
- 24.94/100
- National rank
- #7566
- State rank
- #647 of 826 in TX
Livability — Primera
- Score
- 57/100
- State rank
- #1263
- US rank
- #21994
Category grades
Schools grade is shown separately in the Schools card above.
Census & demographics
- Census place
- Primera, TX
- County
- Cameron County · 310,734 people
- City population
- 95,667
- Metro
- Brownsville-Harlingen, TX
- Population (ZIP)
- 42,332
- Household income
- $69,811
- Rent vs Own
- Severe rent burden
- 487.0
Population outlook (Cameron County) Hauer SSP2
- Today (2025)
- 441,603 people
- By 2030
- 448,113 · +1.5%
- By 2040
- 456,385 · +3.3%
- By 2050
- 456,294 · +3.3%
- By 2075
- 423,851 · -4.0%
- By 2100
- 342,787 · -22.4%
Race, ethnicity, and origin ACS 2023
- Neighborhood character
- Predominantly Hispanic (80%)
- Race & ethnicity
- Hispanic / Latino 80% Two or more races 31% White 16% Asian 2%
- Hispanic origin (detail)
- Mexican 75%
- Common ancestry
- Lithuanian 1% Romanian 1% Slovak 1%
- Foreign-born
- 15% · Canada
- Languages at home
- 49% English-only · Spanish 49% Vietnamese 1%
Political lean MEDSL · Cameron
- 2024 margin
- Lean R (+5.8) · D 46.7% · R 52.5%
- 2008→2024 swing
- -34.6pp toward R · 2008: 28.8pp · 2024: -5.8pp
- All cycles
- 2024: R+5.8 2020: D+13.2 2016: D+32.5 2012: D+32.4 2008: D+28.8
Not yet ingested
- Civics
- —
Market trends
- HPI YoY
- ▼ -31.61%
- Current HPI
- 197.1906
- Rent YoY
- ▼ -1.87%
- Metro
- Brownsville-Harlingen, TX
- State GDP YoY
- ▲ 3.95%
- F500 in state
- 110
Industry mix (Fortune 500 HQ in TX)
| Industry | F500 HQs | Revenue |
|---|---|---|
| Energy | 16 | $1,198B |
|
||
| Technology | 5 | $198B |
|
||
| Engineering / Construction | 4 | $72B |
|
||
| Energy Services | 3 | $60B |
|
||
| Utilities | 3 | $41B |
|
||
| Healthcare | 2 | $330B |
|
||
Price history
+11.9% since first listed2 events — show timeline
- 2026-02-10 Price Changed $235,000 RGVMLS
- 2026-01-09 Listed $210,000 RGVMLS
Cash-flow waterfall
monthlySold comps — $/sqft
last 12 mo · ≤1 miLoading sold comps…