 Triplex
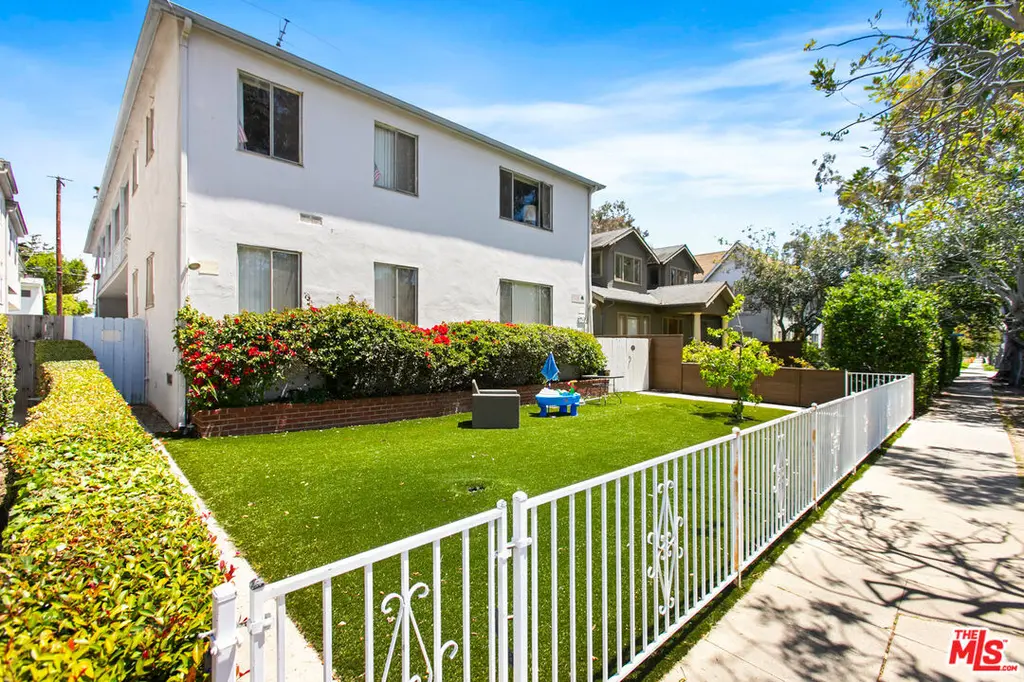
947 7th St · Santa Monica, CA
Flood risk 1/10 · Minimal
- FEMA flood zone
- X (unshaded)
- Chance of flooding over 30 yrs
- 0.0%
- Est. flood insurance / yr
- $507 – $1,088
Fire risk 1/10 · Minimal
- Est. fire insurance / yr
- $659 – $1,223
Heat risk 7/10 · Major
- Hot days now (above 80°F)
- 7 days/yr
- Hot days in 30 yrs
- 20 days/yr
Wind risk 1/10 · Minimal
- Chance of severe wind over 30 yrs
- —
Air-quality risk 4/10 · Minor
- Unhealthy air days now
- 5 days/yr
- Unhealthy air days in 30 yrs
- 6 days/yr
Risk factors via First Street. Map © Google.
Why this score? — see what drove the C grade
The composite is a weighted blend of 9 inputs, each scored 0–100. Each bar is that input's sub-score; the figure is the points it added to the 100-point composite (weight × sub-score).
- ARV discount +15.0/15.0
- Cash flow +14.7/30.0
- Schools +6.2/10.0
- Appreciation +4.9/10.0
- DSCR +4.5/10.0
- 1% rule +4.1/10.0
- Condition / age +4.0/5.0
- Livability +3.6/5.0
- Rent growth +2.5/5.0
$2,650,000
🖨 Deal sheet 📄 Offer letter ✓ Due diligence
Multi-family units
County records classify this as Multi-Family (5+ Unit). Listing-text estimate: 3 units. estimate disagrees with records
5+ unit building — per-unit beds/baths from public records are typically unavailable; the breakdown below (if shown) is an estimate from the listing text.
Listing remarks MLS
A rare two-building, 7-unit apartment community ideally situated in one of Santa Monica's most coveted and supply-constrained residential enclaves. Built in 1955 and coming to market for the first time in over 50 years, this offering represents a true generational ownership event the kind of long-term, pride-of-ownership asset that rarely surfaces in one of Southern California's most desirable and barrier-to-entry coastal markets. Situated on a 7,525 square foot lot, the property totals 6,313 square feet of gross building area across two structures, offering an average of 902 square feet per unit. The asset features a well-diversified unit mix of three (3) one bedroom, one bath units, two (2) two-bedroom, one bath units, and two (2) two-bedroom, two bath units
Key facts
- 7,528 sq ft lot
- Parking
- Built 1955
Neighborhood map
What this means for you Summary
Snapshot
- This is a 3 × 3-bed/?-bath units multifamily listed at $2.65M. Condition is rated good.
Deal economics
- At list price, monthly cash flow is $700 ($8k/yr) — positive. Per door: $233/mo.
- The deal already cash-flows at list — no discount required.
- To meet the 1% rule (rent ≥ 1% of price), the offer needs to be $2.41M (9.2% below list).
- Recommended offer: $2.41M (9.2% below list) — sets the bar for 1% rule.
- Cap rate 6.6% vs local median 1.2% in Santa Monica — top-decile yield for the area; either an underpriced asset or a hidden risk that comps aren't pricing in. Stress-test before assuming the spread holds.
Location & tenants
- Location reads 72/100 on livability (#178 in CA) — a middle-class / working-renter tenant base. Strengths: schools A+, amenities A+, commute A+; Watch: health & safety C-, crime F, cost of living F.
- Santa Monica-Malibu Unified (urban): math 61% / reading 74% proficiency, ranked #123 of 1,400 in CA (top 9%) — acceptable for families but not a draw, mixed tenant base, ~2y average lease.
- Market conditions: Rents soft (-0.1%/yr); 93 active listings in the ZIP; high-income renter base; 19,697 units permitted in Los Angeles County in 2024 (9,426 in 5+ unit buildings).
- At $24,068/mo this rent would consume 237% of the median local household income ($122k/yr) (locally 2265% of renters already pay >50% of income on rent) — very limited rent-growth headroom before tenants either downsize or default.
Forward outlook
- In year one you build about $16k of equity ($18k loan paydown + $-3k appreciation (-0.1% local appreciation)).
- Los Angeles County population projected at +9% by 2050 — modest demand growth; plan on rents tracking national, not racing it.
- By year 8, paydown + projected appreciation supports a ~$177k cash-out refi (75% LTV) — recoverable capital for the next deal without selling this one.
Negotiation context
- It's been on market 34 days — a 3% lower offer ($2.57M) is reasonable based on typical stale-listing flexibility.
Risks & watch-outs
- Watch-outs: built in 1955 — expect roof / HVAC / electrical / plumbing capex.
- Climate carrying-cost: extreme-heat days projected 7→20/yr by 2055 (HVAC capex compounding) — expect insurance premiums to compound above CPI over the hold.
Questions for the listing agent
- It's been on market 34 days. Have you received any prior offers? Is the seller open to a 9% concession, seller financing, or rate buy-down credit?
- Can we see the unit-by-unit rent roll, current vacancy, and any below-market leases? What's the average tenancy length?
- What capital expenditures (roof, boiler, parking lot, exteriors) have been made in the last 5 years, and what's planned in the next 2?
- Built in 1955 — when were the roof, HVAC, electrical panel, plumbing, and water heater last replaced?
- Is there a deadline driving the sale (1031 exchange, divorce, estate, relocation)? That informs how much negotiation room exists.
- Schools are A-rated — typically a magnet for longer-tenancy family renters. What's the average tenant stay here, and is there a school-zone premium baked into asking?
- Crime grade is F in this area — have there been break-ins, vandalism, or insurance claims at this property in the last 3 years? What carrier currently insures it and at what premium?
- What's the average days-on-market for RENTAL listings here right now (not sales)? A rising rental-DOM trend means longer vacancies and softer asking-rent achievability than the comps imply.
- What's the recent tenant-quality profile in this submarket — average credit score on applications, eviction rate, late-payment / NSF rate, and stable-employment percentage? A property-management company in the area should have these aggregated.
- How much new apartment / multifamily construction is in the pipeline within 1–3 miles? Heavy new supply (>2% of stock underway) typically softens rents 12–24 months out; light construction supports rent growth.
Investment metrics
- 1% rule
- 0.91% ✗
- Cap rate
- 6.61%
- Cash-on-cash
- 1.13%
- DSCR
- 1.05
- GRM
- 9.2
CMA / ARV
- ARV (median comp)
- $3,336,618
- List price
- $2,650,000
- Delta
- -20.58%
- Verdict
- UNDERPRICED
- Comps
- 20 within 1.0 mi
Show comp detail 2 sales within ~0.75 mi
| Address | Dist | Beds/Ba | Sqft | Sold | Price | $/sf | Match |
|---|---|---|---|---|---|---|---|
| 824 Lincoln Blvd | 0.18mi | 10/11.0 (+1) | 6,480 (+3%) | 11mo | $3,050,000 | $471 | 61 |
| 948 5th St | 0.19mi | 10/9.0 (+1) | 6,803 (+8%) | 17mo | $3,560,000 | $523 | 56 |
Match score weights: distance 35% · size 25% · config 20% · recency 20%. Top-matched comps best support the ARV.
Projected returns pro-forma
-0.1% appreciation · 0.0% rent growth · sell at horizon
- IRR
- -3.4%
- Equity multiple
- 0.84×
- Total profit
- $-115,602
- Equity at exit
- $756,176
- IRR
- 0.3%
- Equity multiple
- 1.03×
- Total profit
- $19,244
- Equity at exit
- $898,411
Cash invested: $742,000 (down + closing). Projections, not guarantees.
Landlord ↔ Tenant lean methodology
- Overall (STATE)
- 18 Strongly Tenant-Friendly
- State California
- 18 Strongly Tenant-Friendly · D+13
- County
- — inherits STATE
- City
- — inherits STATE
ZIP-level market 90403
- Home prices YoY
- -0.0%
- Rents YoY
- -0.1%
- Active inventory
- 93
- Price-to-rent
- 27.5×
Monthly cashflow live
- Estimated rent
- $24,068 high interval (Pro) →
- Mortgage (P&I)
- −$13,897
- Tax est. 1.5%
- −$3,312 /mo · $39,750/yr
- Insurance
- −$1,104
- HOA
- −$0
- Vacancy / Maint / Mgmt
- −$5,054
- Net cashflow
- $700
Break-even live
3-unit breakdown (identical units grouped — click to expand)
| Units | Beds | Baths | Est. rent |
|---|---|---|---|
| 3× units | 3 | — | $24,069 |
| #1 | 3 | — | $8,023 |
| #2 | 3 | — | $8,023 |
| #3 | 3 | — | $8,023 |
| Total (3 units) | $24,068 | ||
UW: 25.0% down · 7.5% · 30yr · 1.5% tax · 5.0% vac · 8.0% maint · 8.0% mgmt
Financing live
Cash to close
- Down payment
- $662,500
- Closing costs
- $79,500
- Reserves months
- —
- Total cash needed
- —
Loan-product check · same deal, 3 products live
Conventional
25% down · 7.5% · 30yr
- Down + closing
- —
- Monthly P&I
- —
- Monthly cashflow
- —
- DSCR
- —
- Eligible?
- —
Personal DTI + credit; lowest rate.
DSCR
20% down · 8.5% · 30yr
- Down + closing
- —
- Monthly P&I
- —
- Monthly cashflow
- —
- DSCR
- —
- Eligible?
- —
No personal income docs; deal must DSCR.
Hard money
10% down · 12.0% · 12mo
- Down + closing
- —
- Monthly P&I
- —
- Monthly cashflow
- —
- DSCR
- —
- Eligible?
- —
Short-term bridge; refi at stabilization.
Listing history 15 events
-
2026-06-18days on market $2,650,000 Active 34 DOM
-
2026-06-17days on market $2,650,000 Active 33 DOM
-
2026-06-16days on market $2,650,000 Active 32 DOM
-
2026-06-15days on market $2,650,000 Active 31 DOM
-
2026-06-13days on market $2,650,000 Active 29 DOM
-
2026-06-13days on market $2,650,000 Active 28 DOM
-
2026-06-09days on market $2,650,000 Active 25 DOM
-
2026-06-08days on market $2,650,000 Active 24 DOM
-
2026-06-07days on market $2,650,000 Active 23 DOM
-
2026-06-04days on market $2,650,000 Active 20 DOM
-
2026-06-03days on market $2,650,000 Active 19 DOM
-
2026-06-02days on market $2,650,000 Active 18 DOM
-
2026-06-01days on market $2,650,000 Active 17 DOM
-
2026-05-31days on market $2,650,000 Active 16 DOM
-
2026-05-15$2,650,000 Active 770-char remark
Show marketing remark (770 chars)
A rare two-building, 7-unit apartment community ideally situated in one of Santa Monica's most coveted and supply-constrained residential enclaves. Built in 1955 and coming to market for the first time in over 50 years, this offering represents a true generational ownership event the kind of long-term, pride-of-ownership asset that rarely surfaces in one of Southern California's most desirable and barrier-to-entry coastal markets. Situated on a 7,525 square foot lot, the property totals 6,313 square feet of gross building area across two structures, offering an average of 902 square feet per unit. The asset features a well-diversified unit mix of three (3) one bedroom, one bath units, two (2) two-bedroom, one bath units, and two (2) two-bedroom, two bath units
ⓘ Source: listings_history table (triggers on properties + properties_extension) + one-shot
backfill from property_details.listing_events for pre-trigger history.
Climate risk First Street
- Flood 1/10 Low FEMA zone X (unshaded) · 0% chance over 30 yrs
- Wildfire 1/10 Low
- Heat 7/10 Severe 7 d/yr ≥80°F today · 20 d/yr by 30 yrs out
- Wind 1/10 Low
- Air quality 4/10 Moderate 5 unhealthy d/yr today · 6 by 30 yrs out
Nearby sold comps map
Loading sold comps map…
Walkable amenities ~0.75 mi
Loading nearby amenities…
Taxation est. · year 1
- Rental income
- $288,816
- − Mortgage interest
- −$148,441
- − Property taxes
- −$39,750
- − Insurance
- −$13,250
- − Repairs & maintenance
- −$23,105
- − Management
- −$23,105
- − Depreciation
- −$77,091
- Taxable loss
- −$35,927
- Est. tax savings @ 24.0%
- +$8,622
- After-tax cash flow
- $17,024/yr
For passive investors: Depreciation is non-cash, so a rental often shows a tax loss while cash-flowing — sheltering income. Rental losses are passive: they offset passive income freely, and up to $25,000/yr can offset ordinary (W-2) income if you actively participate and your MAGI is under $100k (phasing out to $0 by $150k); unused losses carry forward. On sale, claimed depreciation is recaptured at up to 25%, and gains may owe capital-gains tax (a 1031 exchange can defer both). Figures are a year-1 estimate at your 24.0% rate — not tax advice; consult a CPA.
Condition & rehab AI · 12 photos
This two-building, 7-unit apartment community is in good condition with a well-maintained exterior and landscaping. It offers a good investment opportunity with potential for value enhancement through minor cosmetic upgrades.
Value-add opportunities
- Both Paint exterior walls — Fresh paint can enhance curb appeal and property value
- Both Replace windows — New windows can improve energy efficiency and property value
- Both Upgrade HVAC system — A modern HVAC system can improve comfort and energy efficiency
- Both Landscaping improvements — Enhanced landscaping can increase curb appeal and property value
Renovation cost estimate screening
Value-add ROI direction
- Both Paint exterior walls — Fresh paint can enhance curb appeal and property value ↑
- Both Replace windows — New windows can improve energy efficiency and property value ↑
- Both Upgrade HVAC system — A modern HVAC system can improve comfort and energy efficiency ↑
- Both Landscaping improvements — Enhanced landscaping can increase curb appeal and property value ↑
ⓘ Cost ranges are severity-bucket heuristics (US national rule-of-thumb). Get contractor quotes + a written scope before underwriting a rehab budget.
Schools (NCES district)
- District
- Santa Monica-Malibu Unified
- NCES district ID
- 0635700
- Math proficiency
- 61% ▬ 0.00%
- Reading proficiency
- 74% ▬ 0.00%
- Median HH income
- $81,489
- Composite
- 61.58/100
- National rank
- #1535
- State rank
- #123 of 1400 in CA
Livability — Santa Monica
- Score
- 72/100
- State rank
- #178
- US rank
- #5878
Category grades
Schools grade is shown separately in the Schools card above.
Census & demographics
- Census place
- Santa Monica, CA
- County
- Los Angeles County · 9,444,647 people
- City population
- 93,581
- Metro
- Los Angeles-Long Beach-Anaheim, CA
- Population (ZIP)
- 23,867
- Household income
- $121,925
- Rent vs Own
- Severe rent burden
- 2265.0
Population outlook (Los Angeles County) Hauer SSP2
- Today (2025)
- 10,940,515 people
- By 2030
- 11,256,481 · +2.9%
- By 2040
- 11,729,929 · +7.2%
- By 2050
- 11,948,407 · +9.2%
- By 2075
- 11,818,114 · +8.0%
- By 2100
- 10,842,928 · -0.9%
Race, ethnicity, and origin ACS 2023
- Neighborhood character
- Predominantly White (67%)
- Race & ethnicity
- White 67% Hispanic / Latino 12% Two or more races 12% Asian 11% Black 2%
- Hispanic origin (detail)
- Mexican 9%
- Common ancestry
- Italian 7% Romanian 5% Scotch-Irish 4%
- Foreign-born
- 24% · Canada, China, Dominican Republic
- Languages at home
- 75% English-only · Spanish 8% Other Indo-European 6% Russian/Polish/Slavic 4%
Political lean MEDSL · Los Angeles
- 2024 margin
- Solid D (+32.9) · D 64.8% · R 31.9% · Other 3.3%
- 2008→2024 swing
- -7.4pp toward R · 2008: 40.4pp · 2024: 32.9pp
- All cycles
- 2024: D+32.9 2020: D+44.2 2016: D+48.0 2012: D+40.0 2008: D+40.4
Not yet ingested
- Civics
- —
Market trends
- HPI YoY
- ▼ -0.10%
- Current HPI
- 310.2427
- Rent YoY
- ▼ -0.07%
- Metro
- Los Angeles-Long Beach-Anaheim, CA
- State GDP YoY
- ▲ 3.21%
- F500 in state
- 116
Industry mix (Fortune 500 HQ in CA)
| Industry | F500 HQs | Revenue |
|---|---|---|
| Technology | 27 | $1,492B |
|
||
| Financial Services | 3 | $174B |
|
||
| Retail | 3 | $44B |
|
||
| Insurance | 3 | $26B |
|
||
| Media / Entertainment | 2 | $115B |
|
||
| Pharmaceuticals / Biotech | 2 | $62B |
|
||
Price history
1 event — show timeline
- 2026-05-15 Listed $2,650,000 TheMLS
Cash-flow waterfall
monthlySold comps — $/sqft
last 12 mo · ≤1 miLoading sold comps…