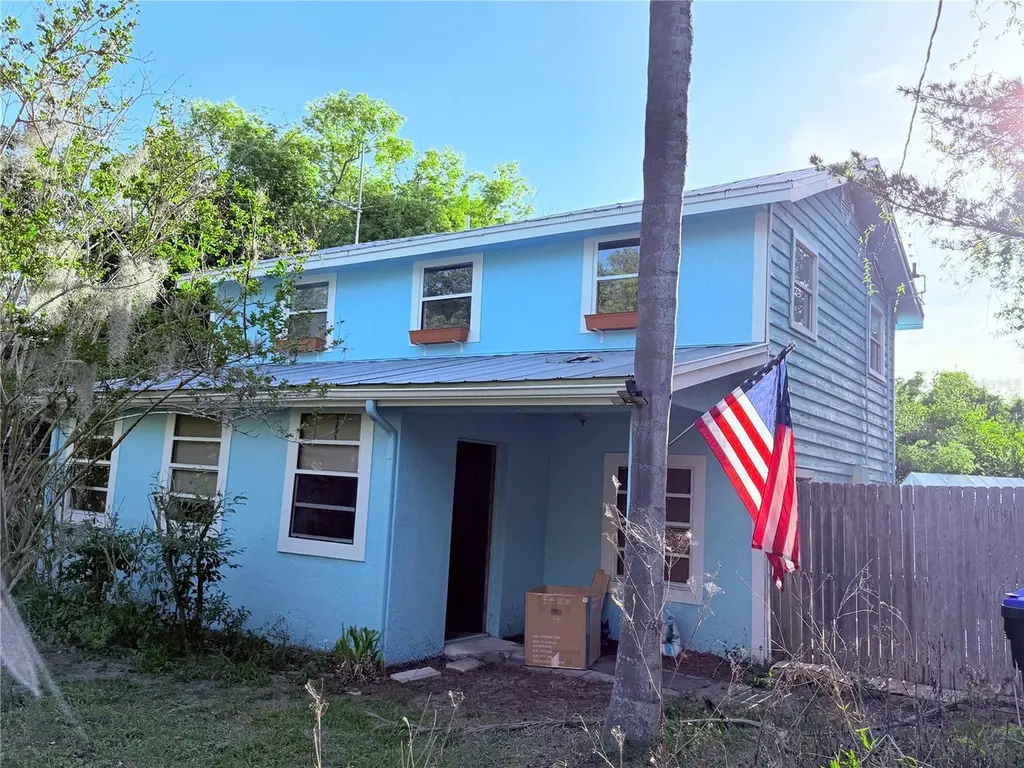
7700 Eden Park Rd · Lockhart, FL
Flood risk 1/10 · Minimal
- FEMA flood zone
- X (unshaded)
- Chance of flooding over 30 yrs
- 0.0%
- Est. flood insurance / yr
- $507 – $1,088
Fire risk 3/10 · Minor
- Est. fire insurance / yr
- $947 – $1,759
Heat risk 8/10 · Major
- Hot days now (above 108°F)
- 7 days/yr
- Hot days in 30 yrs
- 22 days/yr
Wind risk 9/10 · Severe
- Chance of severe wind over 30 yrs
- 99.0%
Air-quality risk 2/10 · Minimal
- Unhealthy air days now
- 0 days/yr
- Unhealthy air days in 30 yrs
- 1 days/yr
Risk factors via First Street. Map © Google.
Why this score? — see what drove the D+ grade
The composite is a weighted blend of 9 inputs, each scored 0–100. Each bar is that input's sub-score; the figure is the points it added to the 100-point composite (weight × sub-score).
- ARV discount +15.0/15.0
- Cash flow +12.9/30.0
- Schools +4.1/10.0
- DSCR +3.9/10.0
- Livability +3.8/5.0
- 1% rule +3.5/10.0
- Rent growth +2.6/5.0
- Condition / age +2.5/5.0
- Appreciation +0.0/10.0
$260,000
🖨 Deal sheet 📄 Offer letter ✓ Due diligence
Listing remarks
Cash buyers and investors, this is your opportunity to unlock serious potential! Situated on a rare 0.90-acre lot in Orlando, this 4-bedroom, 2-bath single-family home offers 1,620 sq ft of living space and was originally built in 1940. The home is a true fixer-upper, ready for a full renovation and your vision. There is a detached shed adds extra storage and utility space. Location is key and this one balance seclusion with accessibility - Just 10 mins to Downtown Orlando, 7 mins from Advent Hospital Orlando, and easy access to major roadways like State Road 528, you’re just a short drive from shopping, dining, and employment hubs while still enjoying the peace and privacy of a large
Key facts
- 0.90-acre lot
- Detached shed
- 0.9 acre lot
Tags
Property features AI
Finance
- Other: Zoned R-1; Lot is oversized, paved, unincorporated and zoned for horses; Approximately 0.9 acre (about 1/2 to less than 1 acre); Vegetation includes trees/landscaping; Other structures on site: shed(s), storage, workshop; Farm type listed for chickens and livestock
- HOA & community: No HOA association indicated
Exterior
- Utilities: Well water; Septic tank; Cable available; Electricity connected; Public utilities available; Water connected
- Home design: Single family residence; Residential property; Two levels; Faces east; Fixer condition; Homestead exempt
- Construction: Stucco and frame construction; Metal roof; Slab foundation; Built as part of a building totaling about 2,076 square feet
- Exterior features: Sliding doors; Other exterior features
Interior
- Kitchen: Range; Refrigerator
- Bedrooms: 4 bedrooms
- Flooring: Laminate; Wood; Other
- Bathrooms: 3 full bathrooms
- Heating & cooling: Ductless heating; Mini-split cooling
- Interior features: Living room and dining room combined
- Laundry & utility: Laundry inside the home
Neighborhood map
What this means for you Summary
Snapshot
- This is a 4-bed/1.0-bath single-family listed at $260k.
Deal economics
- At list price, monthly cash flow is $-19 ($-223/yr) — negative.
- To cash-flow at today's rent, offer at most $257k (1.3% below list).
- To meet the 1% rule (rent ≥ 1% of price), the offer needs to be $220k (15.3% below list).
- Recommended offer: $220k (15.3% below list) — sets the bar for 1% rule.
- Cap rate 6.2% vs local median 4.6% in Lockhart — top-decile yield for the area; either an underpriced asset or a hidden risk that comps aren't pricing in. Stress-test before assuming the spread holds.
Location & tenants
- Location reads 76/100 on livability (#228 in FL, #3,605 nationally) — a middle-class / working-renter tenant base. Strengths: commute A+, cost of living A+, housing A+; Watch: amenities F, health & safety F.
- Orange (suburban): math 46% / reading 51% proficiency, ranked #43 of 73 in FL (top 59%) — families likely to look elsewhere, expect single-tenant / working-renter base with shorter leases.
- Zoned schools: Lockhart Elementary (math 42% / reading 32%, grade F, #1,609 of 2,144 statewide, top 77%, 388 students, 77% FRL); Wekiva High (math 17% / reading 37%, grade F, #478 of 667 statewide, top 73%, 2,207 students, 62% FRL).
- Zoned-school proficiency averages 32% at this address vs 48% district-wide (-16 pts) — the specific schools serving this property underperform the Orange average; the district grade overstates school quality for this exact location.
- Market conditions: Rents flat; 159 active listings in the ZIP; 29 comparable units currently listed for rent nearby; rentals at typical pace (median 16d on market — plan ~3-4 weeks tenant-placement turnaround); 8,053 units permitted in Orange County in 2024 (3,133 in 5+ unit buildings).
- This rent runs 43% of the median local income ($61k/yr) — at the standard rent-burdened threshold; future hikes will face affordability resistance.
Forward outlook
- Local home prices are declining (-3.0%/yr); year-one equity from $2k of loan paydown is wiped out by about $8k of value loss. Plan a longer hold.
- Orange County population projected at +52% by 2050 — long-run rental-demand tailwind backs the buy-and-hold thesis.
Negotiation context
- It's been on market 44 days — a 3% lower offer ($252k) is reasonable based on typical stale-listing flexibility.
- Current owner paid $60k; list at $260k implies a 333% gain — meaningful room to come down on a strong offer.
Risks & watch-outs
- Watch-outs: built in 1940 — expect roof / HVAC / electrical / plumbing capex.
- Climate carrying-cost: severe wind risk, 99% chance of damaging wind over 30y; extreme-heat days projected 7→22/yr by 2055 (HVAC capex compounding) — expect insurance premiums to compound above CPI over the hold.
Questions for the listing agent
- What do current leases actually rent for vs. the listed asking? Can we see a recent rent roll and the last 12 months of T-12 income?
- It's been on market 44 days. Have you received any prior offers? Is the seller open to a 15% concession, seller financing, or rate buy-down credit?
- Built in 1940 — when were the roof, HVAC, electrical panel, plumbing, and water heater last replaced?
- Is there a deadline driving the sale (1031 exchange, divorce, estate, relocation)? That informs how much negotiation room exists.
- The area grade is low — what's the realistic commute time and amenity access for the typical tenant pool here? Any planned neighborhood developments (good or bad) we should know about?
- What's the average days-on-market for RENTAL listings here right now (not sales)? A rising rental-DOM trend means longer vacancies and softer asking-rent achievability than the comps imply.
- What's the recent tenant-quality profile in this submarket — average credit score on applications, eviction rate, late-payment / NSF rate, and stable-employment percentage? A property-management company in the area should have these aggregated.
- How much new for-sale + rental construction is in the pipeline within 1–3 miles? Heavy new supply typically softens prices + rents 12–24 months out; constrained supply supports both.
Investment metrics
- 1% rule
- 0.85% ✗
- Cap rate
- 6.21%
- Cash-on-cash
- -0.31%
- DSCR
- 0.99
- GRM
- 9.8
CMA / ARV
- ARV (on-the-fly)
- $356,400
- Comps found
- 8
Show comp detail 8 sales within ~0.75 mi
| Address | Dist | Beds/Ba | Sqft | Sold | Price | $/sf | Match |
|---|---|---|---|---|---|---|---|
| 4554 Malik Cres | 0.14mi | 3/2.0 (-1) | 1,586 (-2%) | 15mo | $343,750 | $217 | 69 |
| 8315 Camphor Tree Dr | 0.60mi | 3/2.0 (-1) | 1,594 (-2%) | 2mo | $415,000 | $260 | 58 |
| 4568 Eden Woods Cir | 0.20mi | 3/2.0 (-1) | 1,798 (+11%) | 21mo | $376,000 | $209 | 46 |
| 7215 Mott Ave | 0.32mi | 3/2.0 (-1) | 1,505 (-7%) | 23mo | $280,000 | $186 | 45 |
| 5548 Burlwood Dr | 0.70mi | 3/2.0 (-1) | 1,557 (-4%) | 13mo | $379,900 | $244 | 40 |
| 6656 Ryan Chase Ct | 0.68mi | 3/2.5 (-1) | 1,499 (-8%) | 7mo | $329,900 | $220 | 39 |
| 3954 Cherry Apple Cir | 0.53mi | 4/2.0 | 1,799 (+11%) | 23mo | $430,000 | $239 | 34 |
| 5580 Berwood Dr | 0.75mi | 4/2.0 | 1,860 (+15%) | 14mo | $399,000 | $215 | 24 |
Match score weights: distance 35% · size 25% · config 20% · recency 20%. Top-matched comps best support the ARV.
Projected returns pro-forma
-3.0% appreciation · 0.5% rent growth · sell at horizon
- IRR
- -19.6%
- Equity multiple
- 0.33×
- Total profit
- $-48,712
- Equity at exit
- $38,767
- IRR
- -18.6%
- Equity multiple
- 0.11×
- Total profit
- $-65,001
- Equity at exit
- $22,480
Cash invested: $72,800 (down + closing). Projections, not guarantees.
Landlord ↔ Tenant lean methodology
- Overall (STATE)
- 87 Strongly Landlord-Friendly
- State Florida
- 87 Strongly Landlord-Friendly · R+3
- County
- — inherits STATE
- City
- — inherits STATE
ZIP-level market 32810
- Home prices YoY
- -18.5%
- Rents YoY
- 0.5%
- Active inventory
- 159
- Price-to-rent
- 9.8×
Monthly cashflow live
- Estimated rent
- $2,202 high interval (Pro) →
- Mortgage (P&I)
- −$1,363
- Tax from tax record
- −$287 /mo · $3,439/yr
- Insurance
- −$108
- HOA
- −$0
- Vacancy / Maint / Mgmt
- −$462
- Net cashflow
- $-19
Break-even live
UW: 25.0% down · 7.5% · 30yr · 1.5% tax · 5.0% vac · 8.0% maint · 8.0% mgmt
Financing live
Cash to close
- Down payment
- $65,000
- Closing costs
- $7,800
- Reserves months
- —
- Total cash needed
- —
Loan-product check · same deal, 3 products live
Conventional
25% down · 7.5% · 30yr
- Down + closing
- —
- Monthly P&I
- —
- Monthly cashflow
- —
- DSCR
- —
- Eligible?
- —
Personal DTI + credit; lowest rate.
DSCR
20% down · 8.5% · 30yr
- Down + closing
- —
- Monthly P&I
- —
- Monthly cashflow
- —
- DSCR
- —
- Eligible?
- —
No personal income docs; deal must DSCR.
Hard money
10% down · 12.0% · 12mo
- Down + closing
- —
- Monthly P&I
- —
- Monthly cashflow
- —
- DSCR
- —
- Eligible?
- —
Short-term bridge; refi at stabilization.
Rent comps 29 comps
| Address | Beds | Baths | Sqft | Rent | $/sqft | DOM | Units | Dist |
|---|---|---|---|---|---|---|---|---|
| 7151 Edgewater Shores Ct Orlando, FL | 3.0 | 2.0 | 1155 | $2,100 | $1.82 | 2d | 1 | 0.40mi |
| 5420 Blue Grass St Orlando, FL | 3.0 | 2.0 | 1544 | $2,140 | $1.39 | 7d | 1 | 0.40mi |
| 3806 Groome Dr Orlando, FL | 3.0 | 2.0 | 1111 | $2,400 | $2.16 | 23d | 1 | 0.60mi |
| 5412 Ashmeade Rd Orlando, FL | 3.0 | 2.0 | 1587 | $2,320 | $1.46 | 16d | 1 | 0.60mi |
| 3757 Clubside Pointe Dr Orlando, FL | 3.0 | 2.0 | 1264 | $1,750 | $1.38 | 23d | 1 | 0.60mi |
| 3908 Magnolia Pointe Ln Orlando, FL | 3.0 | 2.0 | 1208 | $1,795 | $1.49 | 23d | 1 | 0.60mi |
| 6741 Magnolia Pointe Cir Orlando, FL | 3.0 | 2.0 | 1248 | $1,695 | $1.36 | 23d | 1 | 0.62mi |
| 3717 Clubside Pointe Dr Unit 1 Orlando, FL | 3.0 | 3.0 | 1344 | $2,100 | $1.56 | 23d | 1 | 0.64mi |
| 3940 Alpert Dr Orlando, FL | 3.0 | 1.5 | 1100 | $1,695 | $1.54 | 14d | 1 | 0.66mi |
| 5611 New Cambridge Rd Orlando, FL | 4.0 | 2.0 | 1452 | $2,050 | $1.41 | 20d | 1 | 0.69mi |
| 3911 Alpert Dr Orlando, FL | 3.0 | 2.0 | 1278 | $1,795 | $1.40 | 2d | 1 | 0.70mi |
| 8423 Baywood Vista Dr Orlando, FL | 3.0 | 2.0 | 2082 | $2,650 | $1.27 | 23d | 1 | 0.72mi |
| 3709 Needles Dr Orlando, FL | 3.0 | 1.5 | 1250 | $1,750 | $1.40 | 14d | 1 | 0.78mi |
| 4048 Mallard Point Ct Orlando, FL | 3.0 | 2.5 | 2120 | $3,000 | $1.42 | 21d | 1 | 0.89mi |
| 1232 Woodridge Ct Altamonte Springs, FL | 3.0 | 2.5 | 2036 | $2,475 | $1.22 | 23d | 1 | 1.00mi |
| 4437 Cluster Dr Orlando, FL | 3.0 | 3.0 | 1518 | $2,495 | $1.64 | 23d | 1 | 1.03mi |
| 5410 Old Oak Tree Dr Orlando, FL | 3.0 | 2.0 | 1627 | $2,100 | $1.29 | 20d | 1 | 1.11mi |
| 5419 Stirrup Way Orlando, FL | 3.0 | 2.0 | 1420 | $2,000 | $1.41 | 23d | 1 | 1.12mi |
| 3108 Pembrook Dr Orlando, FL | 3.0 | 2.0 | 1346 | $2,210 | $1.64 | 4d | 1 | 1.14mi |
| 3120 Drake Dr Unit 1258738P Orlando, FL | 3.0 | 2.0 | 1442 | $6,376 | $4.42 | 2d | 1 | 1.17mi |
| 7618 Forest City Rd Orlando, FL | 1.0–3.0 | 1.0–2.0 | 937 | $1,662 | $1.77 | 4d | 3 | 1.24mi |
| 7120 Forest City Rd Orlando, FL | 1.0–3.0 | 1.0–2.0 | 912 | $1,499 | $1.64 | 7d | 11 | 1.24mi |
| 9434 Bear Lake Rd Forest City, FL | 3.0 | 2.0 | 1074 | $3,500 | $3.26 | 4d | 1 | 1.25mi |
| 2600 Lake Betty Blvd Apopka, FL | 1.0–3.0 | 1.0–2.0 | 956 | $2,421 | $2.53 | 1d | 41 | 1.26mi |
| 5224 Long Rd Orlando, FL | 2.0–4.0 | 1.5–2.5 | 1426 | $2,142 | $1.50 | 2d | 17 | 1.32mi |
| 858 Grand Regency Pointe #103 Altamonte Springs, FL | 3.0 | 2.0 | 1194 | $1,800 | $1.51 | 3d | 1 | 1.40mi |
| 860 Grand Regency Pointe Altamonte Springs, FL | 3.0 | 2.0 | 1266 | $1,750 | $1.38 | 23d | 1 | 1.41mi |
| 2617 Drake Dr Orlando, FL | 3.0 | 2.0 | 1347 | $2,001 | $1.49 | 23d | 1 | 1.43mi |
| 9301 Summit Dr Orlando, FL | 3.0 | 1.0–2.0 | 1012 | $2,495 | $2.47 | 2d | 51 | 1.46mi |
Listing history 5 events
-
2026-05-08price $260,000
-
2026-04-15$310,000 Active
-
1989-07-01soldstatus $60,000
-
1976-06-01soldstatus $15,500
-
1975-06-01soldstatus $12,000
ⓘ Source: listings_history table (triggers on properties + properties_extension) + one-shot
backfill from property_details.listing_events for pre-trigger history.
Tax reassessment forecast FL · Resets to sale price
- Current annual tax
- $3,439 · $287/mo
- Projected year-2 tax
- $3,439 · $287/mo
- Expected delta
- $0/yr ($0/mo · 0.0%)
ⓘ Screening estimate from a state-policy table — verify with the county assessor before closing.
Climate risk First Street
- Flood 1/10 Low FEMA zone X (unshaded) · 0% chance over 30 yrs
- Wildfire 3/10 Moderate
- Heat 8/10 Severe 7 d/yr ≥108°F today · 22 d/yr by 30 yrs out
- Wind 9/10 Extreme 99% chance of damaging wind over 30 yrs
- Air quality 2/10 Low 0 unhealthy d/yr today · 1 by 30 yrs out
Nearby sold comps map
Loading sold comps map…
Walkable amenities ~0.75 mi
Loading nearby amenities…
Taxation est. · year 1
- Rental income
- $26,427
- − Mortgage interest
- −$14,564
- − Property taxes
- −$3,439
- − Insurance
- −$1,300
- − Repairs & maintenance
- −$2,114
- − Management
- −$2,114
- − Depreciation
- −$7,564
- Taxable loss
- −$4,668
- Est. tax savings @ 24.0%
- +$1,120
- After-tax cash flow
- $897/yr
For passive investors: Depreciation is non-cash, so a rental often shows a tax loss while cash-flowing — sheltering income. Rental losses are passive: they offset passive income freely, and up to $25,000/yr can offset ordinary (W-2) income if you actively participate and your MAGI is under $100k (phasing out to $0 by $150k); unused losses carry forward. On sale, claimed depreciation is recaptured at up to 25%, and gains may owe capital-gains tax (a 1031 exchange can defer both). Figures are a year-1 estimate at your 24.0% rate — not tax advice; consult a CPA.
Schools (NCES district)
- District
- Orange
- NCES district ID
- 1201440
- Math proficiency
- 46% ▼ -9.00%
- Reading proficiency
- 51% ▼ -2.00%
- Median HH income
- $49,350
- Composite
- 41.47/100
- National rank
- #3461
- State rank
- #43 of 73 in FL
Livability — Lockhart
- Score
- 76/100
- State rank
- #228
- US rank
- #3605
Category grades
Schools grade is shown separately in the Schools card above.
Census & demographics
- Census place
- Lockhart, FL
- County
- Orange County · 1,471,359 people
- City population
- 37,127
- Metro
- Orlando-Kissimmee-Sanford, FL
- Population (ZIP)
- 36,927
- Household income
- $60,799
- Rent vs Own
- Severe rent burden
- 1859.0
Population outlook (Orange County) Hauer SSP2
- Today (2025)
- 1,618,226 people
- By 2030
- 1,787,404 · +10.5%
- By 2040
- 2,125,621 · +31.4%
- By 2050
- 2,454,016 · +51.6%
- By 2075
- 3,173,711 · +96.1%
- By 2100
- 3,607,781 · +122.9%
Race, ethnicity, and origin ACS 2023
- Neighborhood character
- Highly diverse neighborhood (Simpson 0.72)
- Race & ethnicity
- Black 35% Hispanic / Latino 29% White 25% Two or more races 16% Asian 3% Native American 1%
- Hispanic origin (detail)
- Mexican 2% Puerto Rican 17% Cuban 3%
- Common ancestry
- Hispanic 9% Lithuanian 1% Slovak 1%
- Foreign-born
- 19% · Canada, Vietnam, Jamaica
- Languages at home
- 67% English-only · Spanish 21% French/Haitian/Cajun 7% Other Indo-European 1%
Political lean MEDSL · Orange
- 2024 margin
- D (+13.6) · D 56.1% · R 42.5% · Other 1.3%
- 2008→2024 swing
- -5.0pp toward R · 2008: 18.6pp · 2024: 13.6pp
- All cycles
- 2024: D+13.6 2020: D+23.1 2016: D+24.6 2012: D+18.2 2008: D+18.6
Not yet ingested
- Civics
- —
Market trends
- HPI YoY
- ▼ -78.77%
- Current HPI
- 347.7447
- Rent YoY
- ▲ 0.50%
- Metro
- Orlando-Kissimmee-Sanford, FL
- State GDP YoY
- ▲ 3.28%
- F500 in state
- 36
Industry mix (Fortune 500 HQ in FL)
| Industry | F500 HQs | Revenue |
|---|---|---|
| Industrial Technology | 2 | $29B |
|
||
| Insurance | 2 | $17B |
|
||
| Retail | 1 | $60B |
|
||
| Technology Distribution | 1 | $58B |
|
||
| Homebuilding | 1 | $35B |
|
||
| Technology Manufacturing | 1 | $35B |
|
||
Price history
+2066.7% since first listed5 events — show timeline
- 2026-05-08 Price Changed $260,000 Stellar MLS as Distributed by MLS Grid
- 2026-04-15 Listed $310,000 Stellar MLS as Distributed by MLS Grid
- 1989-07-01 Sold (Public Records) $60,000 Public Records
- 1976-06-01 Sold (Public Records) $15,500 Public Records
- 1975-06-01 Sold (Public Records) $12,000 Public Records
Property tax history
+8.9%/yrLatest (2025): $3,439 · +9.7% YoY. Source: county tax records.
Cash-flow waterfall
monthlySold comps — $/sqft
last 12 mo · ≤1 miLoading sold comps…