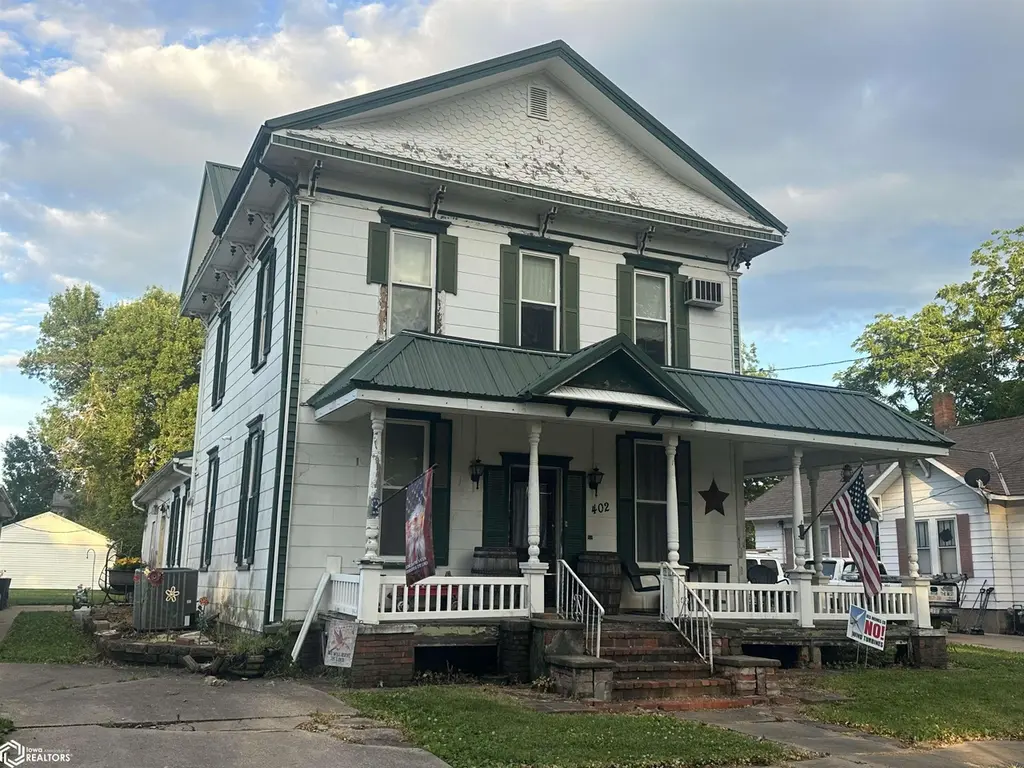
402 N Park St · Mediapolis, IA
Flood risk 1/10 · Minimal
- FEMA flood zone
- X (unshaded)
- Chance of flooding over 30 yrs
- 0.0%
- Est. flood insurance / yr
- $507 – $1,088
Fire risk 2/10 · Minimal
- Est. fire insurance / yr
- $902 – $1,676
Heat risk 3/10 · Minor
- Hot days now (above 106°F)
- 7 days/yr
- Hot days in 30 yrs
- 15 days/yr
Wind risk 2/10 · Minimal
- Chance of severe wind over 30 yrs
- —
Air-quality risk 2/10 · Minimal
- Unhealthy air days now
- 1 days/yr
- Unhealthy air days in 30 yrs
- 2 days/yr
Risk factors via First Street. Map © Google.
Why this score? — see what drove the C- grade
The composite is a weighted blend of 9 inputs, each scored 0–100. Each bar is that input's sub-score; the figure is the points it added to the 100-point composite (weight × sub-score).
- ARV discount +15.0/15.0
- Cash flow +12.4/30.0
- Schools +6.6/10.0
- Livability +4.0/5.0
- DSCR +3.7/10.0
- 1% rule +3.5/10.0
- Appreciation +3.0/10.0
- Rent growth +2.5/5.0
- Condition / age +2.5/5.0
$119,900
🖨 Deal sheet (PDF) 📄 Offer letter ✓ Due diligence
Listing remarks
Two story home nestled in Mediapolis across from Cartwright Park - plus a hard to find 24x56 garage! Spacious living room with hardwood floors and formal dining room with stunning woodwork, and main floor office would make a nice 4th bedroom if needed. Additionally, an open kitchen (fridge and stove included) and full bathroom with laundry (washer/dryer included) complete the main level. The upstairs offers three bedrooms and an additional bathroom. Open front porch for your enjoyment and an enclosed back porch adds to the character of this home.
Key facts
- Formal dining room
- Full bathroom
- Hard to find garage
Tags
Property features AI
Finance
- Other:
- Financial info:
- HOA & community:
Exterior
- Parking: Detached 4-car garage
- Security:
- Utilities: Public water; Public sewer
- Home design: Two-story single family residence; Residential property
- Construction: Wood siding construction
- Exterior features: Metal roof
Interior
- Kitchen: Range; Refrigerator
- Bedrooms:
- Flooring:
- Bathrooms: 2 full bathrooms
- Heating & cooling: Forced air heating; Central air conditioning
- Interior features: Range; Refrigerator; Washer; Dryer; Basement
- Laundry & utility: Washer; Dryer
Neighborhood map
What this means for you Summary
Snapshot
- This is a 4-bed/2.0-bath single-family listed at $120k.
Deal economics
- At list price, monthly cash flow is $-19 ($-232/yr) — negative.
- To cash-flow at today's rent, offer at most $116k (2.9% below list).
- To meet the 1% rule (rent ≥ 1% of price), the offer needs to be $102k (14.8% below list).
- Recommended offer: $102k (14.8% below list) — sets the bar for 1% rule.
Location & tenants
- Location reads 79/100 on livability (#94 in IA, #1,985 nationally) — a middle-class / working-renter tenant base. Strengths: crime A+, cost of living A+, housing A+; Watch: amenities F, commute F.
- Mediapolis Community School District (rural): math 75% / reading 79% proficiency, ranked #48 of 289 in IA (top 17%) — strong family-tenant draw, lease renewals of 3-5y typical.
- Zoned schools: Mediapolis Elementary School (math 73% / reading 67%, grade A-, #221 of 616 statewide, top 36%, 446 students, 33% FRL); Mediapolis Middle School (math 80% / reading 85%, grade A+, #16 of 246 statewide, top 8%, 227 students, 31% FRL); Mediapolis High School (math 72% / reading 82%, grade A-, #60 of 336 statewide, top 21%, 295 students, 28% FRL).
- Market conditions: 8 active listings in the ZIP; 53 units permitted in Des Moines County in 2024 (40 in 5+ unit buildings).
Forward outlook
- Local home prices are declining (-3.0%/yr); year-one equity from $829 of loan paydown is wiped out by about $4k of value loss. Plan a longer hold.
- Des Moines County population projected to shrink 6% by 2050 — rents likely to lag national; underwrite the cash flow, not the appreciation.
Negotiation context
- Only 13 days on market — expect competitive offers; lowballing is unlikely to land.
- Current owner paid $85k; 41% above their basis — modest negotiation headroom, anchor on the comps not their cost.
Risks & watch-outs
- Watch-outs: built in 1893 — expect roof / HVAC / electrical / plumbing capex.
Questions for the listing agent
- What do current leases actually rent for vs. the listed asking? Can we see a recent rent roll and the last 12 months of T-12 income?
- Built in 1893 — when were the roof, HVAC, electrical panel, plumbing, and water heater last replaced?
- Is there a deadline driving the sale (1031 exchange, divorce, estate, relocation)? That informs how much negotiation room exists.
- Schools are A-rated — typically a magnet for longer-tenancy family renters. What's the average tenant stay here, and is there a school-zone premium baked into asking?
- What's the average days-on-market for RENTAL listings here right now (not sales)? A rising rental-DOM trend means longer vacancies and softer asking-rent achievability than the comps imply.
- What's the recent tenant-quality profile in this submarket — average credit score on applications, eviction rate, late-payment / NSF rate, and stable-employment percentage? A property-management company in the area should have these aggregated.
- How much new for-sale + rental construction is in the pipeline within 1–3 miles? Heavy new supply typically softens prices + rents 12–24 months out; constrained supply supports both.
Investment metrics
- 1% rule
- 0.85% ✗
- Cap rate
- 6.10%
- Cash-on-cash
- -0.69%
- DSCR
- 0.97
- GRM
- 9.8
CMA / ARV
- ARV (on-the-fly)
- $195,372
- Comps found
- 11
Show comp detail 11 sales within ~0.75 mi
| Address | Dist | Beds/Ba | Sqft | Sold | Price | $/sf | Match |
|---|---|---|---|---|---|---|---|
| 800 High St | 0.10mi | 4/2.0 | 2,047 (+13%) | 7mo | $315,000 | $154 | 68 |
| 804 North St | 0.08mi | 3/2.0 (-1) | 1,992 (+10%) | 12mo | $112,500 | $56 | 65 |
| 205 S Cedar St | 0.27mi | 3/2.0 (-1) | 1,926 (+6%) | 10mo | $250,000 | $130 | 63 |
| 417 Main St | 0.26mi | 3/1.5 (-1) | 1,808 (-0%) | 23mo | $140,000 | $77 | 62 |
| 128 S Northfield St | 0.25mi | 3/2.0 (-1) | 1,700 (-6%) | 15mo | $183,000 | $108 | 61 |
| 386 Green Acres Dr | 0.48mi | 3/3.0 (-1) | 1,752 (-3%) | 4mo | $275,000 | $157 | 60 |
| 301 Laci Dru Dr | 0.59mi | 5/3.0 (+1) | 1,800 (-0%) | 8mo | $528,000 | $293 | 56 |
| 330 S Harrison St | 0.40mi | 3/2.0 (-1) | 1,960 (+8%) | 16mo | $130,000 | $66 | 48 |
| 314 N Northfield St | 0.07mi | 3/1.0 (-1) | 1,537 (-15%) | 17mo | $92,000 | $60 | 48 |
| 1106 Huron St St | 0.54mi | 4/3.0 | 1,696 (-6%) | 22mo | $330,000 | $195 | 43 |
| 23379 120th Ave Ave | 0.69mi | 3/3.0 (-1) | 1,994 (+10%) | 20mo | $215,000 | $108 | 25 |
Match score weights: distance 35% · size 25% · config 20% · recency 20%. Top-matched comps best support the ARV.
Projected returns pro-forma
-3.0% appreciation · 3.0% rent growth · sell at horizon
- IRR
- -17.4%
- Equity multiple
- 0.38×
- Total profit
- $-20,647
- Equity at exit
- $17,877
- IRR
- -9.4%
- Equity multiple
- 0.42×
- Total profit
- $-19,508
- Equity at exit
- $10,367
Cash invested: $33,572 (down + closing). Projections, not guarantees.
Landlord ↔ Tenant lean methodology
- Overall (STATE)
- 83 Strongly Landlord-Friendly
- State Iowa
- 83 Strongly Landlord-Friendly · R+6
- County
- — inherits STATE
- City
- — inherits STATE
ZIP-level market 52637
- Home prices YoY
- -1.8%
- Active inventory
- 8
- Price-to-rent
- 9.8×
Monthly cashflow live
- Estimated rent
- $1,022 medium interval (Pro) →
- Mortgage (P&I)
- −$629
- Tax from tax record
- −$148 /mo · $1,776/yr
- Insurance
- −$50
- HOA
- −$0
- Lot rent
- −$0
- Vacancy / Maint / Mgmt
- −$215
- Net cashflow
- $-19
Break-even live
Sensitivity live
| Price | -10% $49 | -5% $15 | +0% $-19 | +5% $-53 | +10% $-87 |
|---|---|---|---|---|---|
| Rent | -10% $-100 | -5% $-60 | +0% $-19 | +5% $21 | +10% $61 |
| Rate | -1.0pp $41 | -0.5pp $11 | base $-19 | +0.5pp $-50 | +1.0pp $-82 |
UW: 25.0% down · 7.5% · 30yr · 1.5% tax · 5.0% vac · 8.0% maint · 8.0% mgmt
Financing live
Cash to close
- Down payment
- $29,975
- Closing costs
- $3,597
- Reserves months
- —
- Total cash needed
- —
Loan-product check · same deal, 3 products live
Conventional
25% down · 7.5% · 30yr
- Down + closing
- —
- Monthly P&I
- —
- Monthly cashflow
- —
- DSCR
- —
- Eligible?
- —
Personal DTI + credit; lowest rate.
DSCR
20% down · 8.5% · 30yr
- Down + closing
- —
- Monthly P&I
- —
- Monthly cashflow
- —
- DSCR
- —
- Eligible?
- —
No personal income docs; deal must DSCR.
Hard money
10% down · 12.0% · 12mo
- Down + closing
- —
- Monthly P&I
- —
- Monthly cashflow
- —
- DSCR
- —
- Eligible?
- —
Short-term bridge; refi at stabilization.
Listing history 10 events
-
2026-06-22days on market $119,900 Active 13 DOM
-
2026-06-21days on market $119,900 Active 12 DOM
-
2026-06-19days on market $119,900 Active 10 DOM
-
2026-06-18days on market $119,900 Active 9 DOM
-
2026-06-17days on market $119,900 Active 8 DOM
-
2026-06-16days on market $119,900 Active 7 DOM
-
2026-06-15days on market $119,900 Active 6 DOM
-
2026-06-14days on market $119,900 Active 4 DOM
-
2026-06-12remarks 552-char remark
-
2026-06-12$119,900 Active 3 DOM
ⓘ Source: listings_history table (triggers on properties + properties_extension) + one-shot
backfill from property_details.listing_events for pre-trigger history.
Tax reassessment forecast IA · Partial reset (capped growth)
- Current annual tax
- $1,776 · $148/mo
- Projected year-2 tax
- $1,829 · $152/mo
- Expected delta
- +$53/yr (+$4/mo · 3.0%)
ⓘ Screening estimate from a state-policy table — verify with the county assessor before closing.
Climate risk First Street
- Flood 1/10 Low FEMA zone X (unshaded) · 0% chance over 30 yrs
- Wildfire 2/10 Low
- Heat 3/10 Moderate 7 d/yr ≥106°F today · 15 d/yr by 30 yrs out
- Wind 2/10 Low
- Air quality 2/10 Low 1 unhealthy d/yr today · 2 by 30 yrs out
Nearby sold comps map
Loading sold comps map…
Walkable amenities ~0.75 mi
Loading nearby amenities…
Taxation est. · year 1
- Rental income
- $12,264
- − Mortgage interest
- −$6,716
- − Property taxes
- −$1,776
- − Insurance
- −$600
- − Repairs & maintenance
- −$981
- − Management
- −$981
- − Depreciation
- −$3,488
- Taxable loss
- −$2,278
- Est. tax savings @ 24.0%
- +$547
- After-tax cash flow
- $315/yr
For passive investors: Depreciation is non-cash, so a rental often shows a tax loss while cash-flowing — sheltering income. Rental losses are passive: they offset passive income freely, and up to $25,000/yr can offset ordinary (W-2) income if you actively participate and your MAGI is under $100k (phasing out to $0 by $150k); unused losses carry forward. On sale, claimed depreciation is recaptured at up to 25%, and gains may owe capital-gains tax (a 1031 exchange can defer both). Figures are a year-1 estimate at your 24.0% rate — not tax advice; consult a CPA.
Schools (NCES district)
- District
- Mediapolis Community School District
- NCES district ID
- 1918930
- Math proficiency
- 75% ▼ -1.00%
- Reading proficiency
- 79% ▲ 1.00%
- Median HH income
- $53,939
- Composite
- 65.54/100
- National rank
- #470
- State rank
- #48 of 289 in IA
Livability — Mediapolis
- Score
- 79/100
- State rank
- #94
- US rank
- #1985
Category grades
Schools grade is shown separately in the Schools card above.
Census & demographics
- Census place
- Mediapolis, IA
- Population (ZIP)
- 3,054
Population outlook (Des Moines County) Hauer SSP2
- Today (2025)
- 39,735 people
- By 2030
- 39,257 · -1.2%
- By 2040
- 38,090 · -4.1%
- By 2050
- 37,156 · -6.5%
- By 2075
- 36,905 · -7.1%
- By 2100
- 37,222 · -6.3%
Race, ethnicity, and origin ACS 2023
- Neighborhood character
- Predominantly White (87%)
- Race & ethnicity
- White 87% Two or more races 8% Hispanic / Latino 3% Asian 2%
- Common ancestry
- Iranian 4% Portuguese 3% Italian 1%
- Foreign-born
- 2% · Canada
- Languages at home
- 98% English-only · Spanish 1% Other Asian/Pacific 1%
Political lean MEDSL · Des Moines
- 2024 margin
- R (+15.1) · D 41.8% · R 56.8% · Other 1.4%
- 2008→2024 swing
- -38.1pp toward R · 2008: 23.0pp · 2024: -15.1pp
- All cycles
- 2024: R+15.1 2020: R+8.5 2016: R+7.0 2012: D+18.5 2008: D+23.0
Not yet ingested
- Civics
- —
Market trends
- HPI YoY
- ▼ -4.05%
- Current HPI
- 225.0374
- Rent YoY
- —
- Metro
- —
- State GDP YoY
- ▲ 2.48%
- F500 in state
- 4
Industry mix (Fortune 500 HQ in IA)
| Industry | F500 HQs | Revenue |
|---|---|---|
| Financial Services | 1 | $16B |
|
||
| Retail / Convenience | 1 | $15B |
|
||
Price history
+41.1% since first listed2 events — show timeline
- 2026-06-08 Listed $119,900 IAR
- 2012-09-13 Sold (Public Records) $85,000 Public Records
Property tax history
+0.4%/yrLatest (2025): $1,776 · +2.7% YoY. Source: county tax records.
Cash-flow waterfall
monthlySold comps — $/sqft
last 12 mo · ≤1 miLoading sold comps…