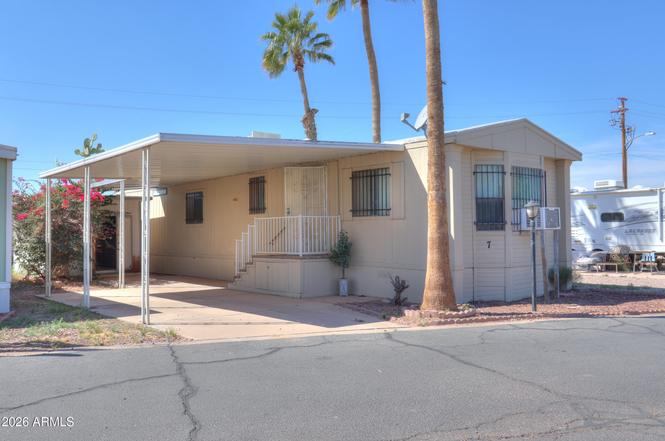
120 W O'neil Dr #7 · Casa Grande, AZ
Flood risk 1/10 · Minimal
- FEMA flood zone
- X (unshaded)
- Chance of flooding over 30 yrs
- 0.0%
- Est. flood insurance / yr
- $507 – $1,088
Fire risk 4/10 · Minor
- Est. fire insurance / yr
- $610 – $1,132
Heat risk 9/10 · Severe
- Hot days now (above 113°F)
- 7 days/yr
- Hot days in 30 yrs
- 18 days/yr
Wind risk 1/10 · Minimal
- Chance of severe wind over 30 yrs
- —
Air-quality risk 2/10 · Minimal
- Unhealthy air days now
- 1 days/yr
- Unhealthy air days in 30 yrs
- 1 days/yr
Risk factors via First Street. Map © Google.
Why this score? — see what drove the B- grade
The composite is a weighted blend of 9 inputs, each scored 0–100. Each bar is that input's sub-score; the figure is the points it added to the 100-point composite (weight × sub-score).
- Cash flow +30.0/30.0
- 1% rule +10.0/10.0
- DSCR +10.0/10.0
- ARV discount +7.7/15.0
- Rent growth +3.7/5.0
- Livability +2.9/5.0
- Condition / age +2.2/5.0
- Schools +1.5/10.0
- Appreciation +0.0/10.0
$44,000
🖨 Deal sheet 📄 Offer letter ✓ Due diligence
Listing remarks
Welcome to the gated Safari Mobile Home Adult Community. Enjoy these included amenities: Community Pool & Clubhouse. This 1989 Palm Harbor single-wide manufactured home offers 2 bedrooms and one full bathroom with approximately 960 sq ft of living space. The Palm Harbor features newer exterior paint, textured and painted ceilings throughout, an updated bathroom, and updated flooring in the great room, hallway, and bedrooms. The great room includes built-in shelving plus unique built-in-storage with decorative glass. The kitchen has an eating bar, pantry, gas slide-in stove, refrigerator, and dishwasher. The electric washer and dryer are included. Additional features: full-size gas hot
Key facts
- 2 parking spots
- Community pool
- Built 1989
Property features AI
Finance
- Other: Lot size not available
- HOA & community: Land lease (monthly); Land lease: $474 per month; No association fees included; Community pool; Biking/walking path
Exterior
- Parking: 2 covered parking spaces; 2 carport spaces
- Security: Gated community
- Utilities: Private water company; Public sewer
- Home design: Manufactured/mobile home; Leasehold ownership
- Construction: Wood siding; Painted exterior; Foam roof
- Exterior features: Gravel/stone front yard; Gravel/stone backyard; Shed(s); Fencing (other)
Interior
- Kitchen: Refrigerator; Dishwasher; Pantry; Laminate counters
- Bedrooms: 2 possible bedrooms
- Flooring: Laminate; Vinyl; Other
- Bathrooms: 1 full bathroom
- Heating & cooling: Has heating; Has cooling; Window/wall AC units; Other cooling
- Interior features: Eat-in kitchen; Breakfast bar; No interior steps; Pantry; Laminate counters
- Laundry & utility: Washer/dryer hookup only
Neighborhood map
What this means for you Summary
Snapshot
- This is a 2-bed/1.0-bath manufactured listed at $44k. Condition is rated fair.
Deal economics
- At list price, monthly cash flow is $738 ($9k/yr) — positive.
- The deal already cash-flows at list — no discount required.
- Meets the 1% rule at list price ($1k rent vs $44k).
- Recommended offer: $40k (9.0% below list) — sets the bar for market timing.
- Cap rate 26.4% vs local median 4.1% in Casa Grande — top-decile yield for the area; either an underpriced asset or a hidden risk that comps aren't pricing in. Stress-test before assuming the spread holds.
Location & tenants
- Location reads 58/100 on livability (#220 in AZ) — a working-class tenant base; expect higher turnover. Strengths: cost of living A+, housing A+; Watch: crime D+, employment D+, schools F.
- Casa Grande Union High School District (4453) (suburban): math 14% / reading 21% proficiency, ranked #193 of 249 in AZ (top 78%) — low school quality limits family demand, transient renter base, plan for 1-2y turnover.
- Market conditions: Rents rising fast (+4.6%/yr); 628 active listings in the ZIP; 22 comparable units currently listed for rent nearby; rentals at typical pace (median 15d on market — plan ~3-4 weeks tenant-placement turnaround); 9,504 units permitted in Pinal County in 2024 (776 in 5+ unit buildings).
Forward outlook
- Local home prices are declining (-3.0%/yr); year-one equity from $304 of loan paydown is wiped out by about $1k of value loss. Plan a longer hold.
- At projected returns (-3.0% appreciation + 4.6% rent growth), your $12k cash investment doubles in ~2 years — after that, you're playing with house money.
Negotiation context
- It's been on market 99 days — a 9% lower offer ($40k) is reasonable based on typical stale-listing flexibility.
Risks & watch-outs
- Climate carrying-cost: extreme-heat days projected 7→18/yr by 2055 (HVAC capex compounding) — expect insurance premiums to compound above CPI over the hold.
Questions for the listing agent
- It's been on market 99 days. Have you received any prior offers? Is the seller open to a 9% concession, seller financing, or rate buy-down credit?
- Have any recent inspections been done? Can we get a copy of the seller's disclosures and any deferred-maintenance estimates?
- Why hasn't it sold? Are there any deal-killer items the seller is aware of (foundation, flood, title, zoning, code violations)?
- Is there a deadline driving the sale (1031 exchange, divorce, estate, relocation)? That informs how much negotiation room exists.
- Schools are F-rated, which usually means shorter tenancies and higher turnover. Who's the typical renter profile here, and what's been the actual vacancy rate?
- Crime grade is D in this area — have there been break-ins, vandalism, or insurance claims at this property in the last 3 years? What carrier currently insures it and at what premium?
- What's the average days-on-market for RENTAL listings here right now (not sales)? A rising rental-DOM trend means longer vacancies and softer asking-rent achievability than the comps imply.
- What's the recent tenant-quality profile in this submarket — average credit score on applications, eviction rate, late-payment / NSF rate, and stable-employment percentage? A property-management company in the area should have these aggregated.
- How much new for-sale + rental construction is in the pipeline within 1–3 miles? Heavy new supply typically softens prices + rents 12–24 months out; constrained supply supports both.
Investment metrics
- 1% rule
- 3.00% ✓
- Cap rate
- 26.43%
- Cash-on-cash
- 71.91%
- DSCR
- 4.20
- GRM
- 2.8
CMA / ARV
- ARV (on-the-fly)
- $44,160
- Comps found
- 12
Show comp detail 12 sales within ~0.75 mi
| Address | Dist | Beds/Ba | Sqft | Sold | Price | $/sf | Match |
|---|---|---|---|---|---|---|---|
| 120 W Oneil Dr #71 | 0.03mi | 2/2.0 | 960 (0%) | 5mo | $38,000 | $40 | 90 |
| 120 W Oneil Dr #48 | 0.05mi | 2/1.5 | 980 (+2%) | 2mo | $20,000 | $20 | 90 |
| 120 W O'neil Dr #58 | 0.05mi | 3/2.0 (+1) | 1,056 (+10%) | 2mo | $48,999 | $46 | 70 |
| 450 W Sunwest Dr #69 | 0.50mi | 2/2.0 | 960 (0%) | 4mo | $67,500 | $70 | 69 |
| 426 W Cottonwood Ln #25 | 0.34mi | 2/2.0 | 930 (-3%) | 8mo | $60,000 | $65 | 69 |
| 450 W Sunwest Dr #135 | 0.41mi | 2/2.0 | 960 (0%) | 10mo | $53,000 | $55 | 68 |
| 426 W Cottonwood Ln #83 | 0.37mi | 2/2.0 | 1,045 (+9%) | 1mo | $78,000 | $75 | 63 |
| 450 W Sunwest Dr #111 | 0.41mi | 2/2.0 | 1,024 (+7%) | 6mo | $45,000 | $44 | 60 |
| 450 W Sunwest Dr #1 | 0.41mi | 2/1.0 | 896 (-7%) | 13mo | $59,000 | $66 | 59 |
| 450 W Sunwest Dr #21 | 0.41mi | 2/2.0 | 896 (-7%) | 12mo | $40,000 | $45 | 56 |
| 1451 N Pinal Ave #31 | 0.61mi | 1/1.0 (-1) | 900 (-6%) | 11mo | $15,000 | $17 | 47 |
| 1451 N Pinal Ave #23 | 0.61mi | 1/1.0 (-1) | 900 (-6%) | 14mo | $9,000 | $10 | 44 |
Match score weights: distance 35% · size 25% · config 20% · recency 20%. Top-matched comps best support the ARV.
Projected returns pro-forma
-3.0% appreciation · 4.6% rent growth · sell at horizon
- IRR
- 73.4%
- Equity multiple
- 4.41×
- Total profit
- $42,068
- Equity at exit
- $6,561
- IRR
- 77.7%
- Equity multiple
- 9.64×
- Total profit
- $106,408
- Equity at exit
- $3,804
Cash invested: $12,320 (down + closing). Projections, not guarantees.
Landlord ↔ Tenant lean methodology
- Overall (STATE)
- 87 Strongly Landlord-Friendly
- State Arizona
- 87 Strongly Landlord-Friendly · R+3
- County
- — inherits STATE
- City
- — inherits STATE
ZIP-level market 85122
- Home prices YoY
- -22.4%
- Rents YoY
- 4.6%
- Active inventory
- 628
- Price-to-rent
- 2.8×
Monthly cashflow live
- Estimated rent
- $1,319 high interval (Pro) →
- Mortgage (P&I)
- −$231
- Tax est. 1.5%
- −$55 /mo · $660/yr
- Insurance
- −$18
- HOA
- −$0
- Vacancy / Maint / Mgmt
- −$277
- Net cashflow
- $738
Break-even live
UW: 25.0% down · 7.5% · 30yr · 1.5% tax · 5.0% vac · 8.0% maint · 8.0% mgmt
Financing live
Cash to close
- Down payment
- $11,000
- Closing costs
- $1,320
- Reserves months
- —
- Total cash needed
- —
Loan-product check · same deal, 3 products live
Conventional
25% down · 7.5% · 30yr
- Down + closing
- —
- Monthly P&I
- —
- Monthly cashflow
- —
- DSCR
- —
- Eligible?
- —
Personal DTI + credit; lowest rate.
DSCR
20% down · 8.5% · 30yr
- Down + closing
- —
- Monthly P&I
- —
- Monthly cashflow
- —
- DSCR
- —
- Eligible?
- —
No personal income docs; deal must DSCR.
Hard money
10% down · 12.0% · 12mo
- Down + closing
- —
- Monthly P&I
- —
- Monthly cashflow
- —
- DSCR
- —
- Eligible?
- —
Short-term bridge; refi at stabilization.
Rent comps 22 comps
| Address | Beds | Baths | Sqft | Rent | $/sqft | DOM | Units | Dist |
|---|---|---|---|---|---|---|---|---|
| 290 W Viola St Unit 4 Casa Grande, AZ | 2.0 | 1.0 | 800 | $1,250 | $1.56 | 15d | 1 | 0.19mi |
| 1641 N Kadota Ave Casa Grande, AZ | 1.0–2.0 | 1.0–2.0 | 750 | $1,100 | $1.47 | 1d | 3 | 0.63mi |
| 1550 N Casa Grande Ave Casa Grande, AZ | 1.0–2.0 | 1.0–2.0 | 625 | $1,199 | $1.92 | 1d | 1 | 0.66mi |
| 541 W Melrose Dr Casa Grande, AZ | 3.0 | 2.0 | 1101 | $1,600 | $1.45 | 24d | 1 | 0.68mi |
| 1564 N Morrison Ave Casa Grande, AZ | 2.0–3.0 | 2.0 | 871 | $864 | $0.99 | 1d | 20 | 0.73mi |
| 1650 N Kadota Ave Casa Grande, AZ | 1.0–2.0 | 1.0–2.0 | 612 | $1,170 | $1.91 | 1d | 5 | 0.76mi |
| 420 E McMurray Blvd Casa Grande, AZ | 1.0 | 1.0 | 645 | $895 | $1.39 | 24d | 1 | 0.91mi |
| 1926 N Avenida de Palmas Casa Grande, AZ | 2.0 | 2.0 | 1106 | $1,199 | $1.08 | 22d | 3 | 0.94mi |
| 1620 N Trekell Rd Casa Grande, AZ | 1.0–3.0 | 1.0–2.5 | 1090 | $2,165 | $1.99 | 1d | 1 | 1.04mi |
| 1010 N Park Ave Casa Grande, AZ | 2.0 | 1.0 | 920 | $1,100 | $1.20 | 13d | 1 | 1.07mi |
| 1005 N Center Ave Unit A Casa Grande, AZ | 1.0 | 1.0 | 525 | $1,099 | $2.09 | 24d | 1 | 1.11mi |
| 1005 N Center Ave Unit A Casa Grande, AZ | 1.0 | 1.0 | 525 | $1,099 | $2.09 | 4d | 1 | 1.11mi |
| 701 W 12th St Unit F Casa Grande, AZ | 2.0 | 1.0 | 745 | $1,500 | $2.01 | 24d | 1 | 1.12mi |
| 1161 E O'Neil Dr Casa Grande, AZ | 2.0–4.0 | 2.0 | 1144 | $1,295 | $1.13 | 3d | 12 | 1.13mi |
| 1936 N Trekell Rd Casa Grande, AZ | 1.0–4.0 | 1.0–2.0 | 1033 | $1,492 | $1.44 | 2d | 29 | 1.15mi |
| 300 W 9th St Casa Grande, AZ | 2.0 | 1.0 | 775 | $999 | $1.29 | 22d | 1 | 1.18mi |
| 507 W 10th St Apt D Casa Grande, AZ | 1.0 | 1.0 | 600 | $1,050 | $1.75 | 20d | 1 | 1.18mi |
| 416 W 9th St Unit 1 Casa Grande, AZ | 2.0 | 1.0 | 725 | $1,200 | $1.66 | 13d | 1 | 1.20mi |
| 419 W 9th St Apt A Casa Grande, AZ | 2.0 | 1.0 | 750 | $1,199 | $1.60 | 24d | 1 | 1.24mi |
| 803 N Park Ave Casa Grande, AZ | 2.0 | 1.0 | 822 | $1,275 | $1.55 | 5d | 1 | 1.25mi |
| 2060 N Trekell Rd Casa Grande, AZ | 2.0 | 1.0–2.0 | 670 | $1,300 | $1.94 | 24d | 4 | 1.32mi |
| 1113 W Corinthian Cir Casa Grande, AZ | 3.0 | 2.0 | 981 | $1,395 | $1.42 | 15d | 1 | 1.39mi |
Listing history 16 events
-
2026-06-18days on market $44,000 Active 99 DOM
-
2026-06-17days on market $44,000 Active 98 DOM
-
2026-06-16days on market $44,000 Active 97 DOM
-
2026-06-15days on market $44,000 Active 96 DOM
-
2026-06-13days on market $44,000 Active 94 DOM
-
2026-06-13days on market $44,000 Active 93 DOM
-
2026-06-09days on market $44,000 Active 90 DOM
-
2026-06-08days on market $44,000 Active 89 DOM
-
2026-06-07days on market $44,000 Active 88 DOM
-
2026-06-04days on market $44,000 Active 85 DOM
-
2026-06-03days on market $44,000 Active 84 DOM
-
2026-06-02days on market $44,000 Active 83 DOM
-
2026-06-01days on market $44,000 Active 82 DOM
-
2026-05-31days on market $44,000 Active 81 DOM
-
2026-04-16price $44,000
-
2026-03-11$45,000 Active
ⓘ Source: listings_history table (triggers on properties + properties_extension) + one-shot
backfill from property_details.listing_events for pre-trigger history.
Climate risk First Street
- Flood 1/10 Low FEMA zone X (unshaded) · 0% chance over 30 yrs
- Wildfire 4/10 Moderate
- Heat 9/10 Extreme 7 d/yr ≥113°F today · 18 d/yr by 30 yrs out
- Wind 1/10 Low
- Air quality 2/10 Low 1 unhealthy d/yr today · 1 by 30 yrs out
Nearby sold comps map
Loading sold comps map…
Walkable amenities ~0.75 mi
Loading nearby amenities…
Taxation est. · year 1
- Rental income
- $15,833
- − Mortgage interest
- −$2,465
- − Property taxes
- −$660
- − Insurance
- −$220
- − Repairs & maintenance
- −$1,267
- − Management
- −$1,267
- − Depreciation
- −$1,280
- Taxable income
- $8,675
- Est. tax owed @ 24.0%
- −$2,082
- After-tax cash flow
- $6,777/yr
For passive investors: Depreciation is non-cash, so a rental often shows a tax loss while cash-flowing — sheltering income. Rental losses are passive: they offset passive income freely, and up to $25,000/yr can offset ordinary (W-2) income if you actively participate and your MAGI is under $100k (phasing out to $0 by $150k); unused losses carry forward. On sale, claimed depreciation is recaptured at up to 25%, and gains may owe capital-gains tax (a 1031 exchange can defer both). Figures are a year-1 estimate at your 24.0% rate — not tax advice; consult a CPA.
Condition & rehab AI · 13 photos
This manufactured home requires significant repairs and updates to improve its condition and value. The exterior and interior need painting, new flooring, and exterior siding replacement. The kitchen and bathroom also need updates to modernize and improve functionality.
Repairs flagged
- Major exterior siding — Significant wear and tear
- Major roof — Aged appearance
- Major flooring — Worn linoleum
- Major interior walls/paint — Worn wallpaper, peeling paint
- Major bathroom fixtures — Worn and dated
- Major kitchen countertops — Worn and dated
- Major landscaping — Overgrown and unkempt
Value-add opportunities
- Both exterior painting — Enhances curb appeal and value
- Both new flooring — Improves living space and value
- Both exterior siding replacement — Enhances curb appeal and value
- Both new bathroom fixtures — Modernizes and improves functionality
- Both new kitchen countertops — Modernizes and improves functionality
Renovation cost estimate screening
| Repair item | Severity | Est. cost |
|---|---|---|
| exterior siding · Significant wear and tear | Major | $15,000–50,000 |
| roof · Aged appearance | Major | $15,000–50,000 |
| flooring · Worn linoleum | Major | $15,000–50,000 |
| interior walls/paint · Worn wallpaper, peeling paint | Major | $15,000–50,000 |
| bathroom fixtures · Worn and dated | Major | $15,000–50,000 |
| kitchen countertops · Worn and dated | Major | $15,000–50,000 |
| landscaping · Overgrown and unkempt | Major | $15,000–50,000 |
| Total estimated repair cost · 7 items | $105,000–350,000 |
Value-add ROI direction
- Both exterior painting — Enhances curb appeal and value ↑
- Both new flooring — Improves living space and value ↑
- Both exterior siding replacement — Enhances curb appeal and value ↑
- Both new bathroom fixtures — Modernizes and improves functionality ↑
- Both new kitchen countertops — Modernizes and improves functionality ↑
ⓘ Cost ranges are severity-bucket heuristics (US national rule-of-thumb). Get contractor quotes + a written scope before underwriting a rehab budget.
Schools (NCES district)
- District
- Casa Grande Union High School District (4453)
- NCES district ID
- 0401740
- Math proficiency
- 14% ▼ -15.00%
- Reading proficiency
- 21% ▼ -10.00%
- Median HH income
- $45,373
- Composite
- 15.38/100
- National rank
- #9319
- State rank
- #193 of 249 in AZ
Livability — Casa Grande
- Score
- 58/100
- State rank
- #220
- US rank
- #21534
Category grades
Schools grade is shown separately in the Schools card above.
Census & demographics
- Census place
- Casa Grande, AZ
- County
- Pinal County · 399,947 people
- City population
- 69,701
- Metro
- Phoenix-Mesa-Chandler, AZ
- Population (ZIP)
- 61,624
- Household income
- $68,443
- Rent vs Own
- Severe rent burden
- 1250.0
Population outlook (Pinal County) Hauer SSP2
- Today (2025)
- 437,574 people
- By 2030
- 446,903 · +2.1%
- By 2040
- 452,589 · +3.4%
- By 2050
- 444,126 · +1.5%
- By 2075
- 430,300 · -1.7%
- By 2100
- 393,536 · -10.1%
Race, ethnicity, and origin ACS 2023
- Neighborhood character
- Diverse neighborhood (Simpson 0.63)
- Race & ethnicity
- Hispanic / Latino 44% White 42% Two or more races 21% Black 4% Native American 4% Asian 1%
- Hispanic origin (detail)
- Mexican 40%
- Common ancestry
- Lithuanian 1% Slovak 1% Portuguese 1%
- Foreign-born
- 12% · Canada
- Languages at home
- 75% English-only · Spanish 23% Tagalog/Filipino 1% Other Indo-European 1%
Political lean MEDSL · Pinal
- 2024 margin
- Strong R (+22.1) · D 38.5% · R 60.6%
- 2008→2024 swing
- -7.6pp toward R · 2008: -14.5pp · 2024: -22.1pp
- All cycles
- 2024: R+22.1 2020: R+17.3 2016: R+19.3 2012: R+17.1 2008: R+14.5
Not yet ingested
- Civics
- —
Market trends
- HPI YoY
- ▼ -67.32%
- Current HPI
- 233.148
- Rent YoY
- ▲ 4.60%
- Metro
- Phoenix-Mesa-Chandler, AZ
- State GDP YoY
- ▲ 4.54%
- F500 in state
- 20
Industry mix (Fortune 500 HQ in AZ)
| Industry | F500 HQs | Revenue |
|---|---|---|
| Technology | 2 | $13B |
|
||
| Mining / Metals | 1 | $23B |
|
||
| Environmental Services | 1 | $16B |
|
||
| Metals / Steel | 1 | $14B |
|
||
| Technology Distribution | 1 | $9B |
|
||
| Homebuilding | 1 | $8B |
|
||
Price history
-2.2% since first listed2 events — show timeline
- 2026-04-16 Price Changed $44,000 ARMLS
- 2026-03-11 Listed $45,000 ARMLS
Cash-flow waterfall
monthlySold comps — $/sqft
last 12 mo · ≤1 miLoading sold comps…