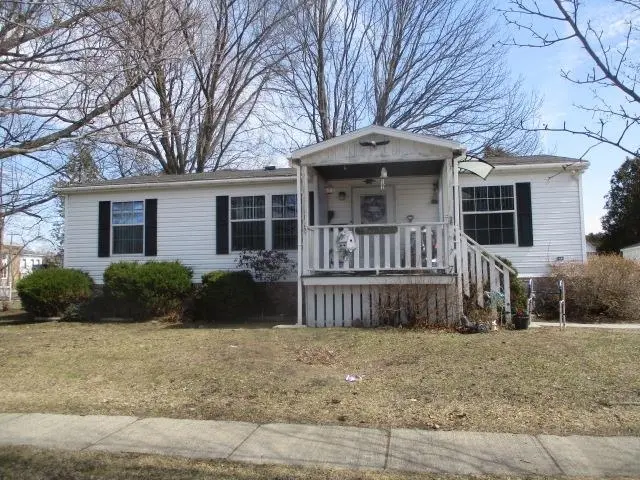
7 Lagrasse St · Waddington, NY
Flood risk 1/10 · Minimal
- FEMA flood zone
- X
- Chance of flooding over 30 yrs
- 0.0%
- Est. flood insurance / yr
- $507 – $1,088
Fire risk 1/10 · Minimal
- Est. fire insurance / yr
- $691 – $1,283
Heat risk 2/10 · Minimal
- Hot days now (above 93°F)
- 7 days/yr
- Hot days in 30 yrs
- 15 days/yr
Wind risk 1/10 · Minimal
- Chance of severe wind over 30 yrs
- —
Air-quality risk 2/10 · Minimal
- Unhealthy air days now
- 1 days/yr
- Unhealthy air days in 30 yrs
- 1 days/yr
Risk factors via First Street. Map © Google.
Why this score? — see what drove the C grade
The composite is a weighted blend of 9 inputs, each scored 0–100. Each bar is that input's sub-score; the figure is the points it added to the 100-point composite (weight × sub-score).
- Cash flow +18.8/30.0
- ARV discount +9.4/15.0
- DSCR +5.9/10.0
- 1% rule +5.5/10.0
- Appreciation +5.0/10.0
- Schools +4.5/10.0
- Livability +3.0/5.0
- Rent growth +2.5/5.0
- Condition / age +2.5/5.0
$119,500
🖨 Deal sheet 📄 Offer letter ✓ Due diligence
Listing remarks
Welcome to this well maintained double-wide home nestled in the peaceful community of Waddington. Built in 2005, this inviting property has 3 bedrooms and 2 full bathrooms, perfect for comfortable living. The home is heated with a 1 year old natural gas furnace. Situated on an 88' x 99' lot, the property offers just the right amount of outdoor space for gardening, recreation, or simply enjoying the outdoors on your 12' x 16' back deck. The one car detached garage and storage shed adds extra convenience and storage.
Key facts
- Storage shed
- Back deck
- Outdoor space
Tags
Neighborhood map
What this means for you Summary
Snapshot
- This is a 3-bed/2.0-bath single-family listed at $120k.
Deal economics
- At list price, monthly cash flow is $120 ($1k/yr) — positive.
- The deal already cash-flows at list — no discount required.
- Meets the 1% rule at list price ($1k rent vs $120k).
Location & tenants
- Location reads 59/100 on livability (#1,011 in NY) — a working-class tenant base; expect higher turnover. Strengths: housing A+, cost of living A-; Watch: employment C-, health & safety C-, schools F.
- Madrid-Waddington Central School District (rural): math 50% / reading 56% proficiency, ranked #332 of 590 in NY (top 56%) — acceptable for families but not a draw, mixed tenant base, ~2y average lease.
- Market conditions: 20 active listings in the ZIP; 215 units permitted in St. Lawrence County in 2024 (0 in 5+ unit buildings).
Forward outlook
- In year one you build about $911 of equity ($826 loan paydown + $85 appreciation (0.1% local appreciation)).
- St. Lawrence County population projected at -14% by 2050 — secular population decline; favor cash flow + early exit over multi-decade hold.
- At projected returns (0.1% appreciation + 3.0% rent growth), your $33k cash investment doubles in ~9 years — after that, you're playing with house money.
Negotiation context
- Only 3 days on market — expect competitive offers; lowballing is unlikely to land.
- Current owner paid $9k; list at $120k implies a 1228% gain — meaningful room to come down on a strong offer.
Questions for the listing agent
- Is there a deadline driving the sale (1031 exchange, divorce, estate, relocation)? That informs how much negotiation room exists.
- Schools are F-rated, which usually means shorter tenancies and higher turnover. Who's the typical renter profile here, and what's been the actual vacancy rate?
- Crime grade is F in this area — have there been break-ins, vandalism, or insurance claims at this property in the last 3 years? What carrier currently insures it and at what premium?
- What's the average days-on-market for RENTAL listings here right now (not sales)? A rising rental-DOM trend means longer vacancies and softer asking-rent achievability than the comps imply.
- What's the recent tenant-quality profile in this submarket — average credit score on applications, eviction rate, late-payment / NSF rate, and stable-employment percentage? A property-management company in the area should have these aggregated.
- How much new for-sale + rental construction is in the pipeline within 1–3 miles? Heavy new supply typically softens prices + rents 12–24 months out; constrained supply supports both.
Investment metrics
- 1% rule
- 1.05% ✓
- Cap rate
- 7.49%
- Cash-on-cash
- 4.29%
- DSCR
- 1.19
- GRM
- 7.9
CMA / ARV
- ARV (on-the-fly)
- $124,656
- Comps found
- 3
Show comp detail 3 sales within ~0.75 mi
| Address | Dist | Beds/Ba | Sqft | Sold | Price | $/sf | Match |
|---|---|---|---|---|---|---|---|
| 56 Fenton St | 0.15mi | 3/1.0 | 1,176 (0%) | 8mo | $125,000 | $106 | 82 |
| 170 Lincoln Ave | 0.31mi | 3/1.5 | 1,188 (+1%) | 2mo | $200,000 | $168 | 80 |
| 132 Lincoln Ave | 0.09mi | 2/1.0 (-1) | 1,200 (+2%) | 10mo | $65,000 | $54 | 75 |
Match score weights: distance 35% · size 25% · config 20% · recency 20%. Top-matched comps best support the ARV.
Projected returns pro-forma
0.07% appreciation · 3.0% rent growth · sell at horizon
- IRR
- 2.9%
- Equity multiple
- 1.14×
- Total profit
- $4,573
- Equity at exit
- $35,123
- IRR
- 8.2%
- Equity multiple
- 1.90×
- Total profit
- $30,120
- Equity at exit
- $42,560
Cash invested: $33,460 (down + closing). Projections, not guarantees.
Landlord ↔ Tenant lean methodology
- Overall (STATE)
- 15 Strongly Tenant-Friendly
- State New York
- 15 Strongly Tenant-Friendly · D+10
- County
- — inherits STATE
- City
- — inherits STATE
ZIP-level market 13694
- Home prices YoY
- 0.0%
- Active inventory
- 20
- Price-to-rent
- 7.9×
Monthly cashflow live
- Estimated rent
- $1,256 medium interval (Pro) →
- Mortgage (P&I)
- −$627
- Tax from tax record
- −$196 /mo · $2,353/yr
- Insurance
- −$50
- HOA
- −$0
- Vacancy / Maint / Mgmt
- −$264
- Net cashflow
- $120
Break-even live
UW: 25.0% down · 7.5% · 30yr · 1.5% tax · 5.0% vac · 8.0% maint · 8.0% mgmt
Financing live
Cash to close
- Down payment
- $29,875
- Closing costs
- $3,585
- Reserves months
- —
- Total cash needed
- —
Loan-product check · same deal, 3 products live
Conventional
25% down · 7.5% · 30yr
- Down + closing
- —
- Monthly P&I
- —
- Monthly cashflow
- —
- DSCR
- —
- Eligible?
- —
Personal DTI + credit; lowest rate.
DSCR
20% down · 8.5% · 30yr
- Down + closing
- —
- Monthly P&I
- —
- Monthly cashflow
- —
- DSCR
- —
- Eligible?
- —
No personal income docs; deal must DSCR.
Hard money
10% down · 12.0% · 12mo
- Down + closing
- —
- Monthly P&I
- —
- Monthly cashflow
- —
- DSCR
- —
- Eligible?
- —
Short-term bridge; refi at stabilization.
Listing history 3 events
-
2026-04-13status Pending
-
2026-04-10$119,500 Active
-
2004-11-01soldstatus $9,000
ⓘ Source: listings_history table (triggers on properties + properties_extension) + one-shot
backfill from property_details.listing_events for pre-trigger history.
Tax reassessment forecast NY · Partial reset (capped growth)
- Current annual tax
- $2,353 · $196/mo
- Projected year-2 tax
- $2,353 · $196/mo
- Expected delta
- $0/yr ($0/mo · 0.0%)
ⓘ Screening estimate from a state-policy table — verify with the county assessor before closing.
Climate risk First Street
- Flood 1/10 Low FEMA zone X · 0% chance over 30 yrs
- Wildfire 1/10 Low
- Heat 2/10 Low 7 d/yr ≥93°F today · 15 d/yr by 30 yrs out
- Wind 1/10 Low
- Air quality 2/10 Low 1 unhealthy d/yr today · 1 by 30 yrs out
Nearby sold comps map
Loading sold comps map…
Walkable amenities ~0.75 mi
Loading nearby amenities…
Taxation est. · year 1
- Rental income
- $15,072
- − Mortgage interest
- −$6,694
- − Property taxes
- −$2,353
- − Insurance
- −$598
- − Repairs & maintenance
- −$1,206
- − Management
- −$1,206
- − Depreciation
- −$3,476
- Taxable loss
- −$460
- Est. tax savings @ 24.0%
- +$110
- After-tax cash flow
- $1,547/yr
For passive investors: Depreciation is non-cash, so a rental often shows a tax loss while cash-flowing — sheltering income. Rental losses are passive: they offset passive income freely, and up to $25,000/yr can offset ordinary (W-2) income if you actively participate and your MAGI is under $100k (phasing out to $0 by $150k); unused losses carry forward. On sale, claimed depreciation is recaptured at up to 25%, and gains may owe capital-gains tax (a 1031 exchange can defer both). Figures are a year-1 estimate at your 24.0% rate — not tax advice; consult a CPA.
Schools (NCES district)
- District
- Madrid-Waddington Central School District
- NCES district ID
- 3618090
- Math proficiency
- 50% ▲ 6.00%
- Reading proficiency
- 56% ▲ 10.00%
- Median HH income
- $51,008
- Composite
- 45.35/100
- National rank
- #2635
- State rank
- #332 of 590 in NY
Livability — Waddington
- Score
- 59/100
- State rank
- #1011
- US rank
- #19695
Category grades
Schools grade is shown separately in the Schools card above.
Census & demographics
- Census place
- Waddington, NY
- Population (ZIP)
- 1,232
Population outlook (St. Lawrence County) Hauer SSP2
- Today (2025)
- 110,027 people
- By 2030
- 107,455 · -2.3%
- By 2040
- 100,492 · -8.7%
- By 2050
- 94,254 · -14.3%
- By 2075
- 80,175 · -27.1%
- By 2100
- 63,140 · -42.6%
Race, ethnicity, and origin ACS 2023
- Neighborhood character
- Predominantly White (90%)
- Race & ethnicity
- White 90% Hispanic / Latino 7% Two or more races 6%
- Hispanic origin (detail)
- Mexican 6%
- Common ancestry
- Lithuanian 6% Slovak 4% German 4%
- Foreign-born
- 7% · Canada
- Languages at home
- 99% English-only · German/W. Germanic 1%
Political lean MEDSL · St. Lawrence
- 2024 margin
- R (+18.0) · D 41.0% · R 59.0%
- 2008→2024 swing
- -34.3pp toward R · 2008: 16.3pp · 2024: -18.0pp
- All cycles
- 2024: R+18.0 2020: R+11.7 2016: R+10.8 2012: D+16.6 2008: D+16.3
Not yet ingested
- Civics
- —
Market trends
- HPI YoY
- ▲ 0.07%
- Current HPI
- 258.2443
- Rent YoY
- —
- Metro
- —
- State GDP YoY
- ▲ 2.60%
- F500 in state
- 92
Industry mix (Fortune 500 HQ in NY)
| Industry | F500 HQs | Revenue |
|---|---|---|
| Financial Services | 10 | $950B |
|
||
| Consumer Goods | 9 | $162B |
|
||
| Insurance | 4 | $225B |
|
||
| Telecommunications | 2 | $144B |
|
||
| Pharmaceuticals | 2 | $112B |
|
||
| Media / Entertainment | 2 | $69B |
|
||
Price history
+1227.8% since first listed3 events — show timeline
- 2026-04-13 Pending — SLCMLS
- 2026-04-10 Listed $119,500 SLCMLS
- 2004-11-01 Sold (Public Records) $9,000 Public Records
Property tax history
+10.4%/yrLatest (2025): $2,353 · -0.4% YoY. Source: county tax records.
Cash-flow waterfall
monthlySold comps — $/sqft
last 12 mo · ≤1 miLoading sold comps…