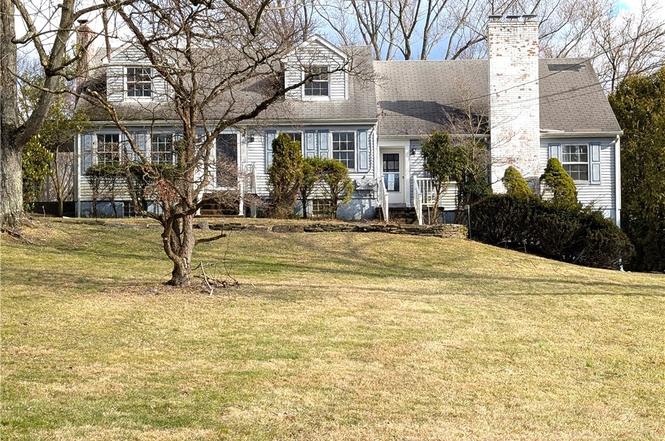
2139 Northwest Dr · White Oak, PA
Flood risk 1/10 · Minimal
- FEMA flood zone
- X (unshaded)
- Chance of flooding over 30 yrs
- 0.0%
- Est. flood insurance / yr
- $507 – $1,088
Fire risk 1/10 · Minimal
- Est. fire insurance / yr
- $511 – $949
Heat risk 3/10 · Minor
- Hot days now (above 97°F)
- 7 days/yr
- Hot days in 30 yrs
- 18 days/yr
Wind risk 2/10 · Minimal
- Chance of severe wind over 30 yrs
- —
Air-quality risk 5/10 · Moderate
- Unhealthy air days now
- 9 days/yr
- Unhealthy air days in 30 yrs
- 11 days/yr
Risk factors via First Street. Map © Google.
Why this score? — see what drove the B grade
The composite is a weighted blend of 9 inputs, each scored 0–100. Each bar is that input's sub-score; the figure is the points it added to the 100-point composite (weight × sub-score).
- Cash flow +29.0/30.0
- DSCR +10.0/10.0
- 1% rule +9.8/10.0
- ARV discount +7.5/15.0
- Schools +5.9/10.0
- Rent growth +4.3/5.0
- Livability +3.9/5.0
- Condition / age +2.5/5.0
- Appreciation +0.0/10.0
$126,000
🖨 Deal sheet (PDF) 📄 Offer letter ✓ Due diligence
Listing remarks
This Cape Cod style home features three bedrooms and two and a half bathrooms situated on an expansive lot with a generous rear yard. The interior layout includes a kitchen, a kitchenette, and a sunporch. The residence also provides a full basement and a two-car integral garage. This property offers classic architectural elements and a practical floor plan within an established residential setting. Schedule a showing today to view the layout and explore the features of this Cape Cod home
Key facts
- 0.68 acre lot
- Garage
- Built 1954
Neighborhood map
What this means for you Summary
Snapshot
- This is a 3-bed/2.5-bath other listed at $126k.
Deal economics
- At list price, monthly cash flow is $432 ($5k/yr) — positive.
- The deal already cash-flows at list — no discount required.
- Meets the 1% rule at list price ($2k rent vs $126k).
- Recommended offer: $124k (1.5% below list) — sets the bar for market timing.
- Cap rate 10.4% vs local median 4.1% in White Oak — top-decile yield for the area; either an underpriced asset or a hidden risk that comps aren't pricing in. Stress-test before assuming the spread holds.
Location & tenants
- Location reads 77/100 on livability (#339 in PA, #2,982 nationally) — a middle-class / working-renter tenant base. Strengths: cost of living A+, housing A+, crime B+; Watch: amenities D-, commute F.
- Norwin SD (suburban): math 60% / reading 76% proficiency, ranked #32 of 539 in PA (top 6%) — acceptable for families but not a draw, mixed tenant base, ~2y average lease; only 18% free/reduced lunch — higher-income household profile.
- Zoned schools: Stewartsville El Sch (math 62% / reading 77%, grade A-, #151 of 1,518 statewide, top 12%, 428 students, 27% FRL); Norwin Ms (math 48% / reading 72%, grade B, #43 of 512 statewide, top 9%, 820 students, 30% FRL); Norwin Shs (math 78% / reading 24%, grade D+, #121 of 437 statewide, top 28%, 1,636 students, 25% FRL).
- Market conditions: Rents rising fast (+7.2%/yr); 137 active listings in the ZIP; 3 comparable units currently listed for rent nearby; rentals leasing fast (median 0d on market — plan ~1-2 weeks tenant-placement turnaround); solid renter incomes; 415 units permitted in Westmoreland County in 2024 (10 in 5+ unit buildings).
Forward outlook
- Local home prices are declining (-3.0%/yr); year-one equity from $871 of loan paydown is wiped out by about $4k of value loss. Plan a longer hold.
- Westmoreland County population projected at -19% by 2050 — secular population decline; favor cash flow + early exit over multi-decade hold.
- At projected returns (-3.0% appreciation + 7.2% rent growth), your $35k cash investment doubles in ~6 years — after that, you're playing with house money.
Negotiation context
- It's been on market 16 days — a 2% lower offer ($124k) is reasonable based on typical stale-listing flexibility.
Risks & watch-outs
- Watch-outs: property tax is 3.2% of price; built in 1954 — expect roof / HVAC / electrical / plumbing capex.
Questions for the listing agent
- Built in 1954 — when were the roof, HVAC, electrical panel, plumbing, and water heater last replaced?
- Property tax is high relative to price — has the assessment been appealed recently, and will the sale trigger a re-assessment?
- Is there a deadline driving the sale (1031 exchange, divorce, estate, relocation)? That informs how much negotiation room exists.
- Schools are D-rated, which usually means shorter tenancies and higher turnover. Who's the typical renter profile here, and what's been the actual vacancy rate?
- What's the average days-on-market for RENTAL listings here right now (not sales)? A rising rental-DOM trend means longer vacancies and softer asking-rent achievability than the comps imply.
- What's the recent tenant-quality profile in this submarket — average credit score on applications, eviction rate, late-payment / NSF rate, and stable-employment percentage? A property-management company in the area should have these aggregated.
- How much new for-sale + rental construction is in the pipeline within 1–3 miles? Heavy new supply typically softens prices + rents 12–24 months out; constrained supply supports both.
Investment metrics
- 1% rule
- 1.48% ✓
- Cap rate
- 10.41%
- Cash-on-cash
- 14.69%
- DSCR
- 1.65
- GRM
- 5.6
CMA / ARV
No comps found within radius.
Projected returns pro-forma
-3.0% appreciation · 7.15% rent growth · sell at horizon
- IRR
- 10.4%
- Equity multiple
- 1.44×
- Total profit
- $15,358
- Equity at exit
- $18,787
- IRR
- 23.1%
- Equity multiple
- 3.43×
- Total profit
- $85,719
- Equity at exit
- $10,894
Cash invested: $35,280 (down + closing). Projections, not guarantees.
Landlord ↔ Tenant lean methodology
- Overall (STATE)
- 62 Landlord-Friendly
- State Pennsylvania
- 62 Landlord-Friendly · EVEN
- County
- — inherits STATE
- City
- — inherits STATE
ZIP-level market 15642
- Rents YoY
- 7.2%
- Active inventory
- 137
- Price-to-rent
- 5.6×
Monthly cashflow live
- Estimated rent
- $1,871 medium interval (Pro) →
- Mortgage (P&I)
- −$661
- Tax from tax record
- −$333 /mo · $3,994/yr
- Insurance
- −$52
- HOA
- −$0
- Vacancy / Maint / Mgmt
- −$393
- Net cashflow
- $432
Break-even live
Sensitivity live
| Price | -10% $503 | -5% $467 | +0% $432 | +5% $396 | +10% $360 |
|---|---|---|---|---|---|
| Rent | -10% $284 | -5% $358 | +0% $432 | +5% $506 | +10% $580 |
| Rate | -1.0pp $495 | -0.5pp $464 | base $432 | +0.5pp $399 | +1.0pp $366 |
UW: 25.0% down · 7.5% · 30yr · 1.5% tax · 5.0% vac · 8.0% maint · 8.0% mgmt
Financing live
Cash to close
- Down payment
- $31,500
- Closing costs
- $3,780
- Reserves months
- —
- Total cash needed
- —
Loan-product check · same deal, 3 products live
Conventional
25% down · 7.5% · 30yr
- Down + closing
- —
- Monthly P&I
- —
- Monthly cashflow
- —
- DSCR
- —
- Eligible?
- —
Personal DTI + credit; lowest rate.
DSCR
20% down · 8.5% · 30yr
- Down + closing
- —
- Monthly P&I
- —
- Monthly cashflow
- —
- DSCR
- —
- Eligible?
- —
No personal income docs; deal must DSCR.
Hard money
10% down · 12.0% · 12mo
- Down + closing
- —
- Monthly P&I
- —
- Monthly cashflow
- —
- DSCR
- —
- Eligible?
- —
Short-term bridge; refi at stabilization.
Rent comps 3 comps
| Address | Beds | Baths | Sqft | Rent | $/sqft | DOM | Units | Dist |
|---|---|---|---|---|---|---|---|---|
| 12400 Adams Dr Irwin, PA | 4.0 | 2.0 | 1524 | $2,129 | $1.40 | 0d | 1 | 0.62mi |
| 13439 Dean Dr Irwin, PA | 4.0 | 3.0 | 1400 | $2,150 | $1.54 | 0d | 1 | 0.86mi |
| 11556 McKee Rd North Huntingdon, PA | 3.0 | 2.0 | 1787 | $1,825 | $1.02 | 0d | 1 | 0.99mi |
Listing history 2 events
-
2026-03-27status Pending
-
2026-03-10$126,000 Active
ⓘ Source: listings_history table (triggers on properties + properties_extension) + one-shot
backfill from property_details.listing_events for pre-trigger history.
Tax reassessment forecast PA · Partial reset (capped growth)
- Current annual tax
- $3,994 · $333/mo
- Projected year-2 tax
- $3,994 · $333/mo
- Expected delta
- $0/yr ($0/mo · 0.0%)
ⓘ Screening estimate from a state-policy table — verify with the county assessor before closing.
Climate risk First Street
- Flood 1/10 Low FEMA zone X (unshaded) · 0% chance over 30 yrs
- Wildfire 1/10 Low
- Heat 3/10 Moderate 7 d/yr ≥97°F today · 18 d/yr by 30 yrs out
- Wind 2/10 Low
- Air quality 5/10 Major 9 unhealthy d/yr today · 11 by 30 yrs out
Nearby sold comps map
Loading sold comps map…
Walkable amenities ~0.75 mi
Loading nearby amenities…
Taxation est. · year 1
- Rental income
- $22,449
- − Mortgage interest
- −$7,058
- − Property taxes
- −$3,994
- − Insurance
- −$630
- − Repairs & maintenance
- −$1,796
- − Management
- −$1,796
- − Depreciation
- −$3,665
- Taxable income
- $3,510
- Est. tax owed @ 24.0%
- −$842
- After-tax cash flow
- $4,339/yr
For passive investors: Depreciation is non-cash, so a rental often shows a tax loss while cash-flowing — sheltering income. Rental losses are passive: they offset passive income freely, and up to $25,000/yr can offset ordinary (W-2) income if you actively participate and your MAGI is under $100k (phasing out to $0 by $150k); unused losses carry forward. On sale, claimed depreciation is recaptured at up to 25%, and gains may owe capital-gains tax (a 1031 exchange can defer both). Figures are a year-1 estimate at your 24.0% rate — not tax advice; consult a CPA.
Schools (NCES district)
- District
- Norwin SD
- NCES district ID
- 4217940
- Math proficiency
- 60% ▼ -11.00%
- Reading proficiency
- 76% ▼ -6.00%
- Median HH income
- $62,686
- Composite
- 58.86/100
- National rank
- #973
- State rank
- #32 of 539 in PA
Livability — White Oak
- Score
- 77/100
- State rank
- #339
- US rank
- #2982
Category grades
Schools grade is shown separately in the Schools card above.
Census & demographics
- County
- Westmoreland County · 183,777 people
- City population
- 8,451
- Metro
- Pittsburgh, PA
- Population (ZIP)
- 46,325
- Household income
- $97,706
- Rent vs Own
- Severe rent burden
- 349.0
Population outlook (Westmoreland County) Hauer SSP2
- Today (2025)
- 342,555 people
- By 2030
- 331,717 · -3.2%
- By 2040
- 304,976 · -11.0%
- By 2050
- 277,444 · -19.0%
- By 2075
- 224,607 · -34.4%
- By 2100
- 171,084 · -50.1%
Race, ethnicity, and origin ACS 2023
- Neighborhood character
- Predominantly White (94%)
- Race & ethnicity
- White 94% Two or more races 3% Hispanic / Latino 2%
- Common ancestry
- Romanian 9% Slovak 2% Italian 2%
- Foreign-born
- 2% · Canada
- Languages at home
- 98% English-only · Spanish 1%
Political lean MEDSL · Westmoreland
- 2024 margin
- Strong R (+28.4) · D 35.4% · R 63.9%
- 2008→2024 swing
- -11.7pp toward R · 2008: -16.7pp · 2024: -28.4pp
- All cycles
- 2024: R+28.4 2020: R+28.3 2016: R+31.3 2012: R+23.7 2008: R+16.7
Not yet ingested
- Civics
- —
Market trends
- HPI YoY
- ▼ -129.70%
- Current HPI
- 180.8812
- Rent YoY
- ▲ 7.15%
- Metro
- Pittsburgh, PA
- State GDP YoY
- ▲ 1.68%
- F500 in state
- 34
Industry mix (Fortune 500 HQ in PA)
| Industry | F500 HQs | Revenue |
|---|---|---|
| Healthcare | 2 | $309B |
|
||
| Insurance | 2 | $27B |
|
||
| Telecommunications / Media | 1 | $124B |
|
||
| Industrial Distribution | 1 | $22B |
|
||
| Financial Services | 1 | $20B |
|
||
| Chemicals / Materials | 1 | $18B |
|
||
Price history
2 events — show timeline
- 2026-03-27 Pending — West Penn MLS
- 2026-03-10 Listed $126,000 West Penn MLS
Property tax history
+2.8%/yrLatest (2026): $3,994 · +2.6% YoY. Source: county tax records.
Cash-flow waterfall
monthlySold comps — $/sqft
last 12 mo · ≤1 miLoading sold comps…