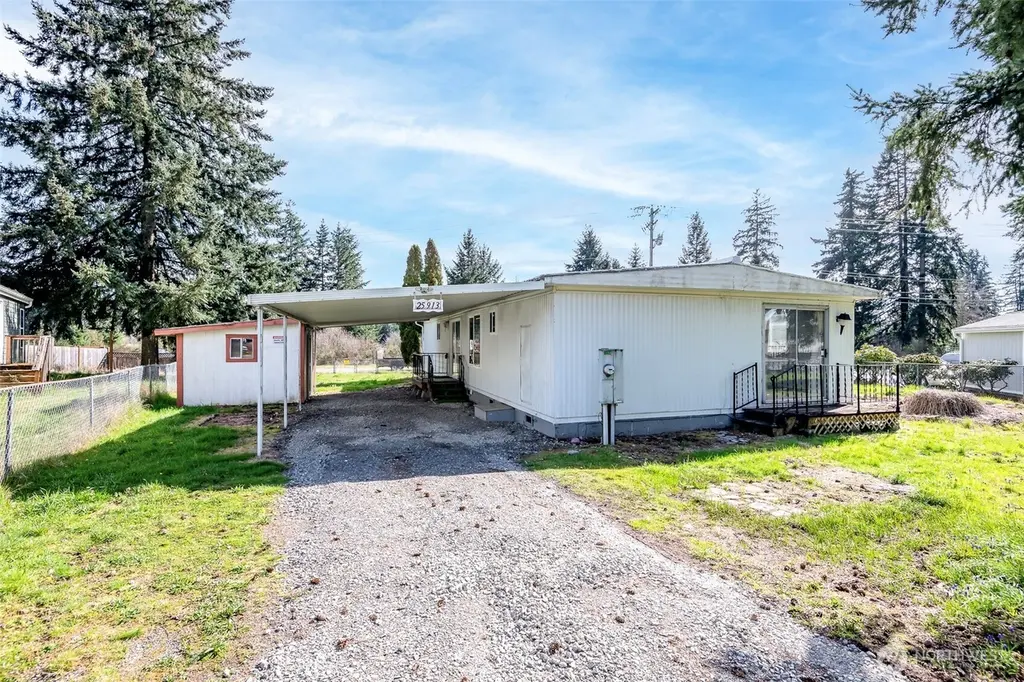
25913 54th Avenue Ct E · Elk Plain, WA
Flood risk 1/10 · Minimal
- FEMA flood zone
- X (unshaded)
- Chance of flooding over 30 yrs
- 0.0%
- Est. flood insurance / yr
- $507 – $1,088
Fire risk 3/10 · Minor
- Est. fire insurance / yr
- $604 – $1,122
Heat risk 3/10 · Minor
- Hot days now (above 87°F)
- 7 days/yr
- Hot days in 30 yrs
- 15 days/yr
Wind risk 1/10 · Minimal
- Chance of severe wind over 30 yrs
- —
Air-quality risk 6/10 · Moderate
- Unhealthy air days now
- 7 days/yr
- Unhealthy air days in 30 yrs
- 9 days/yr
Risk factors via First Street. Map © Google.
Why this score? — see what drove the B- grade
The composite is a weighted blend of 9 inputs, each scored 0–100. Each bar is that input's sub-score; the figure is the points it added to the 100-point composite (weight × sub-score).
- Cash flow +23.3/30.0
- ARV discount +15.0/15.0
- DSCR +7.5/10.0
- 1% rule +5.5/10.0
- Schools +4.9/10.0
- Rent growth +3.3/5.0
- Livability +3.2/5.0
- Condition / age +2.5/5.0
- Appreciation +0.0/10.0
$259,950
🖨 Deal sheet (PDF) 📄 Offer letter ✓ Due diligence
Listing remarks
Come see this manufactured home on a huge lot! The cul-de-sac and neighborhood have a park-like setting. The living room offers freshly cleaned carpets and large windows for lots of natural lighting. The living room flows into the dining area with custom built-in shelving and cabinetry for extra storage space. The kitchen features white cabinetry, a peninsula with additional eating space and a slider to the back deck. Conveniently located washer and dryer just off the kitchen. The primary suite has its own private access to the deck and a 3/4 en suite with walk-in shower. Two additional bedrooms plus a full bath with large soaker tub. Attached carport has a shed for extra storage. Front and
Key facts
- Park-like setting
- Huge lot
- White cabinetry
Tags
Property features AI
Finance
- Financial info: Listing terms: Cash, Conventional, See Remarks
Exterior
- Parking: Attached carport (covered, 1 space)
- Security: Fully fenced
- Utilities: Public water; Septic sewer (septic tank); Electric service; Water provided by Rainier View Water; Power provided by City of Tacoma
- Home design: Manufactured home (double wide) on land; One story; Main level entry; Facing direction not specified
- Construction: Metal/vinyl construction materials; Torch down roof; Block foundation; Manufactured house / double wide; Built as Parklane structure
- Exterior features: Deck; Fully fenced yard; Outbuildings; Metal/vinyl exterior; Level topography; Located on a cul-de-sac; Paved access
Interior
- Kitchen: Kitchen with eating space; Dishwasher; Double oven; Refrigerator; Stove/Range
- Bedrooms: Three bedrooms on the main level
- Flooring: Vinyl; Carpet
- Bathrooms: One full bathroom; One three-quarter bathroom; One bathtub; Two showers
- Heating & cooling: Forced air heating; Has cooling
- Interior features: Water heater (electric, located in closet); Entry hall; Living room; Utility room
- Laundry & utility: Washer; Dryer; Utility room
Neighborhood map
What this means for you Summary
Snapshot
- This is a 3-bed/2.0-bath manufactured listed at $260k.
Deal economics
- At list price, monthly cash flow is $477 ($6k/yr) — positive.
- The deal already cash-flows at list — no discount required.
- Meets the 1% rule at list price ($3k rent vs $260k).
- Recommended offer: $244k (6.0% below list) — sets the bar for market timing.
- Cap rate 8.5% vs local median 4.0% in Elk Plain — top-decile yield for the area; either an underpriced asset or a hidden risk that comps aren't pricing in. Stress-test before assuming the spread holds.
Location & tenants
- Location reads 63/100 on livability (#379 in WA) — a middle-class / working-renter tenant base. Strengths: housing A+, employment A-; Watch: crime C-, health & safety C-, cost of living D+.
- Bethel School District (suburban): math 47% / reading 59% proficiency, ranked #103 of 291 in WA (top 35%) — acceptable for families but not a draw, mixed tenant base, ~2y average lease.
- Market conditions: Rents rising (+3.3%/yr); 236 active listings in the ZIP; high-income renter base; 3,209 units permitted in Pierce County in 2024 (1,269 in 5+ unit buildings).
Forward outlook
- Local home prices are declining (-3.0%/yr); year-one equity from $2k of loan paydown is wiped out by about $8k of value loss. Plan a longer hold.
- Pierce County population projected at +26% by 2050 — long-run rental-demand tailwind backs the buy-and-hold thesis.
Negotiation context
- It's been on market 71 days — a 6% lower offer ($244k) is reasonable based on typical stale-listing flexibility.
- 2 sale attempts since 21y ago; this cycle's ask has dropped $30k (10%) from the opening price — seller is motivated, your offer sets the floor, not the list.
- Current owner paid $72k; list at $260k implies a 261% gain — meaningful room to come down on a strong offer.
Questions for the listing agent
- It's been on market 71 days. Have you received any prior offers? Is the seller open to a 6% concession, seller financing, or rate buy-down credit?
- Built in 1973 — when were the roof, HVAC, electrical panel, plumbing, and water heater last replaced?
- Why hasn't it sold? Are there any deal-killer items the seller is aware of (foundation, flood, title, zoning, code violations)?
- Is there a deadline driving the sale (1031 exchange, divorce, estate, relocation)? That informs how much negotiation room exists.
- Schools are F-rated, which usually means shorter tenancies and higher turnover. Who's the typical renter profile here, and what's been the actual vacancy rate?
- What's the average days-on-market for RENTAL listings here right now (not sales)? A rising rental-DOM trend means longer vacancies and softer asking-rent achievability than the comps imply.
- What's the recent tenant-quality profile in this submarket — average credit score on applications, eviction rate, late-payment / NSF rate, and stable-employment percentage? A property-management company in the area should have these aggregated.
- How much new for-sale + rental construction is in the pipeline within 1–3 miles? Heavy new supply typically softens prices + rents 12–24 months out; constrained supply supports both.
Investment metrics
- 1% rule
- 1.05% ✓
- Cap rate
- 8.49%
- Cash-on-cash
- 7.86%
- DSCR
- 1.35
- GRM
- 8.0
CMA / ARV
- ARV (on-the-fly)
- $383,160
- Comps found
- 12
Show comp detail 12 sales within ~0.75 mi
| Address | Dist | Beds/Ba | Sqft | Sold | Price | $/sf | Match |
|---|---|---|---|---|---|---|---|
| 25807 55th Avenue Ct E | 0.07mi | 3/2.0 | 1,296 (+4%) | 11mo | $430,600 | $332 | 80 |
| 25809 55th Avenue Ct E | 0.07mi | 3/2.0 | 1,318 (+6%) | 12mo | $443,500 | $336 | 76 |
| 5804 258th ST Ct E | 0.16mi | 3/2.0 | 1,344 (+8%) | 4mo | $415,000 | $309 | 75 |
| 25707 61st Ave Ct E | 0.38mi | 2/2.0 (-1) | 1,248 (+1%) | 4mo | $341,000 | $273 | 73 |
| 6102 257th St E | 0.38mi | 2/2.0 (-1) | 1,248 (+1%) | 9mo | $205,000 | $164 | 69 |
| 24909 51st Ave E | 0.67mi | 3/2.0 | 1,296 (+4%) | 8mo | $424,950 | $328 | 55 |
| 24903 51st Ave E | 0.69mi | 3/2.0 | 1,296 (+4%) | 8mo | $420,000 | $324 | 54 |
| 5325 254th St E | 0.39mi | 2/2.0 (-1) | 1,140 (-8%) | 15mo | $295,000 | $259 | 51 |
| 6116 253rd St E | 0.54mi | 3/2.0 | 1,404 (+13%) | 3mo | $385,000 | $274 | 50 |
| 24817 50th Ave E | 0.74mi | 3/2.0 | 1,296 (+4%) | 13mo | $425,000 | $328 | 47 |
| 24952 51st Ave E | 0.67mi | 2/2.0 (-1) | 1,152 (-7%) | 22mo | $130,000 | $113 | 34 |
| 24907 53rd Ave E | 0.65mi | 4/2.0 (+1) | 1,404 (+13%) | 22mo | $380,000 | $271 | 24 |
Match score weights: distance 35% · size 25% · config 20% · recency 20%. Top-matched comps best support the ARV.
Projected returns pro-forma
-3.0% appreciation · 3.32% rent growth · sell at horizon
- IRR
- -4.0%
- Equity multiple
- 0.85×
- Total profit
- $-10,904
- Equity at exit
- $38,759
- IRR
- 6.0%
- Equity multiple
- 1.45×
- Total profit
- $33,100
- Equity at exit
- $22,476
Cash invested: $72,786 (down + closing). Projections, not guarantees.
Landlord ↔ Tenant lean methodology
- Overall (STATE)
- 28 Tenant-Leaning
- State Washington
- 28 Tenant-Leaning · D+8
- County
- — inherits STATE
- City
- — inherits STATE
ZIP-level market 98338
- Rents YoY
- 3.3%
- Active inventory
- 236
- Price-to-rent
- 8.0×
Monthly cashflow live
- Estimated rent
- $2,718 medium interval (Pro) →
- Mortgage (P&I)
- −$1,363
- Tax from tax record
- −$199 /mo · $2,389/yr
- Insurance
- −$108
- HOA
- −$0
- Vacancy / Maint / Mgmt
- −$571
- Net cashflow
- $477
Break-even live
Sensitivity live
| Price | -10% $624 | -5% $551 | +0% $477 | +5% $403 | +10% $330 |
|---|---|---|---|---|---|
| Rent | -10% $262 | -5% $370 | +0% $477 | +5% $584 | +10% $692 |
| Rate | -1.0pp $608 | -0.5pp $543 | base $477 | +0.5pp $410 | +1.0pp $341 |
UW: 25.0% down · 7.5% · 30yr · 1.5% tax · 5.0% vac · 8.0% maint · 8.0% mgmt
Financing live
Cash to close
- Down payment
- $64,988
- Closing costs
- $7,798
- Reserves months
- —
- Total cash needed
- —
Loan-product check · same deal, 3 products live
Conventional
25% down · 7.5% · 30yr
- Down + closing
- —
- Monthly P&I
- —
- Monthly cashflow
- —
- DSCR
- —
- Eligible?
- —
Personal DTI + credit; lowest rate.
DSCR
20% down · 8.5% · 30yr
- Down + closing
- —
- Monthly P&I
- —
- Monthly cashflow
- —
- DSCR
- —
- Eligible?
- —
No personal income docs; deal must DSCR.
Hard money
10% down · 12.0% · 12mo
- Down + closing
- —
- Monthly P&I
- —
- Monthly cashflow
- —
- DSCR
- —
- Eligible?
- —
Short-term bridge; refi at stabilization.
Listing history 18 events
-
2026-06-21days on market $259,950 Active 71 DOM
-
2026-06-18days on market $259,950 Active 68 DOM
-
2026-06-17price $259,950 Active 67 DOM
-
2026-06-17days on market $274,950 Active 67 DOM
-
2026-06-16days on market $274,950 Active 66 DOM
-
2026-06-15days on market $274,950 Active 65 DOM
-
2026-06-13days on market $274,950 Active 63 DOM
-
2026-06-13days on market $274,950 Active 62 DOM
-
2026-06-09days on market $274,950 Active 59 DOM
-
2026-06-08days on market $274,950 Active 58 DOM
-
2026-06-07statusdays on market $274,950 Active 57 DOM
-
2026-06-01status $274,950 Pending 54 DOM
-
2026-05-31days on market $274,950 Active 54 DOM
-
2026-05-05price $274,950
-
2026-04-07$289,950 Active
-
2005-06-01soldstatus $72,000
-
2005-05-31soldstatus $72,000
-
2005-03-15$74,670
ⓘ Source: listings_history table (triggers on properties + properties_extension) + one-shot
backfill from property_details.listing_events for pre-trigger history.
Tax reassessment forecast WA · Resets to sale price
- Current annual tax
- $2,389 · $199/mo
- Projected year-2 tax
- $2,548 · $212/mo
- Expected delta
- +$158/yr (+$13/mo · 6.6%)
ⓘ Screening estimate from a state-policy table — verify with the county assessor before closing.
Climate risk First Street
- Flood 1/10 Low FEMA zone X (unshaded) · 0% chance over 30 yrs
- Wildfire 3/10 Moderate
- Heat 3/10 Moderate 7 d/yr ≥87°F today · 15 d/yr by 30 yrs out
- Wind 1/10 Low
- Air quality 6/10 Major 7 unhealthy d/yr today · 9 by 30 yrs out
Nearby sold comps map
Loading sold comps map…
Walkable amenities ~0.75 mi
Loading nearby amenities…
Taxation est. · year 1
- Rental income
- $32,622
- − Mortgage interest
- −$14,561
- − Property taxes
- −$2,389
- − Insurance
- −$1,300
- − Repairs & maintenance
- −$2,610
- − Management
- −$2,610
- − Depreciation
- −$7,562
- Taxable income
- $1,590
- Est. tax owed @ 24.0%
- −$382
- After-tax cash flow
- $5,342/yr
For passive investors: Depreciation is non-cash, so a rental often shows a tax loss while cash-flowing — sheltering income. Rental losses are passive: they offset passive income freely, and up to $25,000/yr can offset ordinary (W-2) income if you actively participate and your MAGI is under $100k (phasing out to $0 by $150k); unused losses carry forward. On sale, claimed depreciation is recaptured at up to 25%, and gains may owe capital-gains tax (a 1031 exchange can defer both). Figures are a year-1 estimate at your 24.0% rate — not tax advice; consult a CPA.
Schools (NCES district)
- District
- Bethel School District
- NCES district ID
- 5300480
- Math proficiency
- 47% ▬ 0.00%
- Reading proficiency
- 59% ▲ 2.00%
- Median HH income
- $65,872
- Composite
- 48.66/100
- National rank
- #4568
- State rank
- #103 of 291 in WA
Livability — Elk Plain
- Score
- 63/100
- State rank
- #379
- US rank
- #14927
Category grades
Schools grade is shown separately in the Schools card above.
Census & demographics
- Census place
- Elk Plain, WA
- County
- Pierce County · 788,257 people
- City population
- 49,940
- Metro
- Seattle-Tacoma-Bellevue, WA
- Population (ZIP)
- 32,687
- Household income
- $114,819
- Rent vs Own
- Severe rent burden
- 236.0
Population outlook (Pierce County) Hauer SSP2
- Today (2025)
- 956,648 people
- By 2030
- 1,010,862 · +5.7%
- By 2040
- 1,113,170 · +16.4%
- By 2050
- 1,206,524 · +26.1%
- By 2075
- 1,436,425 · +50.2%
- By 2100
- 1,563,654 · +63.5%
Race, ethnicity, and origin ACS 2023
- Neighborhood character
- Predominantly White (71%)
- Race & ethnicity
- White 71% Two or more races 15% Hispanic / Latino 12% Asian 3% Black 3% Pacific Islander 2% Native American 1%
- Hispanic origin (detail)
- Mexican 7%
- Common ancestry
- Italian 4% Portuguese 4% Iranian 3%
- Foreign-born
- 7% · Canada, South Korea, China
- Languages at home
- 88% English-only · Spanish 5% Russian/Polish/Slavic 2% Other Asian/Pacific 1%
Political lean MEDSL · Pierce
- 2024 margin
- D (+10.8) · D 53.9% · R 43.1% · Other 3.0%
- 2008→2024 swing
- -1.4pp toward R · 2008: 12.2pp · 2024: 10.8pp
- All cycles
- 2024: D+10.8 2020: D+11.2 2016: D+7.5 2012: D+11.0 2008: D+12.2
Not yet ingested
- Civics
- —
Market trends
- HPI YoY
- ▼ -501.28%
- Current HPI
- 304.4241
- Rent YoY
- ▲ 3.32%
- Metro
- Seattle-Tacoma-Bellevue, WA
- State GDP YoY
- ▲ 4.65%
- F500 in state
- 22
Industry mix (Fortune 500 HQ in WA)
| Industry | F500 HQs | Revenue |
|---|---|---|
| Retail | 2 | $269B |
|
||
| Technology / Retail | 1 | $638B |
|
||
| Technology | 1 | $245B |
|
||
| Telecommunications | 1 | $38B |
|
||
| Food / Beverage | 1 | $36B |
|
||
| Automotive / Trucks | 1 | $34B |
|
||
Price history
+268.2% since first listed5 events — show timeline
- 2026-05-05 Price Changed $274,950 NWMLS as Distributed by MLS Grid
- 2026-04-07 Listed $289,950 NWMLS as Distributed by MLS Grid
- 2005-06-01 Sold (MLS) $72,000 NWMLS as Distributed by MLS Grid
- 2005-05-31 Sold (Public Records) $72,000 Public Records
- 2005-03-15 Listed $74,670 NWMLS as Distributed by MLS Grid
Property tax history
+5.6%/yrLatest (2026): $2,389 · +10.8% YoY. Source: county tax records.
Cash-flow waterfall
monthlySold comps — $/sqft
last 12 mo · ≤1 miLoading sold comps…