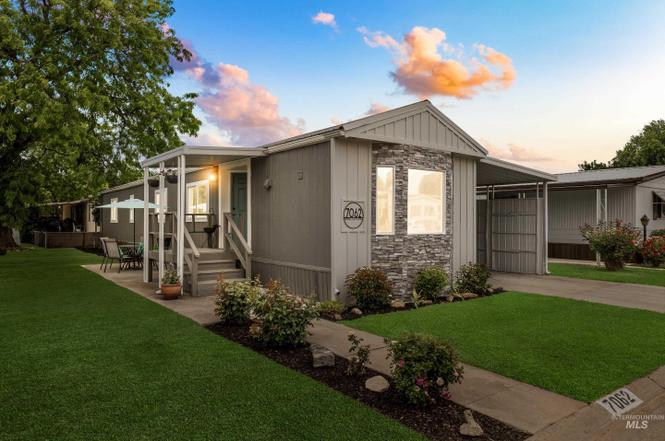
7062 Royal Glen Ln · Boise City, ID
Flood risk 1/10 · Minimal
- FEMA flood zone
- X (unshaded)
- Chance of flooding over 30 yrs
- 0.0%
- Est. flood insurance / yr
- $507 – $1,088
Fire risk 8/10 · Major
- Est. fire insurance / yr
- $584 – $1,086
Heat risk 4/10 · Minor
- Hot days now (above 97°F)
- 7 days/yr
- Hot days in 30 yrs
- 18 days/yr
Wind risk 1/10 · Minimal
- Chance of severe wind over 30 yrs
- —
Air-quality risk 9/10 · Severe
- Unhealthy air days now
- 19 days/yr
- Unhealthy air days in 30 yrs
- 19 days/yr
Risk factors via First Street. Map © Google.
Why this score? — see what drove the B- grade
The composite is a weighted blend of 9 inputs, each scored 0–100. Each bar is that input's sub-score; the figure is the points it added to the 100-point composite (weight × sub-score).
- Cash flow +29.9/30.0
- DSCR +10.0/10.0
- 1% rule +8.4/10.0
- ARV discount +7.5/15.0
- Schools +4.2/10.0
- Rent growth +3.7/5.0
- Livability +2.5/5.0
- Condition / age +2.5/5.0
- Appreciation +0.0/10.0
$118,900
🖨 Deal sheet 📄 Offer letter ✓ Due diligence
Listing remarks
Beautifully renovated home in a desirable 55+ manufactured home community in Northwest Boise. Centrally located with convenient access to shopping, dining, medical services, parks, and everyday amenities. Vaulted ceilings in the living room and kitchen create an open, airy feel, while abundant natural light fills the home. The inviting living area features a stunning stone fireplace that serves as a warm focal point for gathering and relaxing. The fully updated kitchen is designed to impress with new cabinetry, gorgeous quartz countertops, designer tile backsplash, new appliances, and a charming bay window dining area. New luxury vinyl plank flooring flows throughout the main living spaces,
Key facts
- Quartz countertops
- Stone fireplace
- Parking
Tags
Property features AI
Finance
- HOA & community: Located in a senior (55+) community
Exterior
- Parking: Covered carport (1 space)
- Utilities: City water service; Sewer connected
- Home design: Mobile/manufactured home on a rented lot; Located in an over-55 community
- Construction: Built in 1986; Stone exterior; Metal roof
- Exterior features: Partial fencing; Auto and manual sprinkler systems; Storage shed
Interior
- Kitchen: Dishwasher; Microwave; Freestanding range/oven
- Bedrooms: 2 bedrooms (both on the main level)
- Flooring: Carpet
- Bathrooms: 1 bathroom
- Heating & cooling: Electric heating; Central air conditioning
- Interior features: Kitchen island; Quartz countertops; Fireplace
- Laundry & utility: Electric water heater
Neighborhood map
What this means for you Summary
Snapshot
- This is a 2-bed/1.0-bath manufactured listed at $119k.
Deal economics
- At list price, monthly cash flow is $439 ($5k/yr) — positive.
- The deal already cash-flows at list — no discount required.
- Meets the 1% rule at list price ($2k rent vs $119k).
- Cap rate 10.7% vs local median 2.6% in Boise City — top-decile yield for the area; either an underpriced asset or a hidden risk that comps aren't pricing in. Stress-test before assuming the spread holds.
Location & tenants
- Location reads: area grade B — affects rentability + tenant quality, not the cash-flow math above.
- Boise Independent District (urban): math 42% / reading 56% proficiency, ranked #36 of 92 in ID (top 39%) — families likely to look elsewhere, expect single-tenant / working-renter base with shorter leases.
- Zoned schools: Shadow Hills Elementary (math 33% / reading 46%, grade F, #234 of 357 statewide, top 69%, 445 students, 24% FRL); Capital Senior High School (math 34% / reading 57%, grade D-, #59 of 169 statewide, top 35%, 1,220 students, 28% FRL).
- Market conditions: Rents rising fast (+4.9%/yr); 445 active listings in the ZIP; 14 comparable units currently listed for rent nearby; rentals at typical pace (median 14d on market — plan ~3-4 weeks tenant-placement turnaround); solid renter incomes; 5,129 units permitted in Ada County in 2024 (414 in 5+ unit buildings).
Forward outlook
- Local home prices are declining (-3.0%/yr); year-one equity from $822 of loan paydown is wiped out by about $4k of value loss. Plan a longer hold.
- Ada County population projected at +45% by 2050 — long-run rental-demand tailwind backs the buy-and-hold thesis.
- At projected returns (-3.0% appreciation + 4.9% rent growth), your $33k cash investment doubles in ~7 years — after that, you're playing with house money.
Negotiation context
- Only 7 days on market — expect competitive offers; lowballing is unlikely to land.
- 2 sale attempts since 7y ago with the ask held roughly flat each time — persistent listings suggest the price (not the market) is what's stuck; bring a comps-based counter.
Risks & watch-outs
- Climate carrying-cost: severe wildfire risk — expect insurance premiums to compound above CPI over the hold.
Questions for the listing agent
- Is there a deadline driving the sale (1031 exchange, divorce, estate, relocation)? That informs how much negotiation room exists.
- What's the average days-on-market for RENTAL listings here right now (not sales)? A rising rental-DOM trend means longer vacancies and softer asking-rent achievability than the comps imply.
- What's the recent tenant-quality profile in this submarket — average credit score on applications, eviction rate, late-payment / NSF rate, and stable-employment percentage? A property-management company in the area should have these aggregated.
- How much new for-sale + rental construction is in the pipeline within 1–3 miles? Heavy new supply typically softens prices + rents 12–24 months out; constrained supply supports both.
Investment metrics
- 1% rule
- 1.34% ✓
- Cap rate
- 10.72%
- Cash-on-cash
- 15.81%
- DSCR
- 1.70
- GRM
- 6.2
CMA / ARV
- ARV (on-the-fly)
- $62,846
- Comps found
- 12
Show comp detail 12 sales within ~0.75 mi
| Address | Dist | Beds/Ba | Sqft | Sold | Price | $/sf | Match |
|---|---|---|---|---|---|---|---|
| 5262 N North Glen Ln #43 | 0.12mi | 2/1.0 | 938 (0%) | 0mo | $75,000 | $80 | 94 |
| 7015 W Royal Glen Ln | 0.03mi | 2/1.5 | 972 (+4%) | 1mo | $15,000 | $15 | 90 |
| 6990 W Royal Glen Ln | 0.04mi | 2/1.0 | 938 (0%) | 15mo | $44,900 | $48 | 86 |
| 6955 Royal Glen Ln | 0.06mi | 3/2.0 (+1) | 924 (-2%) | 9mo | $67,500 | $73 | 78 |
| 5432 N Glencrest Ln | 0.10mi | 2/1.0 | 938 (0%) | 21mo | $30,000 | $32 | 78 |
| 5285 N Glen | 0.15mi | 2/1.0 | 840 (-10%) | 2mo | $49,900 | $59 | 74 |
| 5637 Fairfax Ln | 0.55mi | 2/1.0 | 924 (-2%) | 1mo | $124,900 | $135 | 71 |
| 7973 Manassas | 0.51mi | 2/1.0 | 924 (-2%) | 9mo | $134,900 | $146 | 66 |
| 7837 W Manassas | 0.43mi | 2/2.0 | 924 (-2%) | 10mo | $50,000 | $54 | 65 |
| 7008 Royal Glen Ln | 0.03mi | 2/2.0 | 840 (-10%) | 20mo | $89,500 | $107 | 60 |
| 6971 Garden Glen Ln | 0.05mi | 2/2.0 | 1,056 (+13%) | 18mo | $69,500 | $66 | 58 |
| 5504 Glencrest Ln | 0.11mi | 2/2.0 | 1,044 (+11%) | 18mo | $69,900 | $67 | 57 |
Match score weights: distance 35% · size 25% · config 20% · recency 20%. Top-matched comps best support the ARV.
Projected returns pro-forma
-3.0% appreciation · 4.87% rent growth · sell at horizon
- IRR
- 8.8%
- Equity multiple
- 1.35×
- Total profit
- $11,746
- Equity at exit
- $17,728
- IRR
- 19.5%
- Equity multiple
- 2.78×
- Total profit
- $59,328
- Equity at exit
- $10,280
Cash invested: $33,292 (down + closing). Projections, not guarantees.
Landlord ↔ Tenant lean methodology
- Overall (STATE)
- 91 Strongly Landlord-Friendly
- State Idaho
- 91 Strongly Landlord-Friendly · R+18
- County
- — inherits STATE
- City
- — inherits STATE
ZIP-level market 83714
- Home prices YoY
- -31.5%
- Rents YoY
- 4.9%
- Active inventory
- 445
- Price-to-rent
- 6.2×
Monthly cashflow live
- Estimated rent
- $1,595 high interval (Pro) →
- Mortgage (P&I)
- −$624
- Tax est. 1.5%
- −$149 /mo · $1,784/yr
- Insurance
- −$50
- HOA
- −$0
- Vacancy / Maint / Mgmt
- −$335
- Net cashflow
- $439
Break-even live
UW: 25.0% down · 7.5% · 30yr · 1.5% tax · 5.0% vac · 8.0% maint · 8.0% mgmt
Financing live
Cash to close
- Down payment
- $29,725
- Closing costs
- $3,567
- Reserves months
- —
- Total cash needed
- —
Loan-product check · same deal, 3 products live
Conventional
25% down · 7.5% · 30yr
- Down + closing
- —
- Monthly P&I
- —
- Monthly cashflow
- —
- DSCR
- —
- Eligible?
- —
Personal DTI + credit; lowest rate.
DSCR
20% down · 8.5% · 30yr
- Down + closing
- —
- Monthly P&I
- —
- Monthly cashflow
- —
- DSCR
- —
- Eligible?
- —
No personal income docs; deal must DSCR.
Hard money
10% down · 12.0% · 12mo
- Down + closing
- —
- Monthly P&I
- —
- Monthly cashflow
- —
- DSCR
- —
- Eligible?
- —
Short-term bridge; refi at stabilization.
Rent comps 14 comps
| Address | Beds | Baths | Sqft | Rent | $/sqft | DOM | Units | Dist |
|---|---|---|---|---|---|---|---|---|
| 7570 W State St Boise, ID | 1.0–4.0 | 1.0–2.5 | 1236 | $1,817 | $1.47 | 2d | 21 | 0.31mi |
| 5497 N Pierce Park Ln Unit 79-202 Boise, ID | 2.0 | 1.5 | 880 | $1,395 | $1.59 | 14d | 1 | 0.34mi |
| 5497 N Pierce Park Ln Boise, ID | 2.0 | 1.5 | 880 | $1,445 | $1.64 | 2d | 3 | 0.34mi |
| 5497 N Pierce Park Ln Unit 53-101 Boise, ID | 2.0 | 1.5 | 880 | $1,495 | $1.70 | 14d | 1 | 0.34mi |
| 6589 W Lucky Ln Boise, ID | 2.0 | 2.0 | 1025 | $1,450 | $1.41 | 19d | 1 | 0.49mi |
| 59515953 N Pierce Park Ln Unit 5951 Boise, ID | 2.0 | 1.0 | 850 | $1,450 | $1.71 | 3d | 1 | 0.51mi |
| 6474 W Lucky Ln Unit 12202 Boise, ID | 2.0 | 2.0 | 1100 | $1,500 | $1.36 | 23d | 1 | 0.57mi |
| 4807 N Fortune Ln Unit 201 Boise, ID | 2.0 | 2.0 | 925 | $1,245 | $1.35 | 14d | 1 | 0.57mi |
| 6200 N River Pointe Ln Garden City, ID | 1.0–3.0 | 1.0–2.0 | 1000 | $2,416 | $2.42 | 2d | 8 | 0.73mi |
| 8255 W Limelight St Boise, ID | 1.0 | 1.0 | 724 | $1,545 | $2.13 | 2d | 3 | 0.76mi |
| 6103 W State St Unit 6103-12 Boise, ID | 2.0 | 1.0 | 825 | $1,350 | $1.64 | 23d | 1 | 0.97mi |
| 6103 W State St Unit 6103-10 Garden City, ID | 1.0 | 1.0 | 580 | $1,150 | $1.98 | 23d | 1 | 0.97mi |
| 6043 W Port Pl Unit 104 Boise, ID | 2.0 | 2.0 | 950 | $1,345 | $1.42 | 2d | 1 | 0.97mi |
| 3950 N Cambria Way Boise, ID | 2.0 | 1.0 | 863 | $1,695 | $1.96 | 23d | 1 | 1.48mi |
Listing history 6 events
-
2026-06-18days on market $118,900 Active 7 DOM
-
2026-06-17days on market $118,900 Active 6 DOM
-
2026-06-16days on market $118,900 Active 5 DOM
-
2026-06-15days on market $118,900 Active 4 DOM
-
2026-06-13remarks 699-char remark
-
2026-06-13$118,900 Active 2 DOM
ⓘ Source: listings_history table (triggers on properties + properties_extension) + one-shot
backfill from property_details.listing_events for pre-trigger history.
Climate risk First Street
- Flood 1/10 Low FEMA zone X (unshaded) · 0% chance over 30 yrs
- Wildfire 8/10 Severe
- Heat 4/10 Moderate 7 d/yr ≥97°F today · 18 d/yr by 30 yrs out
- Wind 1/10 Low
- Air quality 9/10 Extreme 19 unhealthy d/yr today · 19 by 30 yrs out
Nearby sold comps map
Loading sold comps map…
Walkable amenities ~0.75 mi
Loading nearby amenities…
Taxation est. · year 1
- Rental income
- $19,143
- − Mortgage interest
- −$6,660
- − Property taxes
- −$1,784
- − Insurance
- −$594
- − Repairs & maintenance
- −$1,531
- − Management
- −$1,531
- − Depreciation
- −$3,459
- Taxable income
- $3,583
- Est. tax owed @ 24.0%
- −$860
- After-tax cash flow
- $4,403/yr
For passive investors: Depreciation is non-cash, so a rental often shows a tax loss while cash-flowing — sheltering income. Rental losses are passive: they offset passive income freely, and up to $25,000/yr can offset ordinary (W-2) income if you actively participate and your MAGI is under $100k (phasing out to $0 by $150k); unused losses carry forward. On sale, claimed depreciation is recaptured at up to 25%, and gains may owe capital-gains tax (a 1031 exchange can defer both). Figures are a year-1 estimate at your 24.0% rate — not tax advice; consult a CPA.
Schools (NCES district)
- District
- Boise Independent District
- NCES district ID
- 1600360
- Math proficiency
- 42% ▼ -5.00%
- Reading proficiency
- 56% ▼ -1.00%
- Median HH income
- $49,135
- Composite
- 41.82/100
- National rank
- #3388
- State rank
- #36 of 92 in ID
Livability — Boise City
No livability data for this city. (Only ~50 U.S. cities are tracked.)
Census & demographics
- Census place
- Boise City, ID
- County
- Ada County · 522,161 people
- City population
- 152,689
- Metro
- Boise City, ID
- Population (ZIP)
- 27,564
- Household income
- $87,651
- Rent vs Own
- Severe rent burden
- 557.0
Population outlook (Ada County) Hauer SSP2
- Today (2025)
- 535,818 people
- By 2030
- 585,751 · +9.3%
- By 2040
- 682,435 · +27.4%
- By 2050
- 775,818 · +44.8%
- By 2075
- 994,458 · +85.6%
- By 2100
- 1,148,884 · +114.4%
Race, ethnicity, and origin ACS 2023
- Neighborhood character
- Predominantly White (86%)
- Race & ethnicity
- White 86% Hispanic / Latino 9% Two or more races 7%
- Hispanic origin (detail)
- Mexican 7%
- Common ancestry
- Italian 4% Slovak 4% Portuguese 4%
- Foreign-born
- 5% · Canada
- Languages at home
- 92% English-only · Spanish 5% Russian/Polish/Slavic 2% Other Indo-European 1%
Political lean MEDSL · Ada
- 2024 margin
- R (+10.3) · D 43.4% · R 53.8% · Other 2.8%
- 2008→2024 swing
- -4.2pp toward R · 2008: -6.2pp · 2024: -10.3pp
- All cycles
- 2024: R+10.3 2020: R+3.9 2016: R+9.2 2012: R+11.3 2008: R+6.2
Not yet ingested
- Civics
- —
Market trends
- HPI YoY
- ▼ -155.87%
- Current HPI
- 339.0701
- Rent YoY
- ▲ 4.87%
- Metro
- Boise City, ID
- State GDP YoY
- ▲ 4.51%
- F500 in state
- 6
Industry mix (Fortune 500 HQ in ID)
| Industry | F500 HQs | Revenue |
|---|---|---|
| Retail | 1 | $79B |
|
||
| Technology | 1 | $25B |
|
||
| Food / Agriculture | 1 | $6B |
|
||
Price history
+198.0% since first listed5 events — show timeline
- 2026-06-11 Listed $118,900 IMLS
- 2020-01-13 Sold (MLS) — IMLS
- 2020-01-10 Pending — IMLS
- 2020-01-07 Contingent — IMLS
- 2019-10-31 Listed $39,900 IMLS
Cash-flow waterfall
monthlySold comps — $/sqft
last 12 mo · ≤1 miLoading sold comps…