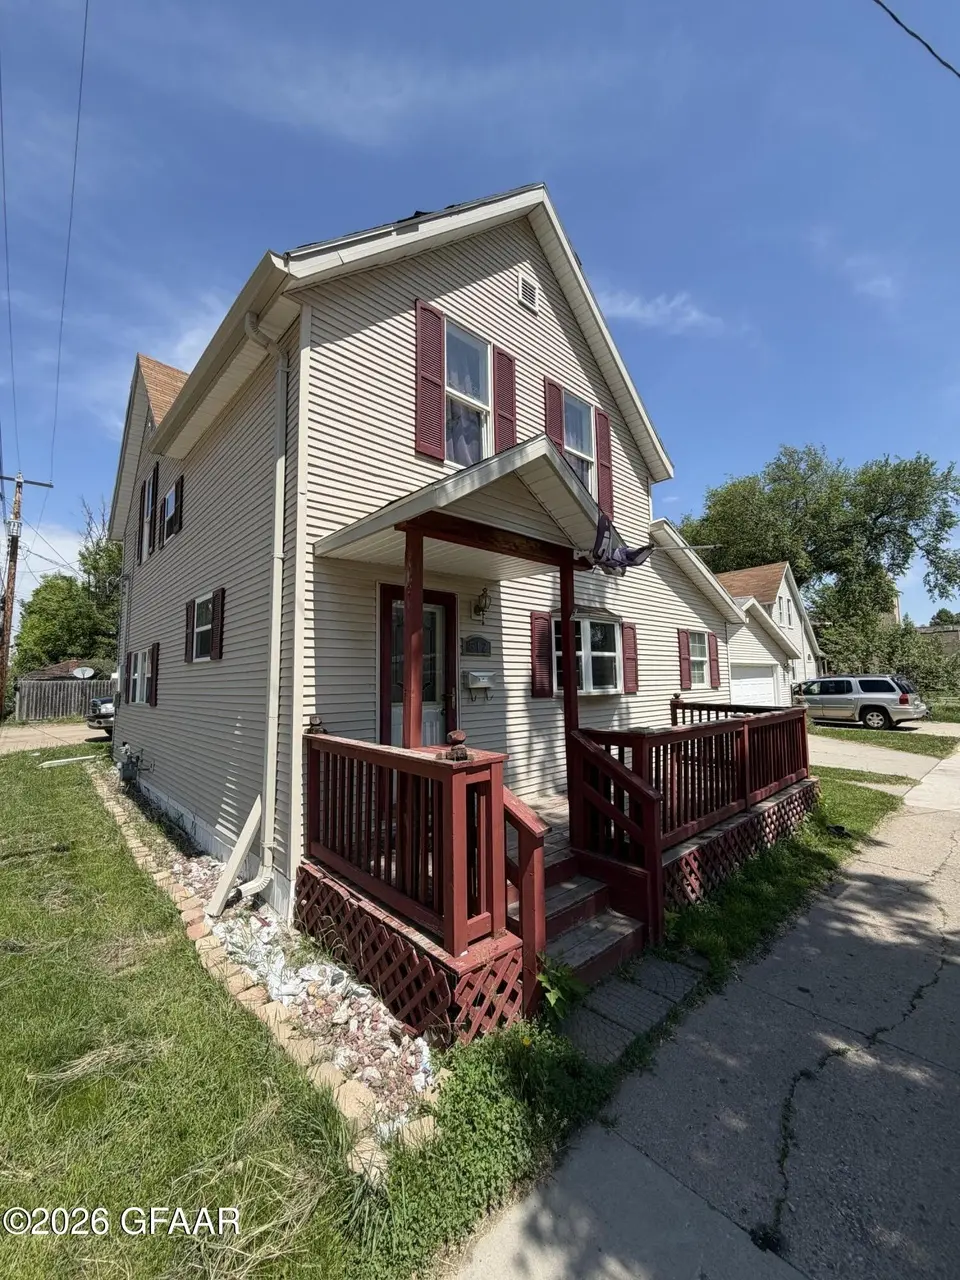
512 4th Ave S · Grand Forks, ND
Flood risk 1/10 · Minimal
- FEMA flood zone
- X
- Chance of flooding over 30 yrs
- 0.0%
- Est. flood insurance / yr
- $507 – $1,088
Fire risk 1/10 · Minimal
- Est. fire insurance / yr
- $1,289 – $2,393
Heat risk 2/10 · Minimal
- Hot days now (above 96°F)
- 7 days/yr
- Hot days in 30 yrs
- 12 days/yr
Wind risk 1/10 · Minimal
- Chance of severe wind over 30 yrs
- —
Air-quality risk 4/10 · Minor
- Unhealthy air days now
- 4 days/yr
- Unhealthy air days in 30 yrs
- 4 days/yr
Risk factors via First Street. Map © Google.
Why this score? — see what drove the B+ grade
The composite is a weighted blend of 9 inputs, each scored 0–100. Each bar is that input's sub-score; the figure is the points it added to the 100-point composite (weight × sub-score).
- Cash flow +30.0/30.0
- ARV discount +15.0/15.0
- DSCR +10.0/10.0
- 1% rule +7.8/10.0
- Rent growth +4.8/5.0
- Livability +3.9/5.0
- Schools +3.6/10.0
- Condition / age +2.5/5.0
- Appreciation +0.0/10.0
$150,000
🖨 Deal sheet (PDF) 📄 Offer letter ✓ Due diligence
Key facts
- Main-floor laundry
- 3,000 sq ft lot
- 2 garage spots
Tags
Property features AI
Finance
- Financial info: Annual tax reported
Exterior
- Parking: 2-car garage
- Home design: Two-level single family residence; Residential property
- Construction: Above-grade finished area reported as 1,431 (total building area reported separately)
- Exterior features: Lot approximately 50 x 60 (3,000 sq ft)
Interior
- Interior features: 11 total rooms
Neighborhood map
What this means for you Summary
Snapshot
- This is a 4-bed/2.0-bath single-family listed at $150k.
Deal economics
- At list price, monthly cash flow is $570 ($7k/yr) — positive.
- The deal already cash-flows at list — no discount required.
- Meets the 1% rule at list price ($2k rent vs $150k).
- Recommended offer: $148k (1.5% below list) — sets the bar for market timing.
- Cap rate 10.9% vs local median 2.2% in Grand Forks — top-decile yield for the area; either an underpriced asset or a hidden risk that comps aren't pricing in. Stress-test before assuming the spread holds.
Location & tenants
- Location reads 78/100 on livability (#8 in ND, #2,645 nationally) — a middle-class / working-renter tenant base. Strengths: cost of living A+, housing A+, health & safety A+; Watch: employment C-, crime D+.
- Grand Forks 1 (urban): math 37% / reading 49% proficiency, ranked #27 of 53 in ND (top 51%) — families likely to look elsewhere, expect single-tenant / working-renter base with shorter leases.
- Zoned schools: Phoenix Elementary School (math 37% / reading 42%, grade F, #137 of 236 statewide, top 63%, 260 students, 45% FRL); Valley Middle School (math 22% / reading 40%, grade F, #31 of 35 statewide, top 88%, 513 students, 56% FRL); Central High School (math 29% / reading 56%, grade F, #48 of 144 statewide, top 33%, 1,093 students, 32% FRL) — zoned schools average 45% FRL vs 29% district-wide (16 pts higher); higher-poverty schools than district average — tighter screening recommended.
- Market conditions: Rents rising fast (+9.3%/yr); 287 active listings in the ZIP; 1 comparable units currently listed for rent nearby; 133 units permitted in Grand Forks County in 2024 (0 in 5+ unit buildings).
- This rent runs 34% of the median local income ($68k/yr) — at the standard rent-burdened threshold; future hikes will face affordability resistance.
Forward outlook
- Local home prices are declining (-3.0%/yr); year-one equity from $1k of loan paydown is wiped out by about $4k of value loss. Plan a longer hold.
- Grand Forks County population projected at +43% by 2050 — long-run rental-demand tailwind backs the buy-and-hold thesis.
- At projected returns (-3.0% appreciation + 8.0% rent growth), your $42k cash investment doubles in ~6 years — after that, you're playing with house money.
Negotiation context
- It's been on market 19 days — a 2% lower offer ($148k) is reasonable based on typical stale-listing flexibility.
Risks & watch-outs
- Watch-outs: built in 1893 — expect roof / HVAC / electrical / plumbing capex.
Questions for the listing agent
- Built in 1893 — when were the roof, HVAC, electrical panel, plumbing, and water heater last replaced?
- Is there a deadline driving the sale (1031 exchange, divorce, estate, relocation)? That informs how much negotiation room exists.
- Schools are B-rated — typically a magnet for longer-tenancy family renters. What's the average tenant stay here, and is there a school-zone premium baked into asking?
- Crime grade is D in this area — have there been break-ins, vandalism, or insurance claims at this property in the last 3 years? What carrier currently insures it and at what premium?
- What's the average days-on-market for RENTAL listings here right now (not sales)? A rising rental-DOM trend means longer vacancies and softer asking-rent achievability than the comps imply.
- What's the recent tenant-quality profile in this submarket — average credit score on applications, eviction rate, late-payment / NSF rate, and stable-employment percentage? A property-management company in the area should have these aggregated.
- How much new for-sale + rental construction is in the pipeline within 1–3 miles? Heavy new supply typically softens prices + rents 12–24 months out; constrained supply supports both.
Investment metrics
- 1% rule
- 1.28% ✓
- Cap rate
- 10.85%
- Cash-on-cash
- 16.28%
- DSCR
- 1.72
- GRM
- 6.5
CMA / ARV
- ARV (on-the-fly)
- $293,355
- Comps found
- 12
Show comp detail 12 sales within ~0.75 mi
| Address | Dist | Beds/Ba | Sqft | Sold | Price | $/sf | Match |
|---|---|---|---|---|---|---|---|
| 1010 Chestnut St | 0.50mi | 4/2.5 | 1,404 (-2%) | 2mo | $305,000 | $217 | 70 |
| 824 Chestnut St | 0.38mi | 4/2.0 | 1,344 (-6%) | 3mo | $236,900 | $176 | 69 |
| 920 Cherry St | 0.47mi | 3/2.0 (-1) | 1,484 (+4%) | 2mo | $222,000 | $150 | 66 |
| 209 Cottonwood St | 0.10mi | 3/2.0 (-1) | 1,224 (-14%) | 4mo | $255,000 | $208 | 62 |
| 907 9th St | 0.50mi | 4/2.0 | 1,296 (-9%) | 1mo | $310,000 | $239 | 60 |
| 1006 Cottonwood St | 0.48mi | 3/2.0 (-1) | 1,344 (-6%) | 3mo | $275,000 | $205 | 60 |
| 823 S 9th St | 0.47mi | 4/1.0 | 1,313 (-8%) | 6mo | $235,000 | $179 | 55 |
| 1205 S 9th St | 0.66mi | 4/2.0 | 1,369 (-4%) | 8mo | $299,900 | $219 | 55 |
| 1317 Chestnut Street St | 0.74mi | 3/2.0 (-1) | 1,420 (-1%) | 6mo | $249,900 | $176 | 54 |
| 503 N 4th St | 0.69mi | 4/2.0 | 1,360 (-5%) | 9mo | $107,000 | $79 | 52 |
| 1006 S 9th St | 0.57mi | 3/2.5 (-1) | 1,290 (-10%) | 3mo | $319,500 | $248 | 48 |
| 1314 Cottonwood St | 0.72mi | 4/3.0 | 1,614 (+13%) | 1mo | $298,900 | $185 | 40 |
Match score weights: distance 35% · size 25% · config 20% · recency 20%. Top-matched comps best support the ARV.
Projected returns pro-forma
-3.0% appreciation · 8.0% rent growth · sell at horizon
- IRR
- 12.5%
- Equity multiple
- 1.53×
- Total profit
- $22,106
- Equity at exit
- $22,365
- IRR
- 24.9%
- Equity multiple
- 3.67×
- Total profit
- $112,050
- Equity at exit
- $12,969
Cash invested: $42,000 (down + closing). Projections, not guarantees.
Landlord ↔ Tenant lean methodology
- Overall (STATE)
- 82 Strongly Landlord-Friendly
- State North Dakota
- 82 Strongly Landlord-Friendly · R+20
- County
- — inherits STATE
- City
- — inherits STATE
ZIP-level market 58201
- Rents YoY
- 9.3%
- Active inventory
- 287
- Price-to-rent
- 6.5×
Monthly cashflow live
- Estimated rent
- $1,920 medium interval (Pro) →
- Mortgage (P&I)
- −$787
- Tax from tax record
- −$98 /mo · $1,171/yr
- Insurance
- −$62
- HOA
- −$0
- Vacancy / Maint / Mgmt
- −$403
- Net cashflow
- $570
Break-even live
Sensitivity live
| Price | -10% $655 | -5% $612 | +0% $570 | +5% $527 | +10% $485 |
|---|---|---|---|---|---|
| Rent | -10% $418 | -5% $494 | +0% $570 | +5% $646 | +10% $721 |
| Rate | -1.0pp $645 | -0.5pp $608 | base $570 | +0.5pp $531 | +1.0pp $491 |
UW: 25.0% down · 7.5% · 30yr · 1.5% tax · 5.0% vac · 8.0% maint · 8.0% mgmt
Financing live
Cash to close
- Down payment
- $37,500
- Closing costs
- $4,500
- Reserves months
- —
- Total cash needed
- —
Loan-product check · same deal, 3 products live
Conventional
25% down · 7.5% · 30yr
- Down + closing
- —
- Monthly P&I
- —
- Monthly cashflow
- —
- DSCR
- —
- Eligible?
- —
Personal DTI + credit; lowest rate.
DSCR
20% down · 8.5% · 30yr
- Down + closing
- —
- Monthly P&I
- —
- Monthly cashflow
- —
- DSCR
- —
- Eligible?
- —
No personal income docs; deal must DSCR.
Hard money
10% down · 12.0% · 12mo
- Down + closing
- —
- Monthly P&I
- —
- Monthly cashflow
- —
- DSCR
- —
- Eligible?
- —
Short-term bridge; refi at stabilization.
Rent comps 1 comps
| Address | Beds | Baths | Sqft | Rent | $/sqft | DOM | Units | Dist |
|---|---|---|---|---|---|---|---|---|
| 214 N 4th St Grand Forks, ND | 3.0 | 1.0–2.0 | 974 | $2,345 | $2.41 | 45d | 1 | 0.53mi |
Listing history 20 events
-
2026-06-22statusdays on market $150,000 Active Under Contract 19 DOM
-
2026-06-19days on market $150,000 Active 16 DOM
-
2026-06-18days on market $150,000 Active 15 DOM
-
2026-06-17days on market $150,000 Active 14 DOM
-
2026-06-16days on market $150,000 Active 13 DOM
-
2026-06-15days on market $150,000 Active 12 DOM
-
2026-06-14days on market $150,000 Active 10 DOM
-
2026-06-13days on market $150,000 Active 9 DOM
-
2026-06-10days on market $150,000 Active 7 DOM
-
2026-06-09days on market $150,000 Active 6 DOM
-
2026-06-08days on market $150,000 Active 5 DOM
-
2026-06-07days on market $150,000 Active 4 DOM
-
2026-06-05pricedays on market $150,000 Active 1 DOM
-
2026-05-30days on market $179,900 Active 102 DOM
-
2026-04-28price $179,900
-
2026-04-14price $185,000
-
2026-03-25price $195,000
-
2026-02-17$200,000 Active
-
2014-10-22soldstatus
-
2014-10-06soldstatus
ⓘ Source: listings_history table (triggers on properties + properties_extension) + one-shot
backfill from property_details.listing_events for pre-trigger history.
Tax reassessment forecast ND · Resets to sale price
- Current annual tax
- $1,171 · $98/mo
- Projected year-2 tax
- $1,470 · $122/mo
- Expected delta
- +$299/yr (+$25/mo · 25.6%)
ⓘ Screening estimate from a state-policy table — verify with the county assessor before closing.
Climate risk First Street
- Flood 1/10 Low FEMA zone X · 0% chance over 30 yrs
- Wildfire 1/10 Low
- Heat 2/10 Low 7 d/yr ≥96°F today · 12 d/yr by 30 yrs out
- Wind 1/10 Low
- Air quality 4/10 Moderate 4 unhealthy d/yr today · 4 by 30 yrs out
Nearby sold comps map
Loading sold comps map…
Walkable amenities ~0.75 mi
Loading nearby amenities…
Taxation est. · year 1
- Rental income
- $23,036
- − Mortgage interest
- −$8,402
- − Property taxes
- −$1,171
- − Insurance
- −$750
- − Repairs & maintenance
- −$1,843
- − Management
- −$1,843
- − Depreciation
- −$4,364
- Taxable income
- $4,663
- Est. tax owed @ 24.0%
- −$1,119
- After-tax cash flow
- $5,719/yr
For passive investors: Depreciation is non-cash, so a rental often shows a tax loss while cash-flowing — sheltering income. Rental losses are passive: they offset passive income freely, and up to $25,000/yr can offset ordinary (W-2) income if you actively participate and your MAGI is under $100k (phasing out to $0 by $150k); unused losses carry forward. On sale, claimed depreciation is recaptured at up to 25%, and gains may owe capital-gains tax (a 1031 exchange can defer both). Figures are a year-1 estimate at your 24.0% rate — not tax advice; consult a CPA.
Schools (NCES district)
- District
- Grand Forks 1
- NCES district ID
- 3808130
- Math proficiency
- 37% ▼ -8.00%
- Reading proficiency
- 49% ▲ 1.00%
- Median HH income
- $44,234
- Composite
- 36.39/100
- National rank
- #4681
- State rank
- #27 of 53 in ND
Livability — Grand Forks
- Score
- 78/100
- State rank
- #8
- US rank
- #2645
Category grades
Schools grade is shown separately in the Schools card above.
Census & demographics
- Census place
- Grand Forks, ND
- County
- Grand Forks County · 58,851 people
- City population
- 58,851
- Metro
- Grand Forks, ND-MN
- Population (ZIP)
- 42,373
- Household income
- $68,143
- Rent vs Own
- Severe rent burden
- 2110.0
Population outlook (Grand Forks County) Hauer SSP2
- Today (2025)
- 80,606 people
- By 2030
- 86,489 · +7.3%
- By 2040
- 99,506 · +23.4%
- By 2050
- 115,269 · +43.0%
- By 2075
- 171,303 · +112.5%
- By 2100
- 238,330 · +195.7%
Race, ethnicity, and origin ACS 2023
- Neighborhood character
- Predominantly White (82%)
- Race & ethnicity
- White 82% Two or more races 7% Hispanic / Latino 5% Black 4% Asian 2% Native American 2%
- Common ancestry
- Portuguese 26% Romanian 4% Lithuanian 3%
- Foreign-born
- 5% · Canada, South Korea, China
- Languages at home
- 93% English-only · Spanish 1% Other Indo-European 1% Russian/Polish/Slavic 1%
Political lean MEDSL · Grand Forks
- 2024 margin
- R (+18.2) · D 40.1% · R 58.3% · Other 1.6%
- 2008→2024 swing
- -23.3pp toward R · 2008: 5.1pp · 2024: -18.2pp
- All cycles
- 2024: R+18.2 2020: R+13.3 2016: R+18.5 2012: R+3.5 2008: D+5.1
Not yet ingested
- Civics
- —
Market trends
- HPI YoY
- ▼ -197.56%
- Current HPI
- 183.128
- Rent YoY
- ▲ 9.31%
- Metro
- Grand Forks, ND-MN
- State GDP YoY
- ▲ 2.09%
- F500 in state
- 2
Industry mix (Fortune 500 HQ in ND)
| Industry | F500 HQs | Revenue |
|---|---|---|
| Utilities / Construction | 1 | $6B |
|
||
Price history
-10.1% since first listed6 events — show timeline
- 2026-04-28 Price Changed $179,900 GFAAR
- 2026-04-14 Price Changed $185,000 GFAAR
- 2026-03-25 Price Changed $195,000 GFAAR
- 2026-02-17 Listed $200,000 GFAAR
- 2014-10-22 Sold (Public Records) — Public Records
- 2014-10-06 Sold (Public Records) — Public Records
Property tax history
-0.2%/yrLatest (2025): $1,171 · -48.6% YoY. Source: county tax records.
Cash-flow waterfall
monthlySold comps — $/sqft
last 12 mo · ≤1 miLoading sold comps…