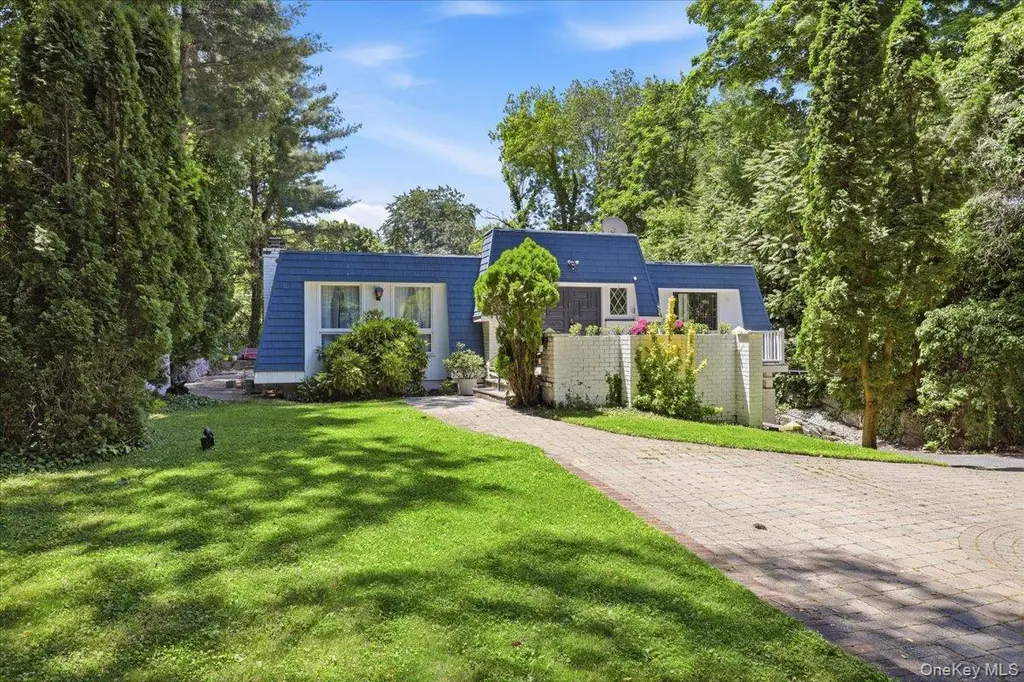
275 Broadfield Rd · New Rochelle, NY
Flood risk 9/10 · Severe
- FEMA flood zone
- X (unshaded)
- Chance of flooding over 30 yrs
- 0.98%
- Est. flood insurance / yr
- $473 – $860
Fire risk 1/10 · Minimal
- Est. fire insurance / yr
- $691 – $1,283
Heat risk 6/10 · Moderate
- Hot days now (above 98°F)
- 7 days/yr
- Hot days in 30 yrs
- 16 days/yr
Wind risk 6/10 · Moderate
- Chance of severe wind over 30 yrs
- 27.0%
Air-quality risk 4/10 · Minor
- Unhealthy air days now
- 3 days/yr
- Unhealthy air days in 30 yrs
- 5 days/yr
Risk factors via First Street. Map © Google.
Why this score? — see what drove the C+ grade
The composite is a weighted blend of 9 inputs, each scored 0–100. Each bar is that input's sub-score; the figure is the points it added to the 100-point composite (weight × sub-score).
- Cash flow +21.6/30.0
- ARV discount +15.0/15.0
- DSCR +6.9/10.0
- 1% rule +6.0/10.0
- Schools +5.7/10.0
- Livability +3.5/5.0
- Rent growth +2.5/5.0
- Condition / age +2.5/5.0
- Appreciation +0.0/10.0
$999,000
🖨 Deal sheet 📄 Offer letter ✓ Due diligence
Listing remarks
Welcome to this sun-drenched contemporary ranch in the sought-after Bonnie Crest neighborhood of New Rochelle. Situated on an expansive and level . 40-acre lot, this home offers 4 bedrooms and 3 bathrooms on the main level, along with an inviting entryway, oversized living room with fireplace opening to the kitchen, large formal dining room, and spacious family room. The family room leads to a deck overlooking the spacious backyard, offering plenty of room for entertaining, recreation, or future expansion. This property presents a unique opportunity to update and personalize a well-located home while enjoying the ease of ranch-style living. The generous, level lot also offers exciting possi
Key facts
- 0.4 acre lot
- Built 1972
- Listed 8 days
Property features AI
Exterior
- Parking: Driveway parking; On-street parking
- Utilities: Electricity connected (Con-Edison); Natural gas connected; Public sewer; Public water connected; Public trash collection
- Home design: Single family residence; Property condition: Actual
- Construction: Frame construction; Full basement with storage space and walk-out access; Attic: none
- Exterior features: Frame construction; Not waterfront
Interior
- Kitchen: Dishwasher; Microwave; Range; Refrigerator; Open kitchen
- Bedrooms: Bedroom(s) on first floor
- Flooring: Tile; Wood
- Bathrooms: 2 full bathrooms; 1 half bathroom
- Heating & cooling: Hot water heating; Natural gas heating; Wall/window air conditioning unit(s); Has fireplace (1)
- Interior features: First-floor bedroom; First-floor full bathroom; Entrance foyer; Formal dining room; In-law floorplan; Open floorplan; Open kitchen; Primary bathroom; Storage space; Washer/dryer hookup
- Laundry & utility: Washer; Dryer; Dedicated laundry room
Neighborhood map
What this means for you Summary
Snapshot
- This is a 4-bed/2.5-bath single-family listed at $999k.
Deal economics
- At list price, monthly cash flow is $1k ($18k/yr) — positive.
- The deal already cash-flows at list — no discount required.
- Meets the 1% rule at list price ($11k rent vs $999k).
- Cap rate 8.1% vs local median 4.5% in New Rochelle — top-decile yield for the area; either an underpriced asset or a hidden risk that comps aren't pricing in. Stress-test before assuming the spread holds.
Location & tenants
- Location reads 69/100 on livability (#487 in NY) — a middle-class / working-renter tenant base. Strengths: employment A+, crime A, amenities B+; Watch: housing D+, commute F, cost of living F.
- New Rochelle City School District (suburban): math 63% / reading 66% proficiency, ranked #171 of 590 in NY (top 29%) — acceptable for families but not a draw, mixed tenant base, ~2y average lease.
- Zoned schools: William B Ward Elementary School (math 56% / reading 72%, grade B, #658 of 2,108 statewide, top 31%, 988 students, 33% FRL); Albert Leonard Middle School (math 41% / reading 73%, grade B, #192 of 729 statewide, top 28%, 1,086 students, 42% FRL); New Rochelle High School (math 87% / reading 72%, grade A-, #518 of 1,100 statewide, top 51%, 3,076 students, 57% FRL) — zoned schools at 44% FRL track the district average.
- Market conditions: 116 active listings in the ZIP; 7 comparable units currently listed for rent nearby; rentals leasing fast (median 1d on market — plan ~1-2 weeks tenant-placement turnaround); 954 units permitted in Westchester County in 2024 (649 in 5+ unit buildings).
Forward outlook
- Local home prices are declining (-3.0%/yr); year-one equity from $7k of loan paydown is wiped out by about $30k of value loss. Plan a longer hold.
- Westchester County population projected at +10% by 2050 — modest demand growth; plan on rents tracking national, not racing it.
Negotiation context
- Only 9 days on market — expect competitive offers; lowballing is unlikely to land.
- 3 sale attempts since 14y ago; this cycle's ask has dropped $101k (9%) from the opening price — seller is motivated, your offer sets the floor, not the list.
- Current owner paid $300k; list at $999k implies a 233% gain — meaningful room to come down on a strong offer.
Risks & watch-outs
- Watch-outs: flood insurance adds $56/mo.
- Climate carrying-cost: severe flood risk; major wind risk, 27% chance of damaging wind over 30y; extreme-heat days projected 7→16/yr by 2055 (HVAC capex compounding) — expect insurance premiums to compound above CPI over the hold.
Questions for the listing agent
- Built in 1972 — when were the roof, HVAC, electrical panel, plumbing, and water heater last replaced?
- What's the actual annual flood-insurance premium (NFIP or private), and is the property in a SFHA with mandatory coverage?
- Is there a deadline driving the sale (1031 exchange, divorce, estate, relocation)? That informs how much negotiation room exists.
- What's the average days-on-market for RENTAL listings here right now (not sales)? A rising rental-DOM trend means longer vacancies and softer asking-rent achievability than the comps imply.
- What's the recent tenant-quality profile in this submarket — average credit score on applications, eviction rate, late-payment / NSF rate, and stable-employment percentage? A property-management company in the area should have these aggregated.
- How much new for-sale + rental construction is in the pipeline within 1–3 miles? Heavy new supply typically softens prices + rents 12–24 months out; constrained supply supports both.
Investment metrics
- 1% rule
- 1.10% ✓
- Cap rate
- 8.12%
- Cash-on-cash
- 6.52%
- DSCR
- 1.29
- GRM
- 7.5
CMA / ARV
- ARV (on-the-fly)
- $1,645,940
- Comps found
- 12
Show comp detail 12 sales within ~0.75 mi
| Address | Dist | Beds/Ba | Sqft | Sold | Price | $/sf | Match |
|---|---|---|---|---|---|---|---|
| 236 Robert Dr | 0.19mi | 5/3.0 (+1) | 3,133 (-10%) | 1mo | $1,900,000 | $606 | 66 |
| 179 Van Etten Blvd | 0.20mi | 4/4.0 | 3,100 (-12%) | 5mo | $1,440,000 | $465 | 61 |
| 16 Broadfield Rd | 0.58mi | 5/3.5 (+1) | 3,455 (-1%) | 11mo | $1,450,000 | $420 | 53 |
| 185 Fenimore Rd | 0.52mi | 4/3.5 | 3,087 (-12%) | 0mo | $1,450,000 | $470 | 52 |
| 59 Mildred Pkwy | 0.49mi | 4/3.0 | 3,180 (-9%) | 10mo | $1,450,000 | $456 | 52 |
| 629 Pinebrook Blvd | 0.48mi | 4/3.5 | 3,947 (+13%) | 6mo | $1,700,000 | $431 | 48 |
| 21 Winding Brook Rd | 0.52mi | 5/3.5 (+1) | 3,211 (-8%) | 9mo | $1,680,000 | $523 | 45 |
| 90 Fenimore Rd | 0.57mi | 5/4.5 (+1) | 3,800 (+8%) | 4mo | $865,000 | $228 | 43 |
| 83 Fenimore Rd | 0.55mi | 4/4.0 | 3,015 (-14%) | 6mo | $1,500,000 | $498 | 40 |
| 150 Lovell Rd | 0.63mi | 4/4.0 | 3,056 (-13%) | 5mo | $1,595,000 | $522 | 39 |
| 45 Fenimore Rd | 0.61mi | 5/3.0 (+1) | 3,000 (-14%) | 7mo | $1,625,000 | $542 | 35 |
| 15 Van Meter Fenway | 0.57mi | 5/3.5 (+1) | 2,986 (-15%) | 14mo | $1,295,000 | $434 | 28 |
Match score weights: distance 35% · size 25% · config 20% · recency 20%. Top-matched comps best support the ARV.
Projected returns pro-forma
-3.0% appreciation · 3.0% rent growth · sell at horizon
- IRR
- -6.6%
- Equity multiple
- 0.76×
- Total profit
- $-68,294
- Equity at exit
- $148,954
- IRR
- 3.1%
- Equity multiple
- 1.22×
- Total profit
- $62,092
- Equity at exit
- $86,375
Cash invested: $279,720 (down + closing). Projections, not guarantees.
Landlord ↔ Tenant lean methodology
- Overall (STATE)
- 15 Strongly Tenant-Friendly
- State New York
- 15 Strongly Tenant-Friendly · D+10
- County
- — inherits STATE
- City
- — inherits STATE
ZIP-level market 10804
- Active inventory
- 116
- Price-to-rent
- 7.5×
Monthly cashflow live
- Estimated rent
- $11,030 high interval (Pro) →
- Mortgage (P&I)
- −$5,239
- Tax from tax record
- −$1,539 /mo · $18,471/yr
- Insurance
- −$416
- Flood insurance flood zone
- −$56 /mo · $666/yr
- HOA
- −$0
- Vacancy / Maint / Mgmt
- −$2,316
- Net cashflow
- $1,463
Break-even live
UW: 25.0% down · 7.5% · 30yr · 1.5% tax · 5.0% vac · 8.0% maint · 8.0% mgmt
Financing live
Cash to close
- Down payment
- $249,750
- Closing costs
- $29,970
- Reserves months
- —
- Total cash needed
- —
Loan-product check · same deal, 3 products live
Conventional
25% down · 7.5% · 30yr
- Down + closing
- —
- Monthly P&I
- —
- Monthly cashflow
- —
- DSCR
- —
- Eligible?
- —
Personal DTI + credit; lowest rate.
DSCR
20% down · 8.5% · 30yr
- Down + closing
- —
- Monthly P&I
- —
- Monthly cashflow
- —
- DSCR
- —
- Eligible?
- —
No personal income docs; deal must DSCR.
Hard money
10% down · 12.0% · 12mo
- Down + closing
- —
- Monthly P&I
- —
- Monthly cashflow
- —
- DSCR
- —
- Eligible?
- —
Short-term bridge; refi at stabilization.
Rent comps 7 comps
| Address | Beds | Baths | Sqft | Rent | $/sqft | DOM | Units | Dist |
|---|---|---|---|---|---|---|---|---|
| 75 Lord Kitchener Rd New Rochelle, NY | 4.0 | 4.5 | 3032 | $10,000 | $3.30 | 4d | 1 | 0.37mi |
| 58 Marion Dr New Rochelle, NY | 4.0 | 3.0 | 3246 | $11,000 | $3.39 | 1d | 1 | 0.65mi |
| 19 Bonnie Way Larchmont, NY | 4.0 | 3.0 | 2700 | $14,000 | $5.19 | 12d | 1 | 0.97mi |
| 177 Puritan Dr Scarsdale, NY | 5.0 | 4.0 | 4278 | $11,000 | $2.57 | 1d | 1 | 1.33mi |
| 16 Bon Air Ave New Rochelle, NY | 4.0 | 3.5 | 3809 | $9,500 | $2.49 | 43d | 1 | 1.35mi |
| 372 Heathcote Rd Scarsdale, NY | 4.0 | 3.0 | 2826 | $12,000 | $4.25 | 1d | 1 | 1.42mi |
| 6 Hidden Green Ln Larchmont, NY | 4.0 | 3.5 | 3844 | $12,000 | $3.12 | 1d | 1 | 1.48mi |
Listing history 9 events
-
2026-06-18days on market $999,000 Active 9 DOM
-
2026-06-17days on market $999,000 Active 8 DOM
-
2026-06-16days on market $999,000 Active 7 DOM
-
2026-06-15days on market $999,000 Active 6 DOM
-
2026-06-13status $999,000 Active 4 DOM
-
2026-06-09days on market $999,000 Coming Soon 4 DOM
-
2026-06-08days on market $999,000 Coming Soon 3 DOM
-
2026-06-07remarks 699-char remark
-
2026-06-07$999,000 Coming Soon 2 DOM
ⓘ Source: listings_history table (triggers on properties + properties_extension) + one-shot
backfill from property_details.listing_events for pre-trigger history.
Tax reassessment forecast NY · Partial reset (capped growth)
- Current annual tax
- $18,471 · $1,539/mo
- Projected year-2 tax
- $18,471 · $1,539/mo
- Expected delta
- $0/yr ($0/mo · 0.0%)
ⓘ Screening estimate from a state-policy table — verify with the county assessor before closing.
Climate risk First Street
- Flood 9/10 Extreme FEMA zone X (unshaded) · 98% chance over 30 yrs
- Wildfire 1/10 Low
- Heat 6/10 Major 7 d/yr ≥98°F today · 16 d/yr by 30 yrs out
- Wind 6/10 Major 27% chance of damaging wind over 30 yrs
- Air quality 4/10 Moderate 3 unhealthy d/yr today · 5 by 30 yrs out
Nearby sold comps map
Loading sold comps map…
Walkable amenities ~0.75 mi
Loading nearby amenities…
Taxation est. · year 1
- Rental income
- $132,354
- − Mortgage interest
- −$55,960
- − Property taxes
- −$18,471
- − Insurance
- −$5,662
- − Repairs & maintenance
- −$10,588
- − Management
- −$10,588
- − Depreciation
- −$29,062
- Taxable income
- $2,024
- Est. tax owed @ 24.0%
- −$486
- After-tax cash flow
- $17,076/yr
For passive investors: Depreciation is non-cash, so a rental often shows a tax loss while cash-flowing — sheltering income. Rental losses are passive: they offset passive income freely, and up to $25,000/yr can offset ordinary (W-2) income if you actively participate and your MAGI is under $100k (phasing out to $0 by $150k); unused losses carry forward. On sale, claimed depreciation is recaptured at up to 25%, and gains may owe capital-gains tax (a 1031 exchange can defer both). Figures are a year-1 estimate at your 24.0% rate — not tax advice; consult a CPA.
Schools (NCES district)
- District
- New Rochelle City School District
- NCES district ID
- 3620490
- Math proficiency
- 63% ▲ 3.00%
- Reading proficiency
- 66% ▲ 9.00%
- Median HH income
- $69,165
- Composite
- 56.63/100
- National rank
- #1139
- State rank
- #171 of 590 in NY
Livability — New Rochelle
- Score
- 69/100
- State rank
- #487
- US rank
- #8572
Category grades
Schools grade is shown separately in the Schools card above.
Census & demographics
- Census place
- New Rochelle, NY
- City population
- 63,657
- Population (ZIP)
- 15,228
Population outlook (Westchester County) Hauer SSP2
- Today (2025)
- 1,028,035 people
- By 2030
- 1,051,636 · +2.3%
- By 2040
- 1,098,520 · +6.9%
- By 2050
- 1,136,044 · +10.5%
- By 2075
- 1,196,925 · +16.4%
- By 2100
- 1,175,147 · +14.3%
Race, ethnicity, and origin ACS 2023
- Neighborhood character
- Predominantly White (73%)
- Race & ethnicity
- White 73% Black 11% Hispanic / Latino 10% Two or more races 5% Asian 3%
- Hispanic origin (detail)
- Mexican 1% Puerto Rican 2% Dominican 2%
- Common ancestry
- Scotch-Irish 4% Romanian 3% Italian 2%
- Foreign-born
- 15% · Canada, Dominican Republic, Jamaica
- Languages at home
- 80% English-only · Spanish 6% Russian/Polish/Slavic 3% Other Indo-European 3%
Political lean MEDSL · Westchester
- 2024 margin
- Strong D (+26.3) · D 63.1% · R 36.9%
- 2008→2024 swing
- -1.3pp toward R · 2008: 27.6pp · 2024: 26.3pp
- All cycles
- 2024: D+26.3 2020: D+36.3 2016: D+32.8 2012: D+22.2 2008: D+27.6
Not yet ingested
- Civics
- —
Market trends
- HPI YoY
- ▼ -819.58%
- Current HPI
- 280.9571
- Rent YoY
- —
- Metro
- —
- State GDP YoY
- ▲ 2.60%
- F500 in state
- 92
Industry mix (Fortune 500 HQ in NY)
| Industry | F500 HQs | Revenue |
|---|---|---|
| Financial Services | 10 | $950B |
|
||
| Consumer Goods | 9 | $162B |
|
||
| Insurance | 4 | $225B |
|
||
| Telecommunications | 2 | $144B |
|
||
| Pharmaceuticals | 2 | $112B |
|
||
| Media / Entertainment | 2 | $69B |
|
||
Price history
+233.0% since first listed9 events — show timeline
- 2026-06-05 Coming Soon $999,000 OneKey® MLS as Distributed by MLS Grid
- 2022-07-02 Listing Removed — OneKey® MLS as Distributed by MLS Grid
- 2022-03-27 Price Changed $999,000 OneKey® MLS as Distributed by MLS Grid
- 2022-03-02 Listed $1,100,000 OneKey® MLS as Distributed by MLS Grid
- 2013-02-01 Delisted — HGMLS
- 2013-01-31 Listing Removed — OneKey® MLS as Distributed by MLS Grid
- 2012-07-31 Listed — HGMLS
- 2012-07-31 Listed $549,000 OneKey® MLS as Distributed by MLS Grid
- 1999-11-05 Sold (Public Records) $300,000 Public Records
Property tax history
-2.1%/yrLatest (2025): $18,471 · -18.5% YoY. Source: county tax records.
Cash-flow waterfall
monthlySold comps — $/sqft
last 12 mo · ≤1 miLoading sold comps…