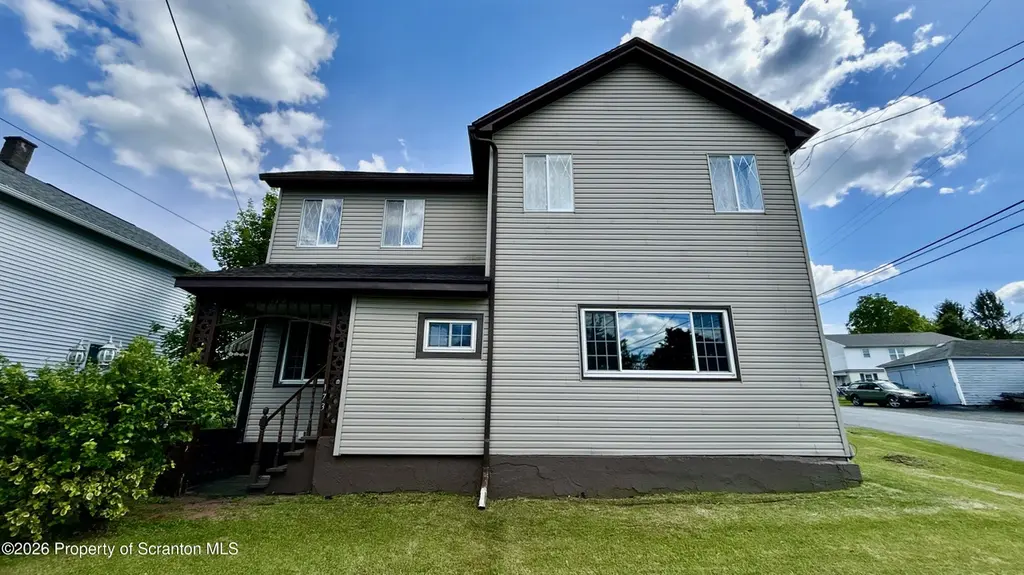
173 Dundaff St · Forest City, PA
Flood risk 1/10 · Minimal
- FEMA flood zone
- X (unshaded)
- Chance of flooding over 30 yrs
- 0.0%
- Est. flood insurance / yr
- $473 – $860
Fire risk 1/10 · Minimal
- Est. fire insurance / yr
- $511 – $949
Heat risk 2/10 · Minimal
- Hot days now (above 87°F)
- 7 days/yr
- Hot days in 30 yrs
- 17 days/yr
Wind risk 2/10 · Minimal
- Chance of severe wind over 30 yrs
- 2.0%
Air-quality risk 2/10 · Minimal
- Unhealthy air days now
- 0 days/yr
- Unhealthy air days in 30 yrs
- 1 days/yr
Risk factors via First Street. Map © Google.
Why this score? — see what drove the C- grade
The composite is a weighted blend of 9 inputs, each scored 0–100. Each bar is that input's sub-score; the figure is the points it added to the 100-point composite (weight × sub-score).
- Cash flow +14.3/30.0
- Appreciation +10.0/10.0
- ARV discount +5.7/15.0
- DSCR +4.4/10.0
- 1% rule +3.8/10.0
- Schools +3.6/10.0
- Livability +3.3/5.0
- Rent growth +2.5/5.0
- Condition / age +2.5/5.0
$159,000
🖨 Deal sheet 📄 Offer letter ✓ Due diligence
Listing remarks
Welcome to this well-maintained home ideally situated on a desirable corner lot with a private driveway and plenty of off-street parking. Enjoy the convenience of being within walking distance of local schools, downtown shops, restaurants, and everyday amenities. Outdoor enthusiasts will appreciate the home's prime location just steps from Kennedy Park and the Rails to Trails system, providing easy access for walking, biking, ATV riding, and snowmobiling. Whether you're looking for outdoor adventure or a peaceful evening stroll, this location offers something for everyone. Inside, you'll find a bright and spacious living room filled with natural light, a generous dining area featuring a lar
Key facts
- Private driveway
- Off-street parking
- Corner lot
Tags
Property features AI
Finance
- Other: Living area reported as 1,576; Lot features include city street frontage and asphalt road surface
Exterior
- Parking: Driveway; Off-street parking
- Utilities: Public water; Public sewer; Electricity connected (200 amps or less)
- Home design: Single-family residence; Two levels; Built in 1900; Stone foundation; Vinyl siding; Fiberglass roof; Corner lot with cleared front yard
- Construction: Vinyl siding construction; Stone foundation; Fiberglass roof; Year built: 1900
- Exterior features: Covered patio; Storage
Interior
- Kitchen: Dishwasher; Electric oven; Refrigerator
- Bedrooms: 2 bedrooms (one approx. 13 x 17, one approx. 13 x 13.5)
- Flooring: Carpet; Laminate; Hardwood
- Bathrooms: 2 bathrooms total (1 full, 1 half)
- Heating & cooling: Oil heating; Ceiling fan cooling
- Interior features: Ceiling fans; Storage; Crawl opening to attic; Unfinished basement with dirt floor and sump pump
- Laundry & utility: Dedicated laundry room with washer and dryer
Neighborhood map
What this means for you Summary
Snapshot
- This is a 2-bed/1.5-bath single-family listed at $159k.
Deal economics
- At list price, monthly cash flow is $30 ($356/yr) — positive.
- The deal already cash-flows at list — no discount required.
- To meet the 1% rule (rent ≥ 1% of price), the offer needs to be $140k (11.9% below list).
- Recommended offer: $140k (11.9% below list) — sets the bar for 1% rule.
Location & tenants
- Location reads 66/100 on livability (#1,019 in PA) — a middle-class / working-renter tenant base. Strengths: crime A+, cost of living A+, housing A+; Watch: amenities F, commute F, employment D-.
- Forest City Regional SD (suburban): math 34% / reading 51% proficiency, ranked #308 of 539 in PA (top 57%) — families likely to look elsewhere, expect single-tenant / working-renter base with shorter leases.
- Market conditions: 53 active listings in the ZIP; 1 comparable units currently listed for rent nearby; 80 units permitted in Susquehanna County in 2024 (5 in 5+ unit buildings).
Forward outlook
- In year one you build about $17k of equity ($1k loan paydown + $16k appreciation (10.0% local appreciation)).
- Susquehanna County population projected at -30% by 2050 — secular population decline; favor cash flow + early exit over multi-decade hold.
- At projected returns (10.0% appreciation + 3.0% rent growth), your $45k cash investment doubles in ~3 years — after that, you're playing with house money.
- By year 3, paydown + projected appreciation supports a ~$43k cash-out refi (75% LTV) — recoverable capital for the next deal without selling this one.
Negotiation context
- Only 14 days on market — expect competitive offers; lowballing is unlikely to land.
- 2 sale attempts with the ask held roughly flat each time — persistent listings suggest the price (not the market) is what's stuck; bring a comps-based counter.
Risks & watch-outs
- Watch-outs: built in 1900 — expect roof / HVAC / electrical / plumbing capex.
Questions for the listing agent
- Built in 1900 — when were the roof, HVAC, electrical panel, plumbing, and water heater last replaced?
- Is there a deadline driving the sale (1031 exchange, divorce, estate, relocation)? That informs how much negotiation room exists.
- What's the average days-on-market for RENTAL listings here right now (not sales)? A rising rental-DOM trend means longer vacancies and softer asking-rent achievability than the comps imply.
- What's the recent tenant-quality profile in this submarket — average credit score on applications, eviction rate, late-payment / NSF rate, and stable-employment percentage? A property-management company in the area should have these aggregated.
- How much new for-sale + rental construction is in the pipeline within 1–3 miles? Heavy new supply typically softens prices + rents 12–24 months out; constrained supply supports both.
Investment metrics
- 1% rule
- 0.88% ✗
- Cap rate
- 6.52%
- Cash-on-cash
- 0.80%
- DSCR
- 1.04
- GRM
- 9.5
CMA / ARV
- ARV (on-the-fly)
- $152,872
- Comps found
- 5
Show comp detail 5 sales within ~0.75 mi
| Address | Dist | Beds/Ba | Sqft | Sold | Price | $/sf | Match |
|---|---|---|---|---|---|---|---|
| 435 Lackawanna St | 0.12mi | 3/1.0 (+1) | 1,346 (-15%) | 8mo | $120,000 | $89 | 56 |
| 324 Lackawanna Street St | 0.27mi | 3/2.0 (+1) | 1,625 (+3%) | 23mo | $239,000 | $147 | 56 |
| 301 S Main St | 0.44mi | 3/2.5 (+1) | 1,485 (-6%) | 10mo | $259,000 | $174 | 52 |
| 1029 Upper Main St | 0.52mi | 3/1.0 (+1) | 1,500 (-5%) | 12mo | $95,000 | $63 | 50 |
| 1306 Main St | 0.72mi | 3/2.0 (+1) | 1,676 (+6%) | 15mo | $162,000 | $97 | 36 |
Match score weights: distance 35% · size 25% · config 20% · recency 20%. Top-matched comps best support the ARV.
Projected returns pro-forma
10.0% appreciation · 3.0% rent growth · sell at horizon
- IRR
- 24.9%
- Equity multiple
- 2.99×
- Total profit
- $88,494
- Equity at exit
- $143,240
- IRR
- 21.9%
- Equity multiple
- 6.82×
- Total profit
- $259,128
- Equity at exit
- $308,902
Cash invested: $44,520 (down + closing). Projections, not guarantees.
Landlord ↔ Tenant lean methodology
- Overall (STATE)
- 62 Landlord-Friendly
- State Pennsylvania
- 62 Landlord-Friendly · EVEN
- County
- — inherits STATE
- City
- — inherits STATE
ZIP-level market 18421
- Home prices YoY
- 20.9%
- Active inventory
- 53
- Price-to-rent
- 9.5×
Monthly cashflow live
- Estimated rent
- $1,400 medium interval (Pro) →
- Mortgage (P&I)
- −$834
- Tax from tax record
- −$176 /mo · $2,115/yr
- Insurance
- −$66
- HOA
- −$0
- Vacancy / Maint / Mgmt
- −$294
- Net cashflow
- $30
Break-even live
UW: 25.0% down · 7.5% · 30yr · 1.5% tax · 5.0% vac · 8.0% maint · 8.0% mgmt
Financing live
Cash to close
- Down payment
- $39,750
- Closing costs
- $4,770
- Reserves months
- —
- Total cash needed
- —
Loan-product check · same deal, 3 products live
Conventional
25% down · 7.5% · 30yr
- Down + closing
- —
- Monthly P&I
- —
- Monthly cashflow
- —
- DSCR
- —
- Eligible?
- —
Personal DTI + credit; lowest rate.
DSCR
20% down · 8.5% · 30yr
- Down + closing
- —
- Monthly P&I
- —
- Monthly cashflow
- —
- DSCR
- —
- Eligible?
- —
No personal income docs; deal must DSCR.
Hard money
10% down · 12.0% · 12mo
- Down + closing
- —
- Monthly P&I
- —
- Monthly cashflow
- —
- DSCR
- —
- Eligible?
- —
Short-term bridge; refi at stabilization.
Rent comps 1 comps
| Address | Beds | Baths | Sqft | Rent | $/sqft | DOM | Units | Dist |
|---|---|---|---|---|---|---|---|---|
| 139 Dundaff St Unit 1 Forest City, PA | 2.0 | 2.0 | 1218 | $1,400 | $1.15 | 13d | 1 | 0.11mi |
Listing history 11 events
-
2026-06-18days on market $159,000 Active 14 DOM
-
2026-06-17days on market $159,000 Active 13 DOM
-
2026-06-16days on market $159,000 Active 12 DOM
-
2026-06-15days on market $159,000 Active 11 DOM
-
2026-06-14days on market $159,000 Active 9 DOM
-
2026-06-13days on market $159,000 Active 8 DOM
-
2026-06-10days on market $159,000 Active 6 DOM
-
2026-06-09days on market $159,000 Active 5 DOM
-
2026-06-08days on market $159,000 Active 4 DOM
-
2026-06-07remarks 699-char remark
-
2026-06-07$159,000 Active 3 DOM
ⓘ Source: listings_history table (triggers on properties + properties_extension) + one-shot
backfill from property_details.listing_events for pre-trigger history.
Tax reassessment forecast PA · Partial reset (capped growth)
- Current annual tax
- $2,115 · $176/mo
- Projected year-2 tax
- $2,314 · $193/mo
- Expected delta
- +$199/yr (+$17/mo · 9.4%)
ⓘ Screening estimate from a state-policy table — verify with the county assessor before closing.
Climate risk First Street
- Flood 1/10 Low FEMA zone X (unshaded) · 0% chance over 30 yrs
- Wildfire 1/10 Low
- Heat 2/10 Low 7 d/yr ≥87°F today · 17 d/yr by 30 yrs out
- Wind 2/10 Low 2% chance of damaging wind over 30 yrs
- Air quality 2/10 Low 0 unhealthy d/yr today · 1 by 30 yrs out
Nearby sold comps map
Loading sold comps map…
Walkable amenities ~0.75 mi
Loading nearby amenities…
Taxation est. · year 1
- Rental income
- $16,800
- − Mortgage interest
- −$8,906
- − Property taxes
- −$2,115
- − Insurance
- −$795
- − Repairs & maintenance
- −$1,344
- − Management
- −$1,344
- − Depreciation
- −$4,625
- Taxable loss
- −$2,330
- Est. tax savings @ 24.0%
- +$559
- After-tax cash flow
- $916/yr
For passive investors: Depreciation is non-cash, so a rental often shows a tax loss while cash-flowing — sheltering income. Rental losses are passive: they offset passive income freely, and up to $25,000/yr can offset ordinary (W-2) income if you actively participate and your MAGI is under $100k (phasing out to $0 by $150k); unused losses carry forward. On sale, claimed depreciation is recaptured at up to 25%, and gains may owe capital-gains tax (a 1031 exchange can defer both). Figures are a year-1 estimate at your 24.0% rate — not tax advice; consult a CPA.
Schools (NCES district)
- District
- Forest City Regional SD
- NCES district ID
- 4209930
- Math proficiency
- 34% ▼ -17.00%
- Reading proficiency
- 51% ▼ -11.00%
- Median HH income
- $47,744
- Composite
- 36.29/100
- National rank
- #4701
- State rank
- #308 of 539 in PA
Livability — Forest City
- Score
- 66/100
- State rank
- #1019
- US rank
- #11278
Category grades
Schools grade is shown separately in the Schools card above.
Census & demographics
- Census place
- Forest City, PA
- Population (ZIP)
- 4,475
Population outlook (Susquehanna County) Hauer SSP2
- Today (2025)
- 37,552 people
- By 2030
- 35,270 · -6.1%
- By 2040
- 30,663 · -18.3%
- By 2050
- 26,492 · -29.5%
- By 2075
- 19,658 · -47.7%
- By 2100
- 15,179 · -59.6%
Race, ethnicity, and origin ACS 2023
- Neighborhood character
- Predominantly White (93%)
- Race & ethnicity
- White 93% Hispanic / Latino 4% Two or more races 3%
- Common ancestry
- Romanian 11% Italian 3% Scotch-Irish 2%
- Foreign-born
- 3% · Canada, Vietnam
- Languages at home
- 97% English-only · Spanish 1% Vietnamese 1% Russian/Polish/Slavic 1%
Political lean MEDSL · Susquehanna
- 2024 margin
- Solid R (+44.7) · D 27.2% · R 71.9%
- 2008→2024 swing
- -33.0pp toward R · 2008: -11.7pp · 2024: -44.7pp
- All cycles
- 2024: R+44.7 2020: R+41.2 2016: R+42.9 2012: R+21.4 2008: R+11.7
Not yet ingested
- Civics
- —
Market trends
- HPI YoY
- ▲ 48.80%
- Current HPI
- 282.5624
- Rent YoY
- —
- Metro
- —
- State GDP YoY
- ▲ 1.68%
- F500 in state
- 34
Industry mix (Fortune 500 HQ in PA)
| Industry | F500 HQs | Revenue |
|---|---|---|
| Healthcare | 2 | $309B |
|
||
| Insurance | 2 | $27B |
|
||
| Telecommunications / Media | 1 | $124B |
|
||
| Industrial Distribution | 1 | $22B |
|
||
| Financial Services | 1 | $20B |
|
||
| Chemicals / Materials | 1 | $18B |
|
||
Price history
-9.1% since first listed3 events — show timeline
- 2026-06-03 Listed $159,000 GSBR as distributed by MLS GRID
- 2026-01-09 Price Changed $169,900 PWMLS
- 2025-10-30 Listed $174,900 PWMLS
Property tax history
+2.3%/yrLatest (2026): $2,115 · +4.0% YoY. Source: county tax records.
Cash-flow waterfall
monthlySold comps — $/sqft
last 12 mo · ≤1 miLoading sold comps…