 🏷️ Likely Rental
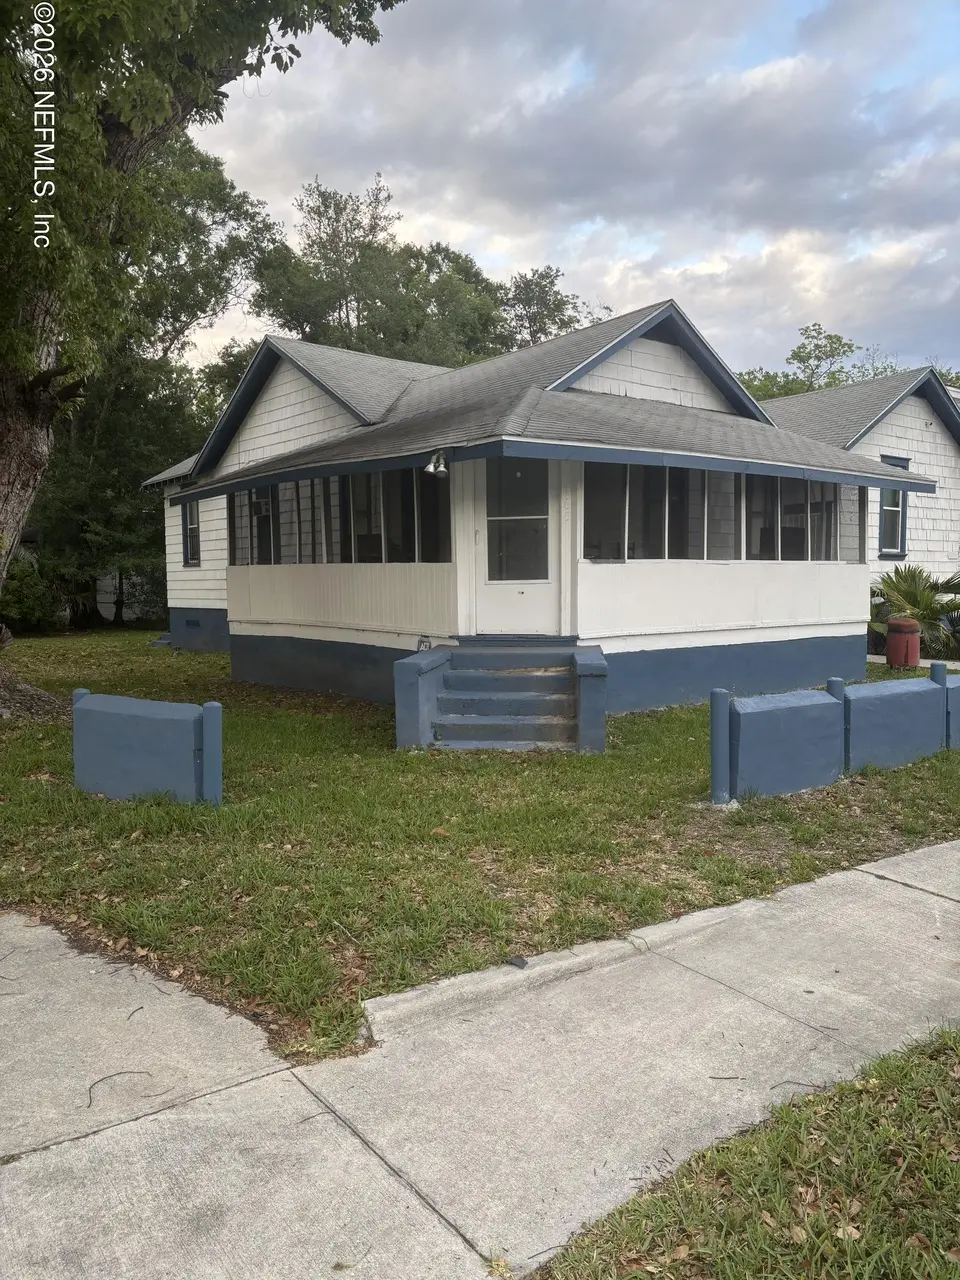
3165 Broadway Ave · Jacksonville, FL
Flood risk 1/10 · Minimal
- FEMA flood zone
- X (unshaded)
- Chance of flooding over 30 yrs
- 0.0%
- Est. flood insurance / yr
- $507 – $1,088
Fire risk 1/10 · Minimal
- Est. fire insurance / yr
- $947 – $1,759
Heat risk 9/10 · Severe
- Hot days now (above 107°F)
- 7 days/yr
- Hot days in 30 yrs
- 18 days/yr
Wind risk 9/10 · Severe
- Chance of severe wind over 30 yrs
- 99.0%
Air-quality risk 5/10 · Moderate
- Unhealthy air days now
- 7 days/yr
- Unhealthy air days in 30 yrs
- 7 days/yr
Risk factors via First Street. Map © Google.
Why this score? — see what drove the B grade
The composite is a weighted blend of 9 inputs, each scored 0–100. Each bar is that input's sub-score; the figure is the points it added to the 100-point composite (weight × sub-score).
- Cash flow +24.5/30.0
- ARV discount +15.0/15.0
- DSCR +7.9/10.0
- Appreciation +6.7/10.0
- 1% rule +5.0/10.0
- Livability +4.2/5.0
- Schools +3.9/10.0
- Rent growth +2.9/5.0
- Condition / age +2.5/5.0
$139,999
🖨 Deal sheet 📄 Offer letter ✓ Due diligence
Listing remarks MLS
3BR/2BA on corner lot. Investors Dream! House was previously occupied at $750/month. Come see this home that sits on a large corner lot. It features a wrap around porch, Berber carpet & central A/C. Ready for your next tennant to move in!
Key facts
- 8,276 sq ft lot
- Built 1914
- Listed 48 days
Property features AI
Finance
- HOA & community: Not a senior community
Exterior
- Parking: Other parking
- Utilities: Electricity connected
- Home design: Single-family residence; Used for residential single-family
- Exterior features: Corner lot
Interior
- Kitchen: Electric range; Microwave; Refrigerator
- Bedrooms: Three bedrooms (main level)
- Bathrooms: Two full bathrooms
- Heating & cooling: Central heating; Central air conditioning
- Interior features: One additional room (main level)
Neighborhood map
What this means for you Summary
Snapshot
- This is a 3-bed/2.0-bath single-family listed at $140k.
Deal economics
- At list price, monthly cash flow is $287 ($3k/yr) — positive.
- The deal already cash-flows at list — no discount required.
- Meets the 1% rule at list price ($1k rent vs $140k).
- Recommended offer: $136k (3.0% below list) — sets the bar for market timing.
- Cap rate 8.7% vs local median 4.0% in Jacksonville — top-decile yield for the area; either an underpriced asset or a hidden risk that comps aren't pricing in. Stress-test before assuming the spread holds.
Location & tenants
- Location reads 83/100 on livability (#50 in FL, #911 nationally) — a professional / high-income tenant draw. Strengths: amenities A+, commute A+, housing A+.
- Duval (urban): math 46% / reading 45% proficiency, ranked #48 of 73 in FL (top 66%) — families likely to look elsewhere, expect single-tenant / working-renter base with shorter leases.
- Market conditions: Rents rising (+1.7%/yr); 172 active listings in the ZIP; 40 comparable units currently listed for rent nearby; rentals at typical pace (median 18d on market — plan ~3-4 weeks tenant-placement turnaround); lower-income renter base — watch delinquency; 6,503 units permitted in Duval County in 2024 (1,131 in 5+ unit buildings).
Forward outlook
- In year one you build about $6k of equity ($968 loan paydown + $5k appreciation (3.4% local appreciation)).
- Duval County population projected at +19% by 2050 — long-run rental-demand tailwind backs the buy-and-hold thesis.
- At projected returns (3.4% appreciation + 1.7% rent growth), your $39k cash investment doubles in ~4 years — after that, you're playing with house money.
- By year 6, paydown + projected appreciation supports a ~$30k cash-out refi (75% LTV) — recoverable capital for the next deal without selling this one.
Negotiation context
- It's been on market 48 days — a 3% lower offer ($136k) is reasonable based on typical stale-listing flexibility.
- 9 sale attempts since 24y ago; this cycle's ask has dropped $10k (7%) from the opening price — seller is motivated, your offer sets the floor, not the list.
- Current owner paid $80k; list at $140k implies a 75% gain — meaningful room to come down on a strong offer.
Risks & watch-outs
- Watch-outs: built in 1914 — expect roof / HVAC / electrical / plumbing capex.
- Climate carrying-cost: severe wind risk, 99% chance of damaging wind over 30y; extreme-heat days projected 7→18/yr by 2055 (HVAC capex compounding) — expect insurance premiums to compound above CPI over the hold.
Questions for the listing agent
- It's been on market 48 days. Have you received any prior offers? Is the seller open to a 3% concession, seller financing, or rate buy-down credit?
- Built in 1914 — when were the roof, HVAC, electrical panel, plumbing, and water heater last replaced?
- Is there a deadline driving the sale (1031 exchange, divorce, estate, relocation)? That informs how much negotiation room exists.
- Schools are B-rated — typically a magnet for longer-tenancy family renters. What's the average tenant stay here, and is there a school-zone premium baked into asking?
- What's the average days-on-market for RENTAL listings here right now (not sales)? A rising rental-DOM trend means longer vacancies and softer asking-rent achievability than the comps imply.
- What's the recent tenant-quality profile in this submarket — average credit score on applications, eviction rate, late-payment / NSF rate, and stable-employment percentage? A property-management company in the area should have these aggregated.
- How much new for-sale + rental construction is in the pipeline within 1–3 miles? Heavy new supply typically softens prices + rents 12–24 months out; constrained supply supports both.
Investment metrics
- 1% rule
- 1.00% ✓
- Cap rate
- 8.75%
- Cash-on-cash
- 8.77%
- DSCR
- 1.39
- GRM
- 8.3
CMA / ARV
- ARV (on-the-fly)
- $189,426
- Comps found
- 12
Show comp detail 12 sales within ~0.75 mi
| Address | Dist | Beds/Ba | Sqft | Sold | Price | $/sf | Match |
|---|---|---|---|---|---|---|---|
| 3055 Lowell Ave | 0.17mi | 4/2.0 (+1) | 1,484 (+3%) | 4mo | $135,000 | $91 | 79 |
| 3151 Sunnybrook Ct | 0.18mi | 4/2.0 (+1) | 1,516 (+5%) | 4mo | $199,000 | $131 | 75 |
| 718 Melson Ave | 0.11mi | 3/2.0 | 1,287 (-11%) | 6mo | $200,000 | $155 | 71 |
| 3518 Broadway Ave | 0.42mi | 4/2.0 (+1) | 1,471 (+2%) | 4mo | $200,000 | $136 | 69 |
| 2908 Broadway Ave | 0.33mi | 3/2.5 | 1,268 (-12%) | 1mo | $185,000 | $146 | 62 |
| 1331 Dena St | 0.71mi | 2/2.0 (-1) | 1,440 (-0%) | 1mo | $50,125 | $35 | 61 |
| 3516 Deer St N | 0.59mi | 4/2.0 (+1) | 1,480 (+2%) | 3mo | $122,000 | $82 | 61 |
| 3058 2nd St Cir | 0.55mi | 3/2.0 | 1,334 (-8%) | 5mo | $160,000 | $120 | 58 |
| 4640 Hunt St | 0.72mi | 4/2.0 (+1) | 1,377 (-5%) | 8mo | $240,000 | $174 | 47 |
| 3569 Fitzgerald St | 0.63mi | 3/2.0 | 1,253 (-13%) | 7mo | $220,000 | $176 | 43 |
| 5140 Columbus Ave | 0.72mi | 3/1.0 | 1,314 (-9%) | 8mo | $165,000 | $126 | 40 |
| 5125 Abel Ln | 0.67mi | 4/2.0 (+1) | 1,264 (-13%) | 7mo | $165,000 | $131 | 37 |
Match score weights: distance 35% · size 25% · config 20% · recency 20%. Top-matched comps best support the ARV.
Projected returns pro-forma
3.41% appreciation · 1.7% rent growth · sell at horizon
- IRR
- 16.0%
- Equity multiple
- 1.93×
- Total profit
- $36,319
- Equity at exit
- $66,229
- IRR
- 16.7%
- Equity multiple
- 3.49×
- Total profit
- $97,508
- Equity at exit
- $104,693
Cash invested: $39,200 (down + closing). Projections, not guarantees.
Landlord ↔ Tenant lean methodology
- Overall (STATE)
- 87 Strongly Landlord-Friendly
- State Florida
- 87 Strongly Landlord-Friendly · R+3
- County
- — inherits STATE
- City
- — inherits STATE
ZIP-level market 32254
- Home prices YoY
- 1.2%
- Rents YoY
- 1.7%
- Active inventory
- 172
- Price-to-rent
- 8.3×
Monthly cashflow live
- Estimated rent
- $1,406 high interval (Pro) →
- Mortgage (P&I)
- −$734
- Tax from tax record
- −$32 /mo · $384/yr
- Insurance
- −$58
- HOA
- −$0
- Vacancy / Maint / Mgmt
- −$295
- Net cashflow
- $287
Break-even live
UW: 25.0% down · 7.5% · 30yr · 1.5% tax · 5.0% vac · 8.0% maint · 8.0% mgmt
Financing live
Cash to close
- Down payment
- $35,000
- Closing costs
- $4,200
- Reserves months
- —
- Total cash needed
- —
Loan-product check · same deal, 3 products live
Conventional
25% down · 7.5% · 30yr
- Down + closing
- —
- Monthly P&I
- —
- Monthly cashflow
- —
- DSCR
- —
- Eligible?
- —
Personal DTI + credit; lowest rate.
DSCR
20% down · 8.5% · 30yr
- Down + closing
- —
- Monthly P&I
- —
- Monthly cashflow
- —
- DSCR
- —
- Eligible?
- —
No personal income docs; deal must DSCR.
Hard money
10% down · 12.0% · 12mo
- Down + closing
- —
- Monthly P&I
- —
- Monthly cashflow
- —
- DSCR
- —
- Eligible?
- —
Short-term bridge; refi at stabilization.
Rent comps 40 comps
| Address | Beds | Baths | Sqft | Rent | $/sqft | DOM | Units | Dist |
|---|---|---|---|---|---|---|---|---|
| 3303 Broadway Ave Jacksonville, FL | 3.0 | 2.0 | 1072 | $1,550 | $1.45 | 4d | 1 | 0.17mi |
| 3012 Imperial St Jacksonville, FL | 3.0 | 1.0 | 1089 | $1,395 | $1.28 | 24d | 1 | 0.20mi |
| 3305 Sunnybrook Ave N Jacksonville, FL | 2.0 | 1.0 | 1012 | $1,021 | $1.01 | 24d | 1 | 0.21mi |
| 3362 Lowell Ave Jacksonville, FL | 3.0 | 2.0 | 1682 | $1,400 | $0.83 | 7d | 1 | 0.24mi |
| 3350 Sunnybrook Ave N Jacksonville, FL | 2.0 | 1.0 | 900 | $1,095 | $1.22 | 24d | 1 | 0.27mi |
| 3368 Columbus Ave Jacksonville, FL | 2.0 | 1.0 | 955 | $1,300 | $1.36 | 4d | 1 | 0.28mi |
| 1021 Woodstock Ave Jacksonville, FL | 3.0 | 2.0 | 1012 | $1,495 | $1.48 | 24d | 1 | 0.32mi |
| 1021 Woodstock Ave Jacksonville, FL | 3.0 | 2.0 | 1012 | $1,495 | $1.48 | 7d | 1 | 0.32mi |
| 3450 Lowell Ave Jacksonville, FL | 3.0 | 2.0 | 1209 | $1,578 | $1.31 | 24d | 1 | 0.39mi |
| 1037 Detroit St Jacksonville, FL | 3.0 | 2.0 | 912 | $1,250 | $1.37 | 2d | 1 | 0.39mi |
| 3034 Detroit Cir E Jacksonville, FL | 3.0 | 2.0 | 1300 | $1,399 | $1.08 | 24d | 1 | 0.45mi |
| 912 Huron St Jacksonville, FL | 2.0 | 1.0 | 900 | $1,100 | $1.22 | 14d | 1 | 0.48mi |
| 3055 2nd Street Cir Jacksonville, FL | 3.0 | 1.5 | 1050 | $1,340 | $1.28 | 17d | 1 | 0.57mi |
| 1305 Melson Ave Jacksonville, FL | 3.0 | 2.0 | 1224 | $1,399 | $1.14 | 20d | 1 | 0.61mi |
| 3688 Dillon St Jacksonville, FL | 3.0 | 2.0 | 1230 | $1,421 | $1.16 | 24d | 1 | 0.61mi |
| 841 Ontario St Jacksonville, FL | 2.0 | 1.0 | 1000 | $1,285 | $1.28 | 24d | 1 | 0.62mi |
| 1227 Dena St Jacksonville, FL | 3.0 | 1.0 | 1033 | $1,325 | $1.28 | 24d | 1 | 0.63mi |
| 3515 Dignan St Jacksonville, FL | 3.0 | 1.0 | 915 | $1,036 | $1.13 | 3d | 1 | 0.72mi |
| 5148 Cain Ln Jacksonville, FL | 3.0 | 1.0 | 1104 | $1,306 | $1.18 | 21d | 1 | 0.73mi |
| 3352 Dillon St Jacksonville, FL | 3.0 | 2.0 | 1229 | $1,372 | $1.12 | 24d | 1 | 0.74mi |
| 2965 Sunset St Jacksonville, FL | 3.0 | 1.5 | 1056 | $1,375 | $1.30 | 7d | 1 | 0.75mi |
| 2965 Sunset St Jacksonville, FL | 3.0 | 2.0 | 1056 | $1,375 | $1.30 | 4d | 1 | 0.75mi |
| 3318 Dignan St Jacksonville, FL | 3.0 | 2.0 | 960 | $1,200 | $1.25 | 24d | 1 | 0.81mi |
| 2902 W 5th St Jacksonville, FL | 3.0 | 2.0 | 1379 | $1,050 | $0.76 | 7d | 1 | 0.82mi |
| 2587 Orchard St Jacksonville, FL | 2.0 | 2.0 | 992 | $1,295 | $1.31 | 7d | 1 | 0.82mi |
| 3323 Nolan St Jacksonville, FL | 3.0 | 1.0 | 927 | $1,050 | $1.13 | 2d | 1 | 0.82mi |
| 3550 Edison Ave Jacksonville, FL | 3.0 | 2.0 | 1230 | $1,463 | $1.19 | 4d | 1 | 0.84mi |
| 1612 Alfen St Jacksonville, FL | 3.0 | 1.5 | 945 | $1,113 | $1.18 | 7d | 1 | 0.84mi |
| 3319 Hunt St Jacksonville, FL | 3.0 | 1.0 | 924 | $1,295 | $1.40 | 24d | 1 | 0.86mi |
| 2939 W 6th St Jacksonville, FL | 3.0 | 2.0 | 1269 | $1,225 | $0.97 | 2d | 1 | 0.87mi |
| 3356 Lenox Ave Jacksonville, FL | 2.0 | 1.0 | 899 | $999 | $1.11 | 24d | 1 | 0.92mi |
| 3118 Dignan St Jacksonville, FL | 4.0 | 2.0 | 1103 | $1,148 | $1.04 | 2d | 1 | 0.99mi |
| 3035 Fitzgerald St Jacksonville, FL | 2.0 | 1.0 | 900 | $1,021 | $1.13 | 3d | 1 | 1.03mi |
| 2410 McQuade St Jacksonville, FL | 3.0 | 2.0 | 1307 | $1,425 | $1.09 | 24d | 1 | 1.03mi |
| 691 Herman St Jacksonville, FL | 4.0 | 2.5 | 1641 | $1,669 | $1.02 | 7d | 1 | 1.04mi |
| 3347 Phyllis St Jacksonville, FL | 3.0 | 2.0 | 1145 | $1,395 | $1.22 | 24d | 1 | 1.04mi |
| 676 Bridal Ave Jacksonville, FL | 3.0 | 2.0 | 1008 | $1,450 | $1.44 | 24d | 1 | 1.04mi |
| 3609 Dellwood Ave Jacksonville, FL | 2.0 | 2.0 | 936 | $1,495 | $1.60 | 24d | 1 | 1.15mi |
| 4650 Buxton St Jacksonville, FL | 3.0 | 2.0 | 1620 | $1,925 | $1.19 | 4d | 1 | 1.16mi |
| 3159 Phyllis St Jacksonville, FL | 3.0 | 2.0 | 1209 | $1,561 | $1.29 | 3d | 1 | 1.17mi |
Listing history 37 events
-
2026-06-18days on market $139,999 Active 48 DOM
-
2026-06-17days on market $139,999 Active 47 DOM
-
2026-06-16days on market $139,999 Active 46 DOM
-
2026-06-15days on market $139,999 Active 45 DOM
-
2026-06-13days on market $139,999 Active 42 DOM
-
2026-06-10days on market $139,999 Active 39 DOM
-
2026-06-08days on market $139,999 Active 38 DOM
-
2026-06-07days on market $139,999 Active 37 DOM
-
2026-06-05days on market $139,999 Active 34 DOM
-
2026-06-03days on market $139,999 Active 33 DOM
-
2026-06-02days on market $139,999 Active 32 DOM
-
2026-06-01days on market $139,999 Active 31 DOM
-
2026-05-31days on market $139,999 Active 30 DOM
-
2026-05-01$150,000 Active
-
2006-06-28historical 242-char remark
Show marketing remark (242 chars)
3BR/2BA on corner lot. Investors Dream! House was previously occupied at $750/month. Come see this home that sits on a large corner lot. It features a wrap around porch, Berber carpet & central A/C. Ready for your next tennant to move in!
-
2006-01-09soldstatus $79,900
-
2005-12-29soldstatus $79,900 133-char remark
Show marketing remark (133 chars)
Come see this home that sits on a large corner lot. It features a wrap around porch, Berber carpet and central A/C. Ready to move in.
-
2005-12-23soldstatus $79,900 242-char remark
Show marketing remark (242 chars)
3BR/2BA on corner lot. Investors Dream! House was previously occupied at $750/month. Come see this home that sits on a large corner lot. It features a wrap around porch, Berber carpet & central A/C. Ready for your next tennant to move in!
-
2005-10-27$79,900 242-char remark
Show marketing remark (133 chars)
Come see this home that sits on a large corner lot. It features a wrap around porch, Berber carpet and central A/C. Ready to move in.
-
2005-10-27$79,900 133-char remark
Show marketing remark (133 chars)
Come see this home that sits on a large corner lot. It features a wrap around porch, Berber carpet and central A/C. Ready to move in.
-
2005-10-10historical
-
2005-10-10historical
-
2005-08-25$79,900
-
2005-08-25$79,900
-
2005-02-17historical
-
2004-04-20$87,000
-
2004-04-19historical
-
2004-04-05soldstatus $65,500
-
2004-03-29soldstatus $65,500
-
2004-03-08historical
-
2003-12-09$70,000
-
2003-03-08$67,000
-
2003-03-01historical
-
2002-11-12$65,000
-
2001-08-23soldstatus $18,000
-
1999-12-28soldstatus $73,000
-
1999-06-24soldstatus $42,500
ⓘ Source: listings_history table (triggers on properties + properties_extension) + one-shot
backfill from property_details.listing_events for pre-trigger history.
Tax reassessment forecast FL · Resets to sale price
- Current annual tax
- $384 · $32/mo
- Projected year-2 tax
- $1,162 · $97/mo
- Expected delta
- +$778/yr (+$65/mo · 202.6%)
ⓘ Screening estimate from a state-policy table — verify with the county assessor before closing.
Climate risk First Street
- Flood 1/10 Low FEMA zone X (unshaded) · 0% chance over 30 yrs
- Wildfire 1/10 Low
- Heat 9/10 Extreme 7 d/yr ≥107°F today · 18 d/yr by 30 yrs out
- Wind 9/10 Extreme 99% chance of damaging wind over 30 yrs
- Air quality 5/10 Major 7 unhealthy d/yr today · 7 by 30 yrs out
Nearby sold comps map
Loading sold comps map…
Walkable amenities ~0.75 mi
Loading nearby amenities…
Taxation est. · year 1
- Rental income
- $16,878
- − Mortgage interest
- −$7,842
- − Property taxes
- −$384
- − Insurance
- −$700
- − Repairs & maintenance
- −$1,350
- − Management
- −$1,350
- − Depreciation
- −$4,073
- Taxable income
- $1,178
- Est. tax owed @ 24.0%
- −$283
- After-tax cash flow
- $3,156/yr
For passive investors: Depreciation is non-cash, so a rental often shows a tax loss while cash-flowing — sheltering income. Rental losses are passive: they offset passive income freely, and up to $25,000/yr can offset ordinary (W-2) income if you actively participate and your MAGI is under $100k (phasing out to $0 by $150k); unused losses carry forward. On sale, claimed depreciation is recaptured at up to 25%, and gains may owe capital-gains tax (a 1031 exchange can defer both). Figures are a year-1 estimate at your 24.0% rate — not tax advice; consult a CPA.
Schools (NCES district)
- District
- Duval
- NCES district ID
- 1200480
- Math proficiency
- 46% ▼ -11.00%
- Reading proficiency
- 45% ▼ -4.00%
- Median HH income
- $48,987
- Composite
- 38.97/100
- National rank
- #4076
- State rank
- #48 of 73 in FL
Livability — Jacksonville
- Score
- 83/100
- State rank
- #50
- US rank
- #911
Category grades
Schools grade is shown separately in the Schools card above.
Census & demographics
- Census place
- Jacksonville, FL
- County
- Duval County · 1,015,274 people
- City population
- 979,034
- Metro
- Jacksonville, FL
- Population (ZIP)
- 13,927
- Household income
- $34,953
- Rent vs Own
- Severe rent burden
- 882.0
Population outlook (Duval County) Hauer SSP2
- Today (2025)
- 1,013,010 people
- By 2030
- 1,059,228 · +4.6%
- By 2040
- 1,141,439 · +12.7%
- By 2050
- 1,205,258 · +19.0%
- By 2075
- 1,324,282 · +30.7%
- By 2100
- 1,319,620 · +30.3%
Race, ethnicity, and origin ACS 2023
- Neighborhood character
- Diverse neighborhood (Simpson 0.56)
- Race & ethnicity
- Black 60% White 28% Two or more races 7% Hispanic / Latino 5%
- Hispanic origin (detail)
- Puerto Rican 1%
- Common ancestry
- Slovak 1% Hispanic 1% Lithuanian 1%
- Foreign-born
- 4% · Canada
- Languages at home
- 94% English-only · Spanish 4% French/Haitian/Cajun 2%
Political lean MEDSL · Duval
- 2024 margin
- Toss-up / Even · D 48.7% · R 50.1% · Other 1.2%
- 2008→2024 swing
- +0.4pp no change · 2008: -1.9pp · 2024: -1.5pp
- All cycles
- 2024: R+1.5 2020: D+3.8 2016: R+1.5 2012: R+3.6 2008: R+1.9
Not yet ingested
- Civics
- —
Market trends
- HPI YoY
- ▲ 3.41%
- Current HPI
- 282.2981
- Rent YoY
- ▲ 1.70%
- Metro
- Jacksonville, FL
- State GDP YoY
- ▲ 3.28%
- F500 in state
- 36
Industry mix (Fortune 500 HQ in FL)
| Industry | F500 HQs | Revenue |
|---|---|---|
| Industrial Technology | 2 | $29B |
|
||
| Insurance | 2 | $17B |
|
||
| Retail | 1 | $60B |
|
||
| Technology Distribution | 1 | $58B |
|
||
| Homebuilding | 1 | $35B |
|
||
| Technology Manufacturing | 1 | $35B |
|
||
Price history
+252.9% since first listed24 events — show timeline
- 2026-05-01 Listed $150,000 realMLS
- 2006-06-28 Listing Removed — realMLS
- 2006-01-09 Sold (Public Records) $79,900 Public Records
- 2005-12-29 Sold (MLS) $79,900 realMLS
- 2005-12-23 Sold (MLS) $79,900 realMLS
- 2005-10-27 Listed $79,900 realMLS
- 2005-10-27 Listed $79,900 realMLS
- 2005-10-10 Listing Removed — realMLS
- 2005-10-10 Listing Removed — realMLS
- 2005-08-25 Listed $79,900 realMLS
- 2005-08-25 Listed $79,900 realMLS
- 2005-02-17 Listing Removed — realMLS
- 2004-04-20 Listed $87,000 realMLS
- 2004-04-19 Listing Removed — realMLS
- 2004-04-05 Sold (Public Records) $65,500 Public Records
- 2004-03-29 Sold (MLS) $65,500 realMLS
- 2004-03-08 Listing Removed — realMLS
- 2003-12-09 Listed $70,000 realMLS
- 2003-03-08 Listed $67,000 realMLS
- 2003-03-01 Listing Removed — realMLS
- 2002-11-12 Listed $65,000 realMLS
- 2001-08-23 Sold (Public Records) $18,000 Public Records
- 1999-12-28 Sold (Public Records) $73,000 Public Records
- 1999-06-24 Sold (Public Records) $42,500 Public Records
Property tax history
+5.6%/yrLatest (2025): $384 · +81.3% YoY. Source: county tax records.
Cash-flow waterfall
monthlySold comps — $/sqft
last 12 mo · ≤1 miLoading sold comps…