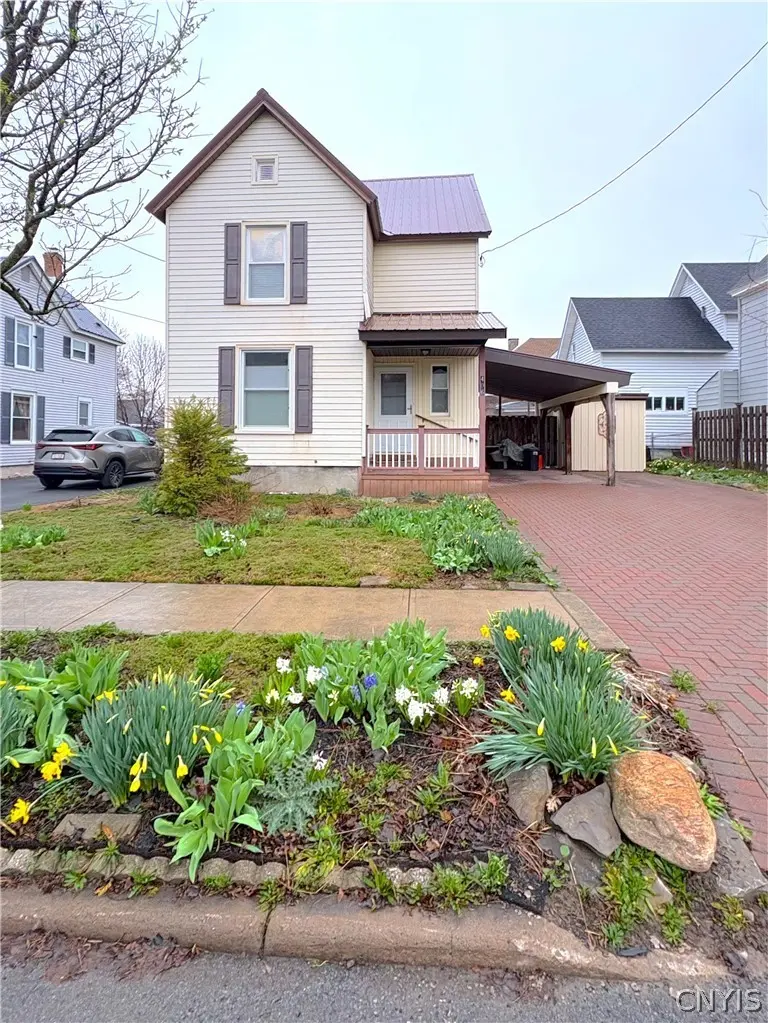
406 Broadway Ave E · Watertown, NY
Flood risk 1/10 · Minimal
- FEMA flood zone
- X
- Chance of flooding over 30 yrs
- 0.0%
- Est. flood insurance / yr
- $473 – $860
Fire risk 1/10 · Minimal
- Est. fire insurance / yr
- $691 – $1,283
Heat risk 2/10 · Minimal
- Hot days now (above 91°F)
- 7 days/yr
- Hot days in 30 yrs
- 15 days/yr
Wind risk 1/10 · Minimal
- Chance of severe wind over 30 yrs
- 0.0%
Air-quality risk 2/10 · Minimal
- Unhealthy air days now
- 1 days/yr
- Unhealthy air days in 30 yrs
- 1 days/yr
Risk factors via First Street. Map © Google.
Why this score? — see what drove the B grade
The composite is a weighted blend of 9 inputs, each scored 0–100. Each bar is that input's sub-score; the figure is the points it added to the 100-point composite (weight × sub-score).
- Cash flow +30.0/30.0
- 1% rule +10.0/10.0
- DSCR +10.0/10.0
- ARV discount +7.5/15.0
- Rent growth +5.0/5.0
- Schools +3.7/10.0
- Livability +3.4/5.0
- Condition / age +2.5/5.0
- Appreciation +0.0/10.0
$79,000
🖨 Deal sheet (PDF) 📄 Offer letter ✓ Due diligence
Listing remarks
Looking for a bargain without sacrificing comfort and charm? This delightful 3-bedroom, 2-bath home is the perfect fit for a first-time buyer ready to put down roots or a savvy investor searching for their next smart purchase. Owned and lovingly maintained by the same family for decades, this home offers a solid foundation with thoughtful updates already in place. Step inside to find an updated kitchen featuring warm maple cabinetry, along with refreshed bathrooms that add modern convenience. The home’s durable metal roof, low-maintenance vinyl siding, and insulated windows provide peace of mind, while the Trex front porch offers a welcoming space to relax and unwind. Additional highl
Key facts
- Metal roof
- Insulated windows
- Refreshed bathrooms
Tags
Property features AI
Exterior
- Parking: Carport; Paver block parking
- Utilities: Public water connected; Sewer connected; Cable available; High-speed internet available; Circuit breaker electrical
- Home design: Two-story property; Existing/resale condition
- Construction: Metal roof; Vinyl siding; Copper plumbing; Block foundation; Full basement
- Exterior features: Covered porch; Porch; Shed(s) / storage; Rectangular residential lot; City street frontage; Lot dimensions approximately 50 x 50
Interior
- Kitchen: Gas oven; Gas range; Dishwasher; Refrigerator; Eat-in kitchen
- Flooring: Carpet; Vinyl; Varied flooring
- Bathrooms: Two full bathrooms; One main-level bathroom
- Heating & cooling: Gas forced-air heating; Central air conditioning
- Interior features: Entrance foyer; Eat-in kitchen; Separate/formal living room; Window treatments; Partially furnished; Drapes; Thermal windows
- Laundry & utility: Washer; Dryer; Laundry located in basement; Gas water heater; Humidifier
Neighborhood map
What this means for you Summary
Snapshot
- This is a 3-bed/1.0-bath single-family listed at $79k.
Deal economics
- At list price, monthly cash flow is $578 ($7k/yr) — positive.
- The deal already cash-flows at list — no discount required.
- Meets the 1% rule at list price ($1k rent vs $79k).
- Cap rate 15.1% vs local median 6.3% in Watertown — top-decile yield for the area; either an underpriced asset or a hidden risk that comps aren't pricing in. Stress-test before assuming the spread holds.
Location & tenants
- Location reads 68/100 on livability (#540 in NY) — a middle-class / working-renter tenant base. Strengths: health & safety A+, cost of living A-, housing A-; Watch: amenities C-, crime F, commute F.
- Watertown City School District (urban): math 34% / reading 54% proficiency, ranked #481 of 590 in NY (top 82%) — families likely to look elsewhere, expect single-tenant / working-renter base with shorter leases.
- Zoned schools: Knickerbocker School (math 32% / reading 47%, grade F, #1,444 of 2,108 statewide, top 71%, 364 students, 71% FRL); Case Middle School (math 17% / reading 41%, grade F, #566 of 729 statewide, top 78%, 626 students, 70% FRL); Watertown Senior High School (math 89% / reading 92%, grade A+, #231 of 1,100 statewide, top 21%, 1,083 students, 65% FRL) — zoned schools average 69% FRL vs 49% district-wide (20 pts higher); higher-poverty schools than district average — tighter screening recommended.
- Market conditions: Rents rising fast (+10.0%/yr); 223 active listings in the ZIP; 15 comparable units currently listed for rent nearby; rentals lingering (median 46d on market — plan ~5-8 weeks vacancy on turnover, expect pricing pressure); 100% of comp listings sitting > 30 days — soft ceiling on asking rent; 196 units permitted in Jefferson County in 2024 (0 in 5+ unit buildings).
Forward outlook
- Local home prices are declining (-3.0%/yr); year-one equity from $546 of loan paydown is wiped out by about $2k of value loss. Plan a longer hold.
- Jefferson County population projected at -12% by 2050 — secular population decline; favor cash flow + early exit over multi-decade hold.
- At projected returns (-3.0% appreciation + 8.0% rent growth), your $22k cash investment doubles in ~4 years — after that, you're playing with house money.
Negotiation context
- Only 5 days on market — expect competitive offers; lowballing is unlikely to land.
Risks & watch-outs
- Watch-outs: built in 1910 — expect roof / HVAC / electrical / plumbing capex.
Questions for the listing agent
- Built in 1910 — when were the roof, HVAC, electrical panel, plumbing, and water heater last replaced?
- Is there a deadline driving the sale (1031 exchange, divorce, estate, relocation)? That informs how much negotiation room exists.
- Schools are D-rated, which usually means shorter tenancies and higher turnover. Who's the typical renter profile here, and what's been the actual vacancy rate?
- Crime grade is F in this area — have there been break-ins, vandalism, or insurance claims at this property in the last 3 years? What carrier currently insures it and at what premium?
- What's the average days-on-market for RENTAL listings here right now (not sales)? A rising rental-DOM trend means longer vacancies and softer asking-rent achievability than the comps imply.
- What's the recent tenant-quality profile in this submarket — average credit score on applications, eviction rate, late-payment / NSF rate, and stable-employment percentage? A property-management company in the area should have these aggregated.
- How much new for-sale + rental construction is in the pipeline within 1–3 miles? Heavy new supply typically softens prices + rents 12–24 months out; constrained supply supports both.
Investment metrics
- 1% rule
- 1.72% ✓
- Cap rate
- 15.07%
- Cash-on-cash
- 31.36%
- DSCR
- 2.40
- GRM
- 4.8
CMA / ARV
- ARV (median comp)
- $195,350
- List price
- $79,000
- Delta
- -59.56%
- Verdict
- UNDERPRICED
- Comps
- 20 within 1.0 mi
Show comp detail 12 sales within ~0.75 mi
| Address | Dist | Beds/Ba | Sqft | Sold | Price | $/sf | Match |
|---|---|---|---|---|---|---|---|
| 607 S Hamilton St | 0.08mi | 3/1.5 | 1,142 (+2%) | 5mo | $179,900 | $158 | 88 |
| 415 Thompson Blvd | 0.19mi | 3/1.0 | 1,240 (+10%) | 6mo | $185,000 | $149 | 69 |
| 235 Ward St | 0.37mi | 3/1.5 | 1,152 (+3%) | 9mo | $210,000 | $182 | 68 |
| 1016 Gotham St | 0.27mi | 3/1.0 | 989 (-12%) | 1mo | $52,000 | $53 | 67 |
| 232 Haley St | 0.36mi | 2/2.0 (-1) | 1,114 (-1%) | 10mo | $210,000 | $189 | 65 |
| 1105 Salina St | 0.24mi | 3/1.5 | 1,248 (+11%) | 6mo | $220,681 | $177 | 63 |
| 603 Emerson St | 0.62mi | 3/1.0 | 1,100 (-2%) | 8mo | $128,000 | $116 | 62 |
| 1136 Franklin St | 0.20mi | 3/1.5 | 1,254 (+12%) | 11mo | $225,000 | $179 | 60 |
| 443 Flower Ave E | 0.26mi | 3/1.0 | 1,270 (+13%) | 7mo | $210,000 | $165 | 60 |
| 930 Riggs Ave | 0.25mi | 3/1.0 | 1,256 (+12%) | 10mo | $35,000 | $28 | 59 |
| 1 Academy Pl | 0.46mi | 3/1.5 | 1,244 (+11%) | 2mo | $85,000 | $68 | 57 |
| 807 Bingham Ave | 0.58mi | 4/1.5 (+1) | 1,152 (+3%) | 10mo | $145,000 | $126 | 53 |
Match score weights: distance 35% · size 25% · config 20% · recency 20%. Top-matched comps best support the ARV.
Projected returns pro-forma
-3.0% appreciation · 8.0% rent growth · sell at horizon
- IRR
- 31.5%
- Equity multiple
- 2.41×
- Total profit
- $31,190
- Equity at exit
- $11,779
- IRR
- 41.3%
- Equity multiple
- 5.85×
- Total profit
- $107,234
- Equity at exit
- $6,830
Cash invested: $22,120 (down + closing). Projections, not guarantees.
Landlord ↔ Tenant lean methodology
- Overall (STATE)
- 15 Strongly Tenant-Friendly
- State New York
- 15 Strongly Tenant-Friendly · D+10
- County
- — inherits STATE
- City
- — inherits STATE
ZIP-level market 13601
- Home prices YoY
- -5.6%
- Rents YoY
- 10.0%
- Active inventory
- 223
- Price-to-rent
- 4.8×
Monthly cashflow live
- Estimated rent
- $1,360 high interval (Pro) →
- Mortgage (P&I)
- −$414
- Tax from tax record
- −$49 /mo · $589/yr
- Insurance
- −$33
- HOA
- −$0
- Lot rent
- −$0
- Vacancy / Maint / Mgmt
- −$286
- Net cashflow
- $578
Break-even live
Sensitivity live
| Price | -10% $623 | -5% $600 | +0% $578 | +5% $556 | +10% $533 |
|---|---|---|---|---|---|
| Rent | -10% $471 | -5% $524 | +0% $578 | +5% $632 | +10% $685 |
| Rate | -1.0pp $618 | -0.5pp $598 | base $578 | +0.5pp $558 | +1.0pp $537 |
UW: 25.0% down · 7.5% · 30yr · 1.5% tax · 5.0% vac · 8.0% maint · 8.0% mgmt
Financing live
Cash to close
- Down payment
- $19,750
- Closing costs
- $2,370
- Reserves months
- —
- Total cash needed
- —
Loan-product check · same deal, 3 products live
Conventional
25% down · 7.5% · 30yr
- Down + closing
- —
- Monthly P&I
- —
- Monthly cashflow
- —
- DSCR
- —
- Eligible?
- —
Personal DTI + credit; lowest rate.
DSCR
20% down · 8.5% · 30yr
- Down + closing
- —
- Monthly P&I
- —
- Monthly cashflow
- —
- DSCR
- —
- Eligible?
- —
No personal income docs; deal must DSCR.
Hard money
10% down · 12.0% · 12mo
- Down + closing
- —
- Monthly P&I
- —
- Monthly cashflow
- —
- DSCR
- —
- Eligible?
- —
Short-term bridge; refi at stabilization.
Rent comps 15 comps
| Address | Beds | Baths | Sqft | Rent | $/sqft | DOM | Units | Dist |
|---|---|---|---|---|---|---|---|---|
| 720 Cadwell St Watertown, NY | 2.0 | 1.5 | 1300 | $995 | $0.77 | 46d | 1 | 0.14mi |
| 816 Boyd St Unit 1 Watertown, NY | 2.0 | 1.0 | 980 | $1,500 | $1.53 | 46d | 1 | 0.31mi |
| 911 State St Unit 3 Watertown, NY | 3.0 | 1.0 | 1200 | $995 | $0.83 | 46d | 1 | 0.42mi |
| 927 State St Watertown, NY | 2.0 | 1.0 | 900 | $1,000 | $1.11 | 46d | 1 | 0.43mi |
| 123 State Pl Watertown, NY | 3.0 | 1.5 | 1500 | $1,750 | $1.17 | 46d | 1 | 0.50mi |
| 328 Clay St Unit 3 Watertown, NY | 3.0 | 2.0 | 1500 | $1,650 | $1.10 | 46d | 1 | 0.52mi |
| 1029 Gill St Watertown, NY | 3.0 | 1.0 | 1275 | $1,950 | $1.53 | 46d | 1 | 0.65mi |
| 311 High St Watertown, NY | 2.0 | 1.0 | 851 | $1,200 | $1.41 | 46d | 1 | 0.73mi |
| 159 Mullin St Unit 2 Watertown, NY | 2.0 | 1.0 | 900 | $1,200 | $1.33 | 46d | 1 | 0.80mi |
| 109 Spring Ave Watertown, NY | 2.0 | 1.0 | 1344 | $1,200 | $0.89 | 46d | 1 | 0.88mi |
| 256 Michigan Ave Watertown, NY | 2.0–4.0 | 1.0–2.5 | 1435 | $1,440 | $1.00 | 46d | 9 | 0.93mi |
| 1815 Olmstead Dr Watertown, NY | 2.0–4.0 | 1.0–2.0 | 1380 | $1,462 | $1.06 | 46d | 6 | 1.13mi |
| 611 Cooper St Watertown, NY | 3.0 | 1.0 | 1190 | $1,495 | $1.26 | 46d | 1 | 1.16mi |
| 136 N Meadow St Unit A Watertown, NY | 2.0 | 1.0 | 1000 | $995 | $0.99 | 46d | 1 | 1.26mi |
| 2240 Kristina Park Watertown, NY | 1.0–3.0 | 1.0–2.0 | 1072 | $1,615 | $1.51 | 46d | 5 | 1.34mi |
Listing history 2 events
-
2026-05-02status Pending 1305-char remark
-
2026-04-27$79,000 Active 1305-char remark
ⓘ Source: listings_history table (triggers on properties + properties_extension) + one-shot
backfill from property_details.listing_events for pre-trigger history.
Tax reassessment forecast NY · Partial reset (capped growth)
- Current annual tax
- $589 · $49/mo
- Projected year-2 tax
- $962 · $80/mo
- Expected delta
- +$373/yr (+$31/mo · 63.3%)
ⓘ Screening estimate from a state-policy table — verify with the county assessor before closing.
Climate risk First Street
- Flood 1/10 Low FEMA zone X · 0% chance over 30 yrs
- Wildfire 1/10 Low
- Heat 2/10 Low 7 d/yr ≥91°F today · 15 d/yr by 30 yrs out
- Wind 1/10 Low 0% chance of damaging wind over 30 yrs
- Air quality 2/10 Low 1 unhealthy d/yr today · 1 by 30 yrs out
Nearby sold comps map
Loading sold comps map…
Walkable amenities ~0.75 mi
Loading nearby amenities…
Taxation est. · year 1
- Rental income
- $16,319
- − Mortgage interest
- −$4,425
- − Property taxes
- −$589
- − Insurance
- −$395
- − Repairs & maintenance
- −$1,305
- − Management
- −$1,305
- − Depreciation
- −$2,298
- Taxable income
- $6,000
- Est. tax owed @ 24.0%
- −$1,440
- After-tax cash flow
- $5,496/yr
For passive investors: Depreciation is non-cash, so a rental often shows a tax loss while cash-flowing — sheltering income. Rental losses are passive: they offset passive income freely, and up to $25,000/yr can offset ordinary (W-2) income if you actively participate and your MAGI is under $100k (phasing out to $0 by $150k); unused losses carry forward. On sale, claimed depreciation is recaptured at up to 25%, and gains may owe capital-gains tax (a 1031 exchange can defer both). Figures are a year-1 estimate at your 24.0% rate — not tax advice; consult a CPA.
Schools (NCES district)
- District
- Watertown City School District
- NCES district ID
- 3630120
- Math proficiency
- 34% ▼ -10.00%
- Reading proficiency
- 54% ▲ 12.00%
- Median HH income
- $40,919
- Composite
- 36.86/100
- National rank
- #4551
- State rank
- #481 of 590 in NY
Livability — Watertown
- Score
- 68/100
- State rank
- #540
- US rank
- #9700
Category grades
Schools grade is shown separately in the Schools card above.
Census & demographics
- Census place
- Watertown, NY
- County
- Jefferson County · 47,417 people
- City population
- 36,839
- Metro
- Watertown-Fort Drum, NY
- Population (ZIP)
- 36,839
- Household income
- $58,791
- Rent vs Own
- Severe rent burden
- 1634.0
Population outlook (Jefferson County) Hauer SSP2
- Today (2025)
- 111,748 people
- By 2030
- 109,370 · -2.1%
- By 2040
- 103,828 · -7.1%
- By 2050
- 98,523 · -11.8%
- By 2075
- 91,422 · -18.2%
- By 2100
- 78,214 · -30.0%
Race, ethnicity, and origin ACS 2023
- Neighborhood character
- Predominantly White (82%)
- Race & ethnicity
- White 82% Two or more races 7% Hispanic / Latino 6% Black 4% Asian 2%
- Hispanic origin (detail)
- Mexican 2% Puerto Rican 2%
- Common ancestry
- Lithuanian 7% Romanian 3% Slovak 2%
- Foreign-born
- 4% · Canada
- Languages at home
- 94% English-only · Spanish 3% Other Indo-European 1% German/W. Germanic 1%
Political lean MEDSL · Jefferson
- 2024 margin
- Strong R (+23.6) · D 38.2% · R 61.8%
- 2008→2024 swing
- -18.3pp toward R · 2008: -5.3pp · 2024: -23.6pp
- All cycles
- 2024: R+23.6 2020: R+19.0 2016: R+22.4 2012: R+2.9 2008: R+5.3
Not yet ingested
- Civics
- —
Market trends
- HPI YoY
- ▼ -18.86%
- Current HPI
- 316.636
- Rent YoY
- ▲ 9.96%
- Metro
- Watertown-Fort Drum, NY
- State GDP YoY
- ▲ 2.60%
- F500 in state
- 92
Industry mix (Fortune 500 HQ in NY)
| Industry | F500 HQs | Revenue |
|---|---|---|
| Financial Services | 10 | $950B |
|
||
| Consumer Goods | 9 | $162B |
|
||
| Insurance | 4 | $225B |
|
||
| Telecommunications | 2 | $144B |
|
||
| Pharmaceuticals | 2 | $112B |
|
||
| Media / Entertainment | 2 | $69B |
|
||
Price history
2 events — show timeline
- 2026-05-02 Pending — CNYIS
- 2026-04-27 Listed $79,000 CNYIS
Property tax history
+7.0%/yrLatest (2025): $589 · +8.9% YoY. Source: county tax records.
Cash-flow waterfall
monthlySold comps — $/sqft
last 12 mo · ≤1 miLoading sold comps…