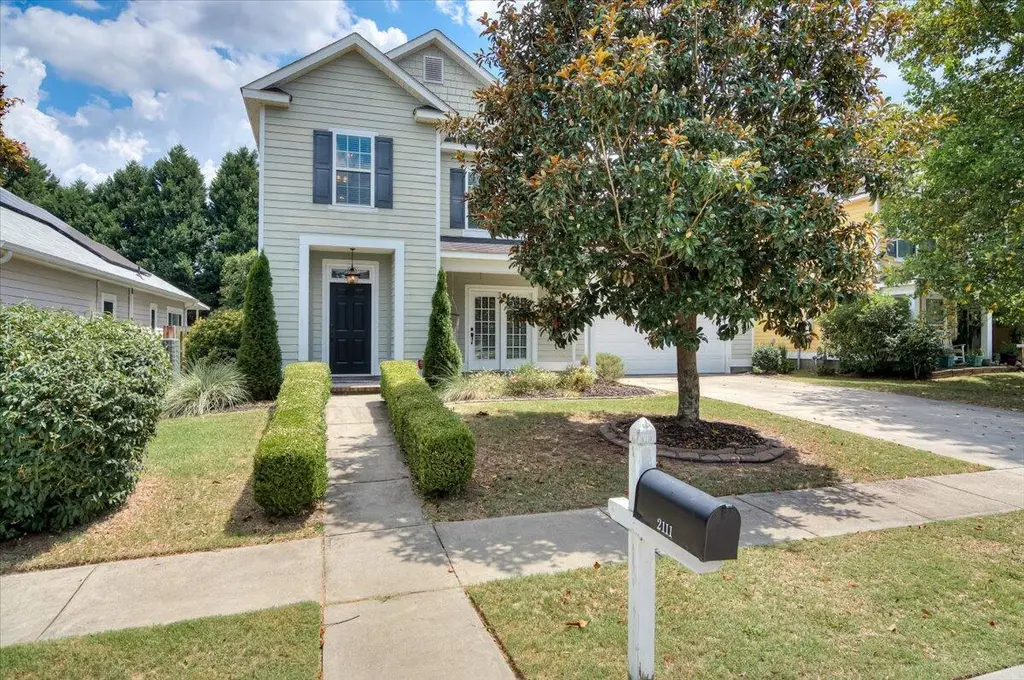
2111 Magnolia Pwky Pkwy · Evans, GA
Flood risk 1/10 · Minimal
- FEMA flood zone
- X (unshaded)
- Chance of flooding over 30 yrs
- 0.0%
- Est. flood insurance / yr
- $507 – $1,088
Fire risk 4/10 · Minor
- Est. fire insurance / yr
- $963 – $1,789
Heat risk 7/10 · Major
- Hot days now (above 105°F)
- 7 days/yr
- Hot days in 30 yrs
- 18 days/yr
Wind risk 6/10 · Moderate
- Chance of severe wind over 30 yrs
- 64.0%
Air-quality risk 3/10 · Minor
- Unhealthy air days now
- 2 days/yr
- Unhealthy air days in 30 yrs
- 3 days/yr
Risk factors via First Street. Map © Google.
Why this score? — see what drove the D grade
The composite is a weighted blend of 9 inputs, each scored 0–100. Each bar is that input's sub-score; the figure is the points it added to the 100-point composite (weight × sub-score).
- Cash flow +12.4/30.0
- ARV discount +7.5/15.0
- Schools +4.5/10.0
- Livability +3.9/5.0
- DSCR +3.7/10.0
- 1% rule +3.2/10.0
- Rent growth +2.8/5.0
- Condition / age +2.5/5.0
- Appreciation +0.0/10.0
$259,900
🖨 Deal sheet (PDF) 📄 Offer letter ✓ Due diligence
Listing remarks MLS
BEAUTIFULLY MAINTAINED HOME AND YARD. OPEN FLOOR PLAN WITH ALL BEDROOMS UP, HARDWOODS DOWN AND CERAMIC TILE IN BATHS, PRIVACY FENCED BACK YARD.
Key facts
- 0.35 acre lot
- Garage
- Built 2005
Neighborhood map
What this means for you Summary
Snapshot
- This is a 3-bed/2.0-bath other listed at $260k.
Deal economics
- At list price, monthly cash flow is $-45 ($-537/yr) — negative.
- To cash-flow at today's rent, offer at most $252k (3.0% below list).
- To meet the 1% rule (rent ≥ 1% of price), the offer needs to be $212k (18.4% below list).
- Recommended offer: $212k (18.4% below list) — sets the bar for 1% rule.
- Cap rate 6.1% vs local median 3.8% in Evans — top-decile yield for the area; either an underpriced asset or a hidden risk that comps aren't pricing in. Stress-test before assuming the spread holds.
Location & tenants
- Location reads 77/100 on livability (#20 in GA, #3,058 nationally) — a middle-class / working-renter tenant base. Strengths: crime A+, employment A+, housing A+; Watch: amenities D+, commute F.
- Columbia County (suburban): math 49% / reading 52% proficiency, ranked #13 of 174 in GA (top 8%) — acceptable for families but not a draw, mixed tenant base, ~2y average lease.
- Zoned schools: Brookwood Elementary School (math 50% / reading 41%, grade D-, #323 of 1,228 statewide, top 26%, 696 students, 52% FRL); Columbia Middle School (math 37% / reading 48%, grade D-, #122 of 470 statewide, top 26%, 993 students, 33% FRL); Evans High School (math 12% / reading 31%, grade F, #218 of 424 statewide, top 53%, 1,887 students, 30% FRL).
- Zoned-school proficiency averages 36% at this address vs 50% district-wide (-14 pts) — the specific schools serving this property underperform the Columbia County average; the district grade overstates school quality for this exact location.
- Market conditions: Rents rising (+1.1%/yr); 724 active listings in the ZIP; 14 comparable units currently listed for rent nearby; rentals at typical pace (median 24d on market — plan ~3-4 weeks tenant-placement turnaround); 43% of comp listings sitting > 30 days — soft ceiling on asking rent; solid renter incomes; 1,213 units permitted in Columbia County in 2024 (0 in 5+ unit buildings).
Forward outlook
- Local home prices are declining (-3.0%/yr); year-one equity from $2k of loan paydown is wiped out by about $8k of value loss. Plan a longer hold.
- Columbia County population projected at +62% by 2050 — long-run rental-demand tailwind backs the buy-and-hold thesis.
Negotiation context
- Only 0 days on market — expect competitive offers; lowballing is unlikely to land.
- 10 sale attempts since 21y ago; this cycle's ask has dropped $144k (36%) from the opening price — seller is motivated, your offer sets the floor, not the list.
- Current owner paid $170k; list at $260k implies a 53% gain — meaningful room to come down on a strong offer.
Risks & watch-outs
- Climate carrying-cost: major wind risk, 64% chance of damaging wind over 30y; extreme-heat days projected 7→18/yr by 2055 (HVAC capex compounding) — expect insurance premiums to compound above CPI over the hold.
Questions for the listing agent
- What do current leases actually rent for vs. the listed asking? Can we see a recent rent roll and the last 12 months of T-12 income?
- What does the HOA fee cover, when was the last increase, and are there any pending special assessments or reserve-fund shortfalls?
- Is there a deadline driving the sale (1031 exchange, divorce, estate, relocation)? That informs how much negotiation room exists.
- Schools are B-rated — typically a magnet for longer-tenancy family renters. What's the average tenant stay here, and is there a school-zone premium baked into asking?
- The area grade is low — what's the realistic commute time and amenity access for the typical tenant pool here? Any planned neighborhood developments (good or bad) we should know about?
- What's the average days-on-market for RENTAL listings here right now (not sales)? A rising rental-DOM trend means longer vacancies and softer asking-rent achievability than the comps imply.
- What's the recent tenant-quality profile in this submarket — average credit score on applications, eviction rate, late-payment / NSF rate, and stable-employment percentage? A property-management company in the area should have these aggregated.
- How much new for-sale + rental construction is in the pipeline within 1–3 miles? Heavy new supply typically softens prices + rents 12–24 months out; constrained supply supports both.
Investment metrics
- 1% rule
- 0.82% ✗
- Cap rate
- 6.09%
- Cash-on-cash
- -0.74%
- DSCR
- 0.97
- GRM
- 10.2
CMA / ARV
No comps found within radius.
Projected returns pro-forma
-3.0% appreciation · 1.15% rent growth · sell at horizon
- IRR
- -19.5%
- Equity multiple
- 0.33×
- Total profit
- $-48,854
- Equity at exit
- $38,752
- IRR
- -16.5%
- Equity multiple
- 0.15×
- Total profit
- $-61,592
- Equity at exit
- $22,471
Cash invested: $72,772 (down + closing). Projections, not guarantees.
Landlord ↔ Tenant lean methodology
- Overall (STATE)
- 90 Strongly Landlord-Friendly
- State Georgia
- 90 Strongly Landlord-Friendly · R+3
- County
- — inherits STATE
- City
- — inherits STATE
ZIP-level market 30813
- Home prices YoY
- -29.2%
- Rents YoY
- 1.1%
- Active inventory
- 724
- Price-to-rent
- 10.2×
Monthly cashflow live
- Estimated rent
- $2,120 high interval (Pro) →
- Mortgage (P&I)
- −$1,363
- Tax from tax record
- −$228 /mo · $2,732/yr
- Insurance
- −$108
- HOA
- −$21
- Vacancy / Maint / Mgmt
- −$445
- Net cashflow
- $-45
Break-even live
Sensitivity live
| Price | -10% $102 | -5% $29 | +0% $-45 | +5% $-118 | +10% $-192 |
|---|---|---|---|---|---|
| Rent | -10% $-212 | -5% $-128 | +0% $-45 | +5% $39 | +10% $123 |
| Rate | -1.0pp $86 | -0.5pp $21 | base $-45 | +0.5pp $-112 | +1.0pp $-181 |
UW: 25.0% down · 7.5% · 30yr · 1.5% tax · 5.0% vac · 8.0% maint · 8.0% mgmt
Financing live
Cash to close
- Down payment
- $64,975
- Closing costs
- $7,797
- Reserves months
- —
- Total cash needed
- —
Loan-product check · same deal, 3 products live
Conventional
25% down · 7.5% · 30yr
- Down + closing
- —
- Monthly P&I
- —
- Monthly cashflow
- —
- DSCR
- —
- Eligible?
- —
Personal DTI + credit; lowest rate.
DSCR
20% down · 8.5% · 30yr
- Down + closing
- —
- Monthly P&I
- —
- Monthly cashflow
- —
- DSCR
- —
- Eligible?
- —
No personal income docs; deal must DSCR.
Hard money
10% down · 12.0% · 12mo
- Down + closing
- —
- Monthly P&I
- —
- Monthly cashflow
- —
- DSCR
- —
- Eligible?
- —
Short-term bridge; refi at stabilization.
Rent comps 14 comps
| Address | Beds | Baths | Sqft | Rent | $/sqft | DOM | Units | Dist |
|---|---|---|---|---|---|---|---|---|
| 6037 Big Pond Trl Grovetown, GA | 4.0 | 2.5 | 2544 | $2,500 | $0.98 | 44d | 1 | 0.46mi |
| 6037 Big Pond Trl Grovetown, GA | 4.0 | 2.5 | 2544 | $2,500 | $0.98 | 24d | 1 | 0.46mi |
| 4724 Brookgreen Rd Augusta, GA | 3.0 | 2.0 | 1798 | $2,175 | $1.21 | 14d | 1 | 0.50mi |
| 303 Meadowlake Dr Martinez, GA | 3.0 | 2.0 | 1951 | $1,700 | $0.87 | 14d | 1 | 0.79mi |
| 4565 Rockdale Ct Augusta, GA | 4.0 | 3.0 | 1886 | $1,900 | $1.01 | 44d | 1 | 0.89mi |
| 4565 Rockdale Ct Augusta, GA | 4.0 | 3.0 | 1886 | $1,900 | $1.01 | 24d | 1 | 0.89mi |
| 299 Ashbrook Dr Augusta, GA | 4.0 | 2.5 | 2080 | $2,295 | $1.10 | 44d | 1 | 0.91mi |
| 327 Oak Lake Dr Augusta, GA | 3.0 | 2.0 | 1619 | $1,600 | $0.99 | 24d | 1 | 0.93mi |
| 4537 Shawnee Dr Augusta, GA | 3.0 | 2.0 | 1534 | $1,795 | $1.17 | 24d | 1 | 1.23mi |
| 913 Cabot Cv Augusta, GA | 3.0 | 2.5 | 1677 | $1,895 | $1.13 | 44d | 1 | 1.32mi |
| 1426 Collins Dr Augusta, GA | 3.0 | 2.5 | 1551 | $2,000 | $1.29 | 24d | 1 | 1.33mi |
| 807 Bell Springs Ct Grovetown, GA | 3.0 | 2.5 | 1844 | $1,900 | $1.03 | 44d | 1 | 1.34mi |
| 1447 Collins Dr Augusta, GA | 3.0 | 2.5 | 1580 | $1,790 | $1.13 | 44d | 1 | 1.35mi |
| 1422 Collins Dr Augusta, GA | 3.0 | 2.5 | 2102 | $1,949 | $0.93 | 14d | 1 | 1.36mi |
HOA detail
- Monthly dues
- $21 · $252/yr
Listing history 32 events
-
2026-02-13price $177,731 143-char remark
Show marketing remark (169 chars)
GREAT OPEN FLOOR PLAN WITH FP, COVERED PORCH, ALL BEDROOMS UPSTAIRS, HARDWOOD FLOORS ALL DOWNSTAIRS, CERAMIC TILE IN ALL BATHS. SELLER TO PAY $2500 TOWARDS CLOSING COSTS
-
2026-02-13price $178,900 169-char remark
Show marketing remark (169 chars)
GREAT OPEN FLOOR PLAN WITH FP, COVERED PORCH, ALL BEDROOMS UPSTAIRS, HARDWOOD FLOORS ALL DOWNSTAIRS, CERAMIC TILE IN ALL BATHS. SELLER TO PAY $2500 TOWARDS CLOSING COSTS
-
2024-03-08soldstatus $170,000 143-char remark
Show marketing remark (143 chars)
BEAUTIFULLY MAINTAINED HOME AND YARD. OPEN FLOOR PLAN WITH ALL BEDROOMS UP, HARDWOODS DOWN AND CERAMIC TILE IN BATHS, PRIVACY FENCED BACK YARD.
-
2024-01-03$403,490 143-char remark
Show marketing remark (143 chars)
BEAUTIFULLY MAINTAINED HOME AND YARD. OPEN FLOOR PLAN WITH ALL BEDROOMS UP, HARDWOODS DOWN AND CERAMIC TILE IN BATHS, PRIVACY FENCED BACK YARD.
-
2022-10-26soldstatus $260,000
-
2022-09-16historical
-
2022-09-14historical
-
2022-09-14historical
-
2022-08-06$259,900
-
2022-08-06$259,900
-
2021-09-30soldstatus $178,900 169-char remark
Show marketing remark (169 chars)
GREAT OPEN FLOOR PLAN WITH FP, COVERED PORCH, ALL BEDROOMS UPSTAIRS, HARDWOOD FLOORS ALL DOWNSTAIRS, CERAMIC TILE IN ALL BATHS. SELLER TO PAY $2500 TOWARDS CLOSING COSTS
-
2021-08-30$199,900 169-char remark
Show marketing remark (169 chars)
GREAT OPEN FLOOR PLAN WITH FP, COVERED PORCH, ALL BEDROOMS UPSTAIRS, HARDWOOD FLOORS ALL DOWNSTAIRS, CERAMIC TILE IN ALL BATHS. SELLER TO PAY $2500 TOWARDS CLOSING COSTS
-
2017-03-22soldstatus $191,500
-
2017-03-20soldstatus $191,500
-
2017-03-20soldstatus $191,500
-
2017-02-03$191,900
-
2017-02-03$191,900
-
2016-03-23soldstatus $171,500
-
2016-03-18soldstatus $171,500
-
2016-03-18soldstatus $171,500
-
2015-09-02$175,000
-
2015-09-02$175,000
-
2008-11-24soldstatus $186,000
-
2008-11-24soldstatus $170,000
-
2008-11-21soldstatus $170,000 Closed 143-char remark
Show marketing remark (143 chars)
BEAUTIFULLY MAINTAINED HOME AND YARD. OPEN FLOOR PLAN WITH ALL BEDROOMS UP, HARDWOODS DOWN AND CERAMIC TILE IN BATHS, PRIVACY FENCED BACK YARD.
-
2008-11-21soldstatus $170,000
Show marketing remark (143 chars)
BEAUTIFULLY MAINTAINED HOME AND YARD. OPEN FLOOR PLAN WITH ALL BEDROOMS UP, HARDWOODS DOWN AND CERAMIC TILE IN BATHS, PRIVACY FENCED BACK YARD.
-
2008-07-07$177,731
-
2005-09-16soldstatus $178,900 Closed 169-char remark
Show marketing remark (169 chars)
GREAT OPEN FLOOR PLAN WITH FP, COVERED PORCH, ALL BEDROOMS UPSTAIRS, HARDWOOD FLOORS ALL DOWNSTAIRS, CERAMIC TILE IN ALL BATHS. SELLER TO PAY $2500 TOWARDS CLOSING COSTS
-
2005-09-16soldstatus $178,900
Show marketing remark (169 chars)
GREAT OPEN FLOOR PLAN WITH FP, COVERED PORCH, ALL BEDROOMS UPSTAIRS, HARDWOOD FLOORS ALL DOWNSTAIRS, CERAMIC TILE IN ALL BATHS. SELLER TO PAY $2500 TOWARDS CLOSING COSTS
-
2005-02-25$178,900
-
2005-01-12soldstatus $150,000
-
2001-08-15soldstatus $399,300
ⓘ Source: listings_history table (triggers on properties + properties_extension) + one-shot
backfill from property_details.listing_events for pre-trigger history.
Tax reassessment forecast GA · Resets to sale price
- Current annual tax
- $2,732 · $228/mo
- Projected year-2 tax
- $2,732 · $228/mo
- Expected delta
- $0/yr ($0/mo · 0.0%)
ⓘ Screening estimate from a state-policy table — verify with the county assessor before closing.
Climate risk First Street
- Flood 1/10 Low FEMA zone X (unshaded) · 0% chance over 30 yrs
- Wildfire 4/10 Moderate
- Heat 7/10 Severe 7 d/yr ≥105°F today · 18 d/yr by 30 yrs out
- Wind 6/10 Major 64% chance of damaging wind over 30 yrs
- Air quality 3/10 Moderate 2 unhealthy d/yr today · 3 by 30 yrs out
Nearby sold comps map
Loading sold comps map…
Walkable amenities ~0.75 mi
Loading nearby amenities…
Taxation est. · year 1
- Rental income
- $25,446
- − Mortgage interest
- −$14,558
- − Property taxes
- −$2,732
- − Insurance
- −$1,300
- − Repairs & maintenance
- −$2,036
- − Management
- −$2,036
- − HOA
- −$252
- − Depreciation
- −$7,561
- Taxable loss
- −$5,028
- Est. tax savings @ 24.0%
- +$1,207
- After-tax cash flow
- $670/yr
For passive investors: Depreciation is non-cash, so a rental often shows a tax loss while cash-flowing — sheltering income. Rental losses are passive: they offset passive income freely, and up to $25,000/yr can offset ordinary (W-2) income if you actively participate and your MAGI is under $100k (phasing out to $0 by $150k); unused losses carry forward. On sale, claimed depreciation is recaptured at up to 25%, and gains may owe capital-gains tax (a 1031 exchange can defer both). Figures are a year-1 estimate at your 24.0% rate — not tax advice; consult a CPA.
Schools (NCES district)
- District
- Columbia County
- NCES district ID
- 1301410
- Math proficiency
- 49% ▼ -6.00%
- Reading proficiency
- 52% ▼ -4.00%
- Median HH income
- $69,358
- Composite
- 45.04/100
- National rank
- #2695
- State rank
- #13 of 174 in GA
Livability — Evans
- Score
- 77/100
- State rank
- #20
- US rank
- #3058
Category grades
Schools grade is shown separately in the Schools card above.
Census & demographics
- County
- Columbia County · 154,184 people
- City population
- 54,743
- Metro
- Augusta-Richmond County, GA-SC
- Population (ZIP)
- 52,466
- Household income
- $86,923
- Rent vs Own
- Severe rent burden
- 960.0
Population outlook (Columbia County) Hauer SSP2
- Today (2025)
- 189,073 people
- By 2030
- 212,277 · +12.3%
- By 2040
- 259,480 · +37.2%
- By 2050
- 306,991 · +62.4%
- By 2075
- 421,213 · +122.8%
- By 2100
- 496,722 · +162.7%
Race, ethnicity, and origin ACS 2023
- Neighborhood character
- Diverse neighborhood (Simpson 0.65)
- Race & ethnicity
- White 51% Black 29% Hispanic / Latino 11% Two or more races 10% Asian 2%
- Hispanic origin (detail)
- Mexican 5% Puerto Rican 3%
- Common ancestry
- Italian 2% Serbian 1% Lithuanian 1%
- Foreign-born
- 6% · Canada, Vietnam
- Languages at home
- 88% English-only · Spanish 7% German/W. Germanic 2% Other Indo-European 1%
Political lean MEDSL · Columbia
- 2024 margin
- Strong R (+25.6) · D 36.8% · R 62.5%
- 2008→2024 swing
- +17.0pp toward D · 2008: -42.7pp · 2024: -25.6pp
- All cycles
- 2024: R+25.6 2020: R+25.8 2016: R+37.7 2012: R+43.0 2008: R+42.7
Not yet ingested
- Civics
- —
Market trends
- HPI YoY
- ▼ -96.24%
- Current HPI
- 233.821
- Rent YoY
- ▲ 1.15%
- Metro
- Augusta-Richmond County, GA-SC
- State GDP YoY
- ▲ 2.66%
- F500 in state
- 28
Industry mix (Fortune 500 HQ in GA)
| Industry | F500 HQs | Revenue |
|---|---|---|
| Paper / Packaging | 2 | $29B |
|
||
| Retail | 1 | $160B |
|
||
| Transportation / Logistics | 1 | $91B |
|
||
| Airlines | 1 | $62B |
|
||
| Consumer Goods | 1 | $47B |
|
||
| Utilities | 1 | $25B |
|
||
Price history
-55.5% since first listed32 events — show timeline
- 2026-02-13 Price Changed $177,731 Hive MLS
- 2026-02-13 Price Changed $178,900 Hive MLS
- 2024-03-08 Sold (MLS) $170,000 Hive MLS
- 2024-01-03 Listed $403,490 Hive MLS
- 2022-10-26 Sold (Public Records) $260,000 Public Records
- 2022-09-16 Listing Removed — Hive MLS
- 2022-09-14 Listing Removed — Hive MLS
- 2022-09-14 Listing Removed — Hive MLS
- 2022-08-06 Listed $259,900 Hive MLS
- 2022-08-06 Listed $259,900 Hive MLS
- 2021-09-30 Sold (MLS) $178,900 Hive MLS
- 2021-08-30 Listed $199,900 Hive MLS
- 2017-03-22 Sold (Public Records) $191,500 Public Records
- 2017-03-20 Sold (MLS) $191,500 Hive MLS
- 2017-03-20 Sold (MLS) $191,500 Hive MLS
- 2017-02-03 Listed $191,900 Hive MLS
- 2017-02-03 Listed $191,900 Hive MLS
- 2016-03-23 Sold (Public Records) $171,500 Public Records
- 2016-03-18 Sold (MLS) $171,500 Hive MLS
- 2016-03-18 Sold (MLS) $171,500 Hive MLS
- 2015-09-02 Listed $175,000 Hive MLS
- 2015-09-02 Listed $175,000 Hive MLS
- 2008-11-24 Sold (Public Records) $170,000 Public Records
- 2008-11-24 Sold (Public Records) $186,000 Public Records
- 2008-11-21 Sold (MLS) $170,000 Hive MLS
- 2008-11-21 Sold (MLS) $170,000 Hive MLS
- 2008-07-07 Listed $177,731 Hive MLS
- 2005-09-16 Sold (MLS) $178,900 Hive MLS
- 2005-09-16 Sold (MLS) $178,900 Hive MLS
- 2005-02-25 Listed $178,900 Hive MLS
- 2005-01-12 Sold (Public Records) $150,000 Public Records
- 2001-08-15 Sold (Public Records) $399,300 Public Records
Property tax history
+3.9%/yrLatest (2025): $2,732 · -7.0% YoY. Source: county tax records.
Cash-flow waterfall
monthlySold comps — $/sqft
last 12 mo · ≤1 miLoading sold comps…