 17-Plex
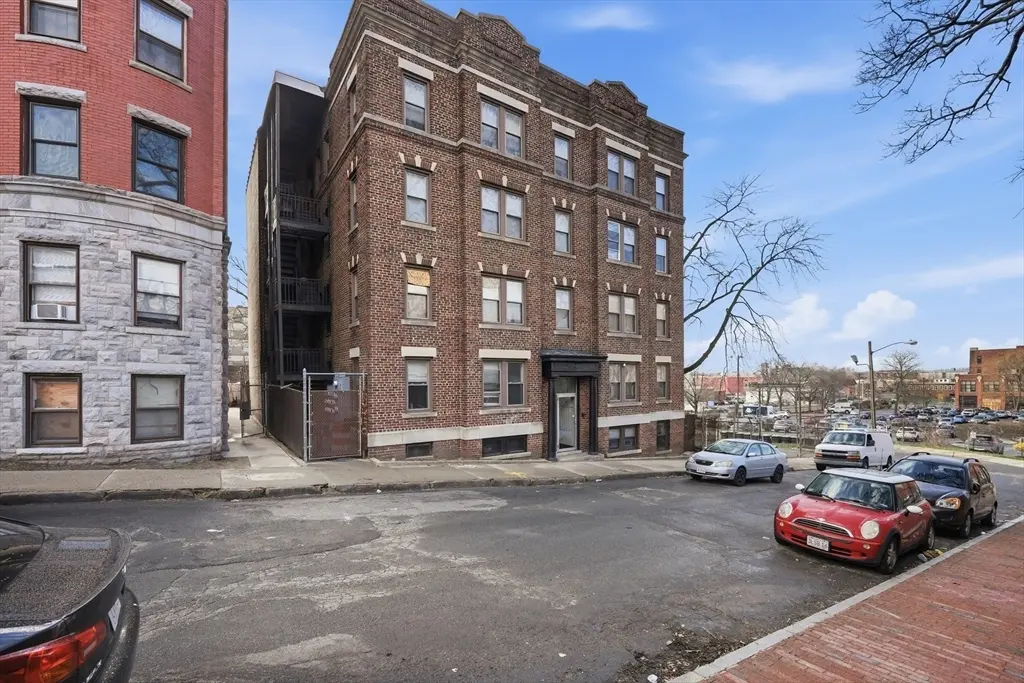
91 E Park St · Springfield, MA
Flood risk No data
- FEMA flood zone
- —
- Chance of flooding over 30 yrs
- —
- Est. flood insurance / yr
- —
Fire risk No data
- Est. fire insurance / yr
- —
Heat risk No data
- Hot days now (above threshold)
- —
- Hot days in 30 yrs
- —
Wind risk No data
- Chance of severe wind over 30 yrs
- —
Air-quality risk No data
- Unhealthy air days now
- —
- Unhealthy air days in 30 yrs
- —
Risk factors via First Street. Map © Google.
Why this score? — see what drove the C- grade
The composite is a weighted blend of 9 inputs, each scored 0–100. Each bar is that input's sub-score; the figure is the points it added to the 100-point composite (weight × sub-score).
- Cash flow +20.1/30.0
- ARV discount +7.5/15.0
- DSCR +6.4/10.0
- Appreciation +5.5/10.0
- 1% rule +4.5/10.0
- Livability +3.7/5.0
- Rent growth +2.5/5.0
- Condition / age +2.5/5.0
- Schools +1.6/10.0
$2,150,000
🖨 Deal sheet (PDF) 📄 Offer letter ✓ Due diligence
Multi-family units
County records classify this as Multi-Family (5+ Unit). Listing-text estimate: 17 units. confirmed
5+ unit building — per-unit beds/baths from public records are typically unavailable; the breakdown below (if shown) is an estimate from the listing text.
Listing remarks
Exceptional investment opportunity at 91 E Park Street! This 17-unit apartment building consists entirely of one-bedroom apartments, offering a desirable and easy-to-manage unit mix with strong rental demand. Currently generating approximately $21,153 in gross monthly income, the property has only one vacant unit, providing immediate upside through lease-up. The consistent unit configuration supports operational efficiency, simplified management, and stable occupancy. Conveniently located minutes from MGM Springfield, downtown Springfield, major highways, public transportation, shopping, and local amenities, the property is well-positioned to attract and retain tenants. Whether you're looki
Key facts
- One bedroom units
- Strong rental demand
- Stable occupancy
Tags
Property features AI
Finance
- Other: Total building area approximately 12,184
- HOA & community: Not a senior community; Nearby public transportation, T-Station, shopping, park, walk/jog trails, medical facility, laundromat, highway access, house of worship, university
Exterior
- Parking: Off-street parking
- Utilities: Public water; Public sewer; Gas available for range; Utilities may vary by unit
- Home design: 5+ unit multifamily (units up/down); 4 stories; Entry facing public street
- Construction: Built (year per public records); Brick/mortar foundation; Tar/gravel roof
- Exterior features: Porch; City views; Public road frontage
Interior
- Kitchen: Range; Refrigerator
- Flooring: Tile; Hardwood; Varies by unit
- Bathrooms: 17 full bathrooms
- Interior features: Living room; Dining room; Kitchen; 85 total rooms
Neighborhood map
What this means for you Summary
Snapshot
- This is a 17 × 1-bed/1-bath units multifamily listed at $2.15M.
Deal economics
- At list price, monthly cash flow is $3k ($32k/yr) — positive. Per door: $157/mo.
- The deal already cash-flows at list — no discount required.
- To meet the 1% rule (rent ≥ 1% of price), the offer needs to be $2.04M (5.0% below list).
- Recommended offer: $2.02M (6.0% below list) — sets the bar for market timing.
- Cap rate 7.8% vs local median 4.9% in Springfield — top-decile yield for the area; either an underpriced asset or a hidden risk that comps aren't pricing in. Stress-test before assuming the spread holds.
Location & tenants
- Location reads 73/100 on livability (#97 in MA) — a middle-class / working-renter tenant base. Strengths: commute A+, health & safety A+, amenities A; Watch: crime F, employment D-.
- Springfield (urban): math 13% / reading 25% proficiency, ranked #296 of 302 in MA (top 98%) — low school quality limits family demand, transient renter base, plan for 1-2y turnover; 81% free/reduced lunch — lower-income household profile, screen leases tightly.
- Zoned schools: Milton Bradley School (math 7% / reading 22%, grade F, #873 of 938 statewide, top 94%, 515 students, 0% FRL); Stem Middle Academy (math 14% / reading 23%, grade F, #263 of 305 statewide, top 86%, 297 students, 0% FRL); Springfield Central High (math 27% / reading 41%, grade F, #250 of 343 statewide, top 73%, 2,095 students, 0% FRL) — zoned schools average 0% FRL vs 81% district-wide (81 pts lower); this property's tenant base skews higher-income than the district average.
- Market conditions: 21 active listings in the ZIP; 453 units permitted in Hampden County in 2024 (116 in 5+ unit buildings).
Forward outlook
- In year one you build about $38k of equity ($15k loan paydown + $23k appreciation (1.1% local appreciation)).
- Hampden County population projected at +5% by 2050 — modest demand growth; plan on rents tracking national, not racing it.
- At projected returns (1.1% appreciation + 3.0% rent growth), your $602k cash investment doubles in ~7 years — after that, you're playing with house money.
- By year 4, paydown + projected appreciation supports a ~$138k cash-out refi (75% LTV) — recoverable capital for the next deal without selling this one.
Negotiation context
- It's been on market 63 days — a 6% lower offer ($2.02M) is reasonable based on typical stale-listing flexibility.
- Current owner paid $1.19M; list at $2.15M implies a 81% gain — meaningful room to come down on a strong offer.
Risks & watch-outs
- Watch-outs: built in 1930 — expect roof / HVAC / electrical / plumbing capex.
Questions for the listing agent
- It's been on market 63 days. Have you received any prior offers? Is the seller open to a 6% concession, seller financing, or rate buy-down credit?
- Can we see the unit-by-unit rent roll, current vacancy, and any below-market leases? What's the average tenancy length?
- What capital expenditures (roof, boiler, parking lot, exteriors) have been made in the last 5 years, and what's planned in the next 2?
- Built in 1930 — when were the roof, HVAC, electrical panel, plumbing, and water heater last replaced?
- Why hasn't it sold? Are there any deal-killer items the seller is aware of (foundation, flood, title, zoning, code violations)?
- Is there a deadline driving the sale (1031 exchange, divorce, estate, relocation)? That informs how much negotiation room exists.
- Schools are D-rated, which usually means shorter tenancies and higher turnover. Who's the typical renter profile here, and what's been the actual vacancy rate?
- Crime grade is F in this area — have there been break-ins, vandalism, or insurance claims at this property in the last 3 years? What carrier currently insures it and at what premium?
- What's the average days-on-market for RENTAL listings here right now (not sales)? A rising rental-DOM trend means longer vacancies and softer asking-rent achievability than the comps imply.
- What's the recent tenant-quality profile in this submarket — average credit score on applications, eviction rate, late-payment / NSF rate, and stable-employment percentage? A property-management company in the area should have these aggregated.
- How much new apartment / multifamily construction is in the pipeline within 1–3 miles? Heavy new supply (>2% of stock underway) typically softens rents 12–24 months out; light construction supports rent growth.
Investment metrics
- 1% rule
- 0.95% ✗
- Cap rate
- 7.79%
- Cash-on-cash
- 5.33%
- DSCR
- 1.24
- GRM
- 8.8
CMA / ARV
- ARV (median comp)
- $1,193,606
- List price
- $2,150,000
- Delta
- 80.13%
- Verdict
- OVERPRICED
- Comps
- 4 within 1.0 mi
Projected returns pro-forma
1.08% appreciation · 3.0% rent growth · sell at horizon
- IRR
- 7.1%
- Equity multiple
- 1.36×
- Total profit
- $218,448
- Equity at exit
- $742,906
- IRR
- 11.1%
- Equity multiple
- 2.36×
- Total profit
- $821,514
- Equity at exit
- $994,200
Cash invested: $602,000 (down + closing). Projections, not guarantees.
Landlord ↔ Tenant lean methodology
- Overall (STATE)
- 20 Strongly Tenant-Friendly
- State Massachusetts
- 20 Strongly Tenant-Friendly · D+15
- County
- — inherits STATE
- City
- — inherits STATE
ZIP-level market 01105
- Home prices YoY
- 0.3%
- Active inventory
- 21
- Price-to-rent
- 149.1×
Monthly cashflow live
- Estimated rent
- $20,428 high interval (Pro) →
- Mortgage (P&I)
- −$11,275
- Tax from tax record
- −$1,292 /mo · $15,505/yr
- Insurance
- −$896
- HOA
- −$0
- Vacancy / Maint / Mgmt
- −$4,290
- Net cashflow
- $2,675
Break-even live
Sensitivity live
| Price | -10% $3,892 | -5% $3,284 | +0% $2,675 | +5% $2,067 | +10% $1,458 |
|---|---|---|---|---|---|
| Rent | -10% $1,062 | -5% $1,868 | +0% $2,675 | +5% $3,482 | +10% $4,289 |
| Rate | -1.0pp $3,758 | -0.5pp $3,222 | base $2,675 | +0.5pp $2,118 | +1.0pp $1,551 |
17-unit breakdown (identical units grouped — click to expand)
| Units | Beds | Baths | Est. rent |
|---|---|---|---|
| 17× units | 1 | 1 | $20,434 |
| #1 | 1 | 1 | $1,202 |
| #2 | 1 | 1 | $1,202 |
| #3 | 1 | 1 | $1,202 |
| #4 | 1 | 1 | $1,202 |
| #5 | 1 | 1 | $1,202 |
| #6 | 1 | 1 | $1,202 |
| #7 | 1 | 1 | $1,202 |
| #8 | 1 | 1 | $1,202 |
| #9 | 1 | 1 | $1,202 |
| #10 | 1 | 1 | $1,202 |
| #11 | 1 | 1 | $1,202 |
| #12 | 1 | 1 | $1,202 |
| #13 | 1 | 1 | $1,202 |
| #14 | 1 | 1 | $1,202 |
| #15 | 1 | 1 | $1,202 |
| #16 | 1 | 1 | $1,202 |
| #17 | 1 | 1 | $1,202 |
| Total (17 units) | $20,428 | ||
UW: 25.0% down · 7.5% · 30yr · 1.5% tax · 5.0% vac · 8.0% maint · 8.0% mgmt
Financing live
Cash to close
- Down payment
- $537,500
- Closing costs
- $64,500
- Reserves months
- —
- Total cash needed
- —
Loan-product check · same deal, 3 products live
Conventional
25% down · 7.5% · 30yr
- Down + closing
- —
- Monthly P&I
- —
- Monthly cashflow
- —
- DSCR
- —
- Eligible?
- —
Personal DTI + credit; lowest rate.
DSCR
20% down · 8.5% · 30yr
- Down + closing
- —
- Monthly P&I
- —
- Monthly cashflow
- —
- DSCR
- —
- Eligible?
- —
No personal income docs; deal must DSCR.
Hard money
10% down · 12.0% · 12mo
- Down + closing
- —
- Monthly P&I
- —
- Monthly cashflow
- —
- DSCR
- —
- Eligible?
- —
Short-term bridge; refi at stabilization.
Listing history 20 events
-
2026-06-22days on market $2,150,000 Active 63 DOM
-
2026-06-18days on market $2,150,000 Active 60 DOM
-
2026-06-17days on market $2,150,000 Active 59 DOM
-
2026-06-16days on market $2,150,000 Active 58 DOM
-
2026-06-15days on market $2,150,000 Active 57 DOM
-
2026-06-14days on market $2,150,000 Active 55 DOM
-
2026-06-13days on market $2,150,000 Active 54 DOM
-
2026-06-10days on market $2,150,000 Active 52 DOM
-
2026-06-09days on market $2,150,000 Active 51 DOM
-
2026-06-08days on market $2,150,000 Active 50 DOM
-
2026-06-07days on market $2,150,000 Active 49 DOM
-
2026-06-05days on market $2,150,000 Active 46 DOM
-
2026-06-03days on market $2,150,000 Active 45 DOM
-
2026-06-02days on market $2,150,000 Active 44 DOM
-
2026-06-01days on market $2,150,000 Active 43 DOM
-
2026-05-31days on market $2,150,000 Active 42 DOM
-
2026-05-30days on market $2,150,000 Active 41 DOM
-
2026-04-19$2,150,000 New 836-char remark
-
2023-01-05soldstatus $1,185,000
-
2005-09-26soldstatus $625,000
ⓘ Source: listings_history table (triggers on properties + properties_extension) + one-shot
backfill from property_details.listing_events for pre-trigger history.
Tax reassessment forecast MA · Partial reset (capped growth)
- Current annual tax
- $15,505 · $1,292/mo
- Projected year-2 tax
- $20,975 · $1,748/mo
- Expected delta
- +$5,470/yr (+$456/mo · 35.3%)
ⓘ Screening estimate from a state-policy table — verify with the county assessor before closing.
Nearby sold comps map
Loading sold comps map…
Walkable amenities ~0.75 mi
Loading nearby amenities…
Taxation est. · year 1
- Rental income
- $245,136
- − Mortgage interest
- −$120,433
- − Property taxes
- −$15,505
- − Insurance
- −$10,750
- − Repairs & maintenance
- −$19,611
- − Management
- −$19,611
- − Depreciation
- −$62,545
- Taxable loss
- −$3,320
- Est. tax savings @ 24.0%
- +$797
- After-tax cash flow
- $32,901/yr
For passive investors: Depreciation is non-cash, so a rental often shows a tax loss while cash-flowing — sheltering income. Rental losses are passive: they offset passive income freely, and up to $25,000/yr can offset ordinary (W-2) income if you actively participate and your MAGI is under $100k (phasing out to $0 by $150k); unused losses carry forward. On sale, claimed depreciation is recaptured at up to 25%, and gains may owe capital-gains tax (a 1031 exchange can defer both). Figures are a year-1 estimate at your 24.0% rate — not tax advice; consult a CPA.
Schools (NCES district)
- District
- Springfield
- NCES district ID
- 2511130
- Math proficiency
- 13% ▼ -12.00%
- Reading proficiency
- 25% ▼ -5.00%
- Median HH income
- $34,938
- Composite
- 15.6/100
- National rank
- #9293
- State rank
- #296 of 302 in MA
Livability — Springfield
- Score
- 73/100
- State rank
- #97
- US rank
- #5195
Category grades
Schools grade is shown separately in the Schools card above.
Census & demographics
- Census place
- Springfield, MA
- City population
- 61,006
- Population (ZIP)
- 11,469
Population outlook (Hampden County) Hauer SSP2
- Today (2025)
- 485,646 people
- By 2030
- 491,517 · +1.2%
- By 2040
- 500,539 · +3.1%
- By 2050
- 508,827 · +4.8%
- By 2075
- 539,167 · +11.0%
- By 2100
- 545,698 · +12.4%
Race, ethnicity, and origin ACS 2023
- Neighborhood character
- Predominantly Hispanic (74%)
- Race & ethnicity
- Hispanic / Latino 74% Two or more races 37% Black 14% White 10%
- Hispanic origin (detail)
- Puerto Rican 63% Dominican 5%
- Common ancestry
- Lithuanian 1% Romanian 1%
- Foreign-born
- 8% · Canada
- Languages at home
- 44% English-only · Spanish 53% Other Indo-European 2% French/Haitian/Cajun 1%
Political lean MEDSL · Hampden
- 2024 margin
- Lean D (+8.9) · D 53.4% · R 44.5% · Other 2.1%
- 2008→2024 swing
- -16.4pp toward R · 2008: 25.3pp · 2024: 8.9pp
- All cycles
- 2024: D+8.9 2020: D+17.7 2016: D+16.0 2012: D+25.4 2008: D+25.3
Not yet ingested
- Civics
- —
Market trends
- HPI YoY
- ▲ 1.08%
- Current HPI
- 322.6127
- Rent YoY
- —
- Metro
- —
- State GDP YoY
- ▲ 2.28%
- F500 in state
- 38
Industry mix (Fortune 500 HQ in MA)
| Industry | F500 HQs | Revenue |
|---|---|---|
| Technology | 3 | $17B |
|
||
| Insurance | 2 | $84B |
|
||
| Retail | 2 | $76B |
|
||
| Life Sciences | 1 | $43B |
|
||
| Energy Technology | 1 | $31B |
|
||
| Aerospace / Defense | 1 | $18B |
|
||
Price history
+244.0% since first listed3 events — show timeline
- 2026-04-19 Listed $2,150,000 MLS PIN
- 2023-01-05 Sold (Public Records) $1,185,000 Public Records
- 2005-09-26 Sold (Public Records) $625,000 Public Records
Property tax history
+5.1%/yrLatest (2023): $15,505 · -4.3% YoY. Source: county tax records.
Cash-flow waterfall
monthlySold comps — $/sqft
last 12 mo · ≤1 miLoading sold comps…