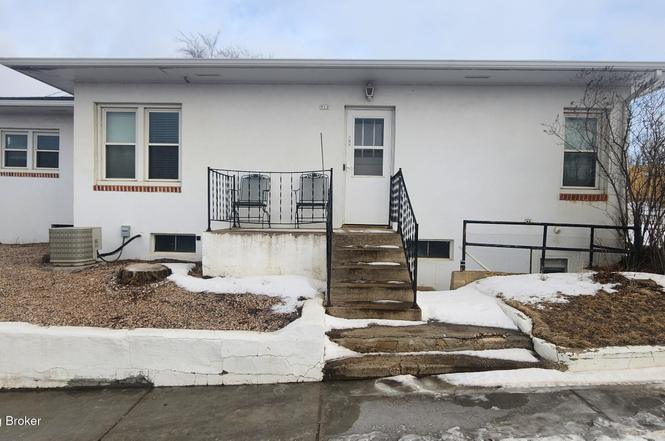
512 Adams Ave · Hettinger, ND
Flood risk No data
- FEMA flood zone
- —
- Chance of flooding over 30 yrs
- —
- Est. flood insurance / yr
- —
Fire risk No data
- Est. fire insurance / yr
- —
Heat risk No data
- Hot days now (above threshold)
- —
- Hot days in 30 yrs
- —
Wind risk No data
- Chance of severe wind over 30 yrs
- —
Air-quality risk No data
- Unhealthy air days now
- —
- Unhealthy air days in 30 yrs
- —
Risk factors via First Street. Map © Google.
Why this score? — see what drove the D+ grade
The composite is a weighted blend of 9 inputs, each scored 0–100. Each bar is that input's sub-score; the figure is the points it added to the 100-point composite (weight × sub-score).
- Cash flow +16.7/30.0
- ARV discount +7.5/15.0
- DSCR +5.2/10.0
- Appreciation +5.0/10.0
- 1% rule +3.6/10.0
- Schools +3.5/10.0
- Livability +3.5/5.0
- Rent growth +2.5/5.0
- Condition / age +2.5/5.0
$145,000
🖨 Deal sheet 📄 Offer letter ✓ Due diligence
Key facts
- Access to parks
- Next to post office
- Functional layout
Tags
Neighborhood map
What this means for you Summary
Snapshot
- This is a 3-bed/1.5-bath other listed at $145k.
Deal economics
- At list price, monthly cash flow is $90 ($1k/yr) — positive.
- The deal already cash-flows at list — no discount required.
- To meet the 1% rule (rent ≥ 1% of price), the offer needs to be $124k (14.2% below list).
- Recommended offer: $124k (14.2% below list) — sets the bar for 1% rule.
Location & tenants
- Location reads 69/100 on livability (#94 in ND) — a middle-class / working-renter tenant base. Strengths: crime A+, cost of living A+; Watch: employment D+, health & safety D+, amenities F.
- Hettinger 13 (rural): math 30% / reading 45% proficiency, ranked #118 of 169 in ND (top 70%) — families likely to look elsewhere, expect single-tenant / working-renter base with shorter leases; only 17% free/reduced lunch — higher-income household profile.
- Market conditions: 20 active listings in the ZIP.
Forward outlook
- In year one you build about $5k of equity ($1k loan paydown + $4k appreciation (3.0% local appreciation)).
- Adams County population projected to shrink 4% by 2050 — rents likely to lag national; underwrite the cash flow, not the appreciation.
- At projected returns (3.0% appreciation + 3.0% rent growth), your $41k cash investment doubles in ~6 years — after that, you're playing with house money.
- By year 7, paydown + projected appreciation supports a ~$34k cash-out refi (75% LTV) — recoverable capital for the next deal without selling this one.
Negotiation context
- Only 4 days on market — expect competitive offers; lowballing is unlikely to land.
Risks & watch-outs
- Watch-outs: built in 1947 — expect roof / HVAC / electrical / plumbing capex.
Questions for the listing agent
- Built in 1947 — when were the roof, HVAC, electrical panel, plumbing, and water heater last replaced?
- Is there a deadline driving the sale (1031 exchange, divorce, estate, relocation)? That informs how much negotiation room exists.
- The area grade is low — what's the realistic commute time and amenity access for the typical tenant pool here? Any planned neighborhood developments (good or bad) we should know about?
- What's the average days-on-market for RENTAL listings here right now (not sales)? A rising rental-DOM trend means longer vacancies and softer asking-rent achievability than the comps imply.
- What's the recent tenant-quality profile in this submarket — average credit score on applications, eviction rate, late-payment / NSF rate, and stable-employment percentage? A property-management company in the area should have these aggregated.
- How much new for-sale + rental construction is in the pipeline within 1–3 miles? Heavy new supply typically softens prices + rents 12–24 months out; constrained supply supports both.
Investment metrics
- 1% rule
- 0.86% ✗
- Cap rate
- 7.04%
- Cash-on-cash
- 2.67%
- DSCR
- 1.12
- GRM
- 9.7
CMA / ARV
No comps found within radius.
Projected returns pro-forma
3.0% appreciation · 3.0% rent growth · sell at horizon
- IRR
- 10.0%
- Equity multiple
- 1.57×
- Total profit
- $23,178
- Equity at exit
- $65,198
- IRR
- 12.3%
- Equity multiple
- 2.83×
- Total profit
- $74,396
- Equity at exit
- $100,478
Cash invested: $40,600 (down + closing). Projections, not guarantees.
Landlord ↔ Tenant lean methodology
- Overall (STATE)
- 82 Strongly Landlord-Friendly
- State North Dakota
- 82 Strongly Landlord-Friendly · R+20
- County
- — inherits STATE
- City
- — inherits STATE
ZIP-level market 58639
- Active inventory
- 20
- Price-to-rent
- 9.7×
Monthly cashflow live
- Estimated rent
- $1,244 medium interval (Pro) →
- Mortgage (P&I)
- −$760
- Tax from tax record
- −$72 /mo · $860/yr
- Insurance
- −$60
- HOA
- −$0
- Vacancy / Maint / Mgmt
- −$261
- Net cashflow
- $90
Break-even live
UW: 25.0% down · 7.5% · 30yr · 1.5% tax · 5.0% vac · 8.0% maint · 8.0% mgmt
Financing live
Cash to close
- Down payment
- $36,250
- Closing costs
- $4,350
- Reserves months
- —
- Total cash needed
- —
Loan-product check · same deal, 3 products live
Conventional
25% down · 7.5% · 30yr
- Down + closing
- —
- Monthly P&I
- —
- Monthly cashflow
- —
- DSCR
- —
- Eligible?
- —
Personal DTI + credit; lowest rate.
DSCR
20% down · 8.5% · 30yr
- Down + closing
- —
- Monthly P&I
- —
- Monthly cashflow
- —
- DSCR
- —
- Eligible?
- —
No personal income docs; deal must DSCR.
Hard money
10% down · 12.0% · 12mo
- Down + closing
- —
- Monthly P&I
- —
- Monthly cashflow
- —
- DSCR
- —
- Eligible?
- —
Short-term bridge; refi at stabilization.
Listing history 2 events
-
2026-04-12status Pending
-
2026-02-18$145,000 Active
ⓘ Source: listings_history table (triggers on properties + properties_extension) + one-shot
backfill from property_details.listing_events for pre-trigger history.
Tax reassessment forecast ND · Resets to sale price
- Current annual tax
- $860 · $72/mo
- Projected year-2 tax
- $1,421 · $118/mo
- Expected delta
- +$560/yr (+$47/mo · 65.1%)
ⓘ Screening estimate from a state-policy table — verify with the county assessor before closing.
Nearby sold comps map
Loading sold comps map…
Walkable amenities ~0.75 mi
Loading nearby amenities…
Taxation est. · year 1
- Rental income
- $14,931
- − Mortgage interest
- −$8,122
- − Property taxes
- −$860
- − Insurance
- −$725
- − Repairs & maintenance
- −$1,194
- − Management
- −$1,194
- − Depreciation
- −$4,218
- Taxable loss
- −$1,384
- Est. tax savings @ 24.0%
- +$332
- After-tax cash flow
- $1,417/yr
For passive investors: Depreciation is non-cash, so a rental often shows a tax loss while cash-flowing — sheltering income. Rental losses are passive: they offset passive income freely, and up to $25,000/yr can offset ordinary (W-2) income if you actively participate and your MAGI is under $100k (phasing out to $0 by $150k); unused losses carry forward. On sale, claimed depreciation is recaptured at up to 25%, and gains may owe capital-gains tax (a 1031 exchange can defer both). Figures are a year-1 estimate at your 24.0% rate — not tax advice; consult a CPA.
Schools (NCES district)
- District
- Hettinger 13
- NCES district ID
- 3809410
- Math proficiency
- 30% ▼ -10.00%
- Reading proficiency
- 45% ▼ -10.00%
- Median HH income
- $46,531
- Composite
- 34.59/100
- National rank
- #10096
- State rank
- #118 of 169 in ND
Livability — Hettinger
- Score
- 69/100
- State rank
- #94
- US rank
- #8171
Category grades
Schools grade is shown separately in the Schools card above.
Census & demographics
- Census place
- Hettinger, ND
- Population (ZIP)
- 1,715
Population outlook (Adams County) Hauer SSP2
- Today (2025)
- 2,371 people
- By 2030
- 2,359 · -0.5%
- By 2040
- 2,320 · -2.2%
- By 2050
- 2,278 · -3.9%
- By 2075
- 2,328 · -1.8%
- By 2100
- 2,230 · -5.9%
Race, ethnicity, and origin ACS 2023
- Neighborhood character
- Predominantly White (87%)
- Race & ethnicity
- White 87% Two or more races 10% Hispanic / Latino 6% Native American 1%
- Hispanic origin (detail)
- Mexican 6%
- Common ancestry
- Portuguese 19% Romanian 3% Serbian 2%
- Foreign-born
- 3% · Canada
- Languages at home
- 92% English-only · Spanish 5% German/W. Germanic 1%
Political lean MEDSL · Adams
- 2024 margin
- Solid R (+62.7) · D 18.1% · R 80.8% · Other 1.2%
- 2008→2024 swing
- -35.0pp toward R · 2008: -27.8pp · 2024: -62.7pp
- All cycles
- 2024: R+62.7 2020: R+57.0 2016: R+57.0 2012: R+45.9 2008: R+27.8
Not yet ingested
- Civics
- —
Market trends
- HPI YoY
- —
- Current HPI
- —
- Rent YoY
- —
- Metro
- —
- State GDP YoY
- ▲ 2.09%
- F500 in state
- 2
Industry mix (Fortune 500 HQ in ND)
| Industry | F500 HQs | Revenue |
|---|---|---|
| Utilities / Construction | 1 | $6B |
|
||
Price history
2 events — show timeline
- 2026-04-12 Pending — Badlands BOR MLS
- 2026-02-18 Listed $145,000 Badlands BOR MLS
Property tax history
+4.4%/yrLatest (2025): $860 · -1.0% YoY. Source: county tax records.
Cash-flow waterfall
monthlySold comps — $/sqft
last 12 mo · ≤1 miLoading sold comps…