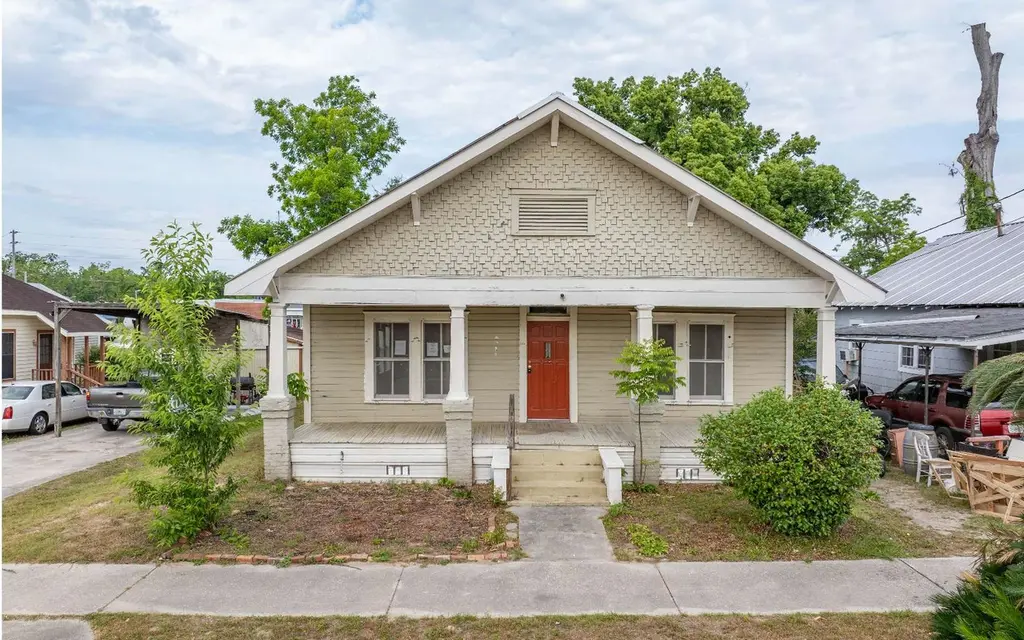
692 Range Ave · Madison, FL
Flood risk 1/10 · Minimal
- FEMA flood zone
- X (unshaded)
- Chance of flooding over 30 yrs
- 0.0%
- Est. flood insurance / yr
- $507 – $1,088
Fire risk 6/10 · Moderate
- Est. fire insurance / yr
- $947 – $1,759
Heat risk 8/10 · Major
- Hot days now (above 108°F)
- 7 days/yr
- Hot days in 30 yrs
- 21 days/yr
Wind risk 9/10 · Severe
- Chance of severe wind over 30 yrs
- 99.0%
Air-quality risk 6/10 · Moderate
- Unhealthy air days now
- 11 days/yr
- Unhealthy air days in 30 yrs
- 12 days/yr
Risk factors via First Street. Map © Google.
Why this score? — see what drove the B+ grade
The composite is a weighted blend of 9 inputs, each scored 0–100. Each bar is that input's sub-score; the figure is the points it added to the 100-point composite (weight × sub-score).
- Cash flow +28.9/30.0
- DSCR +10.0/10.0
- Appreciation +10.0/10.0
- 1% rule +8.7/10.0
- ARV discount +7.5/15.0
- Livability +3.5/5.0
- Schools +3.3/10.0
- Rent growth +2.5/5.0
- Condition / age +2.5/5.0
$99,900
🖨 Deal sheet (PDF) 📄 Offer letter ✓ Due diligence
Listing remarks MLS
Don't miss this newly remodeled, home on 1/4 acre with beautifully spacious floorplan. Featuring a beautiful porch and spacious back room. Located on a double lot with multiple fruit trees in the backyard. Pull through carport allows access to SW Range Ave. and SW Horrey Ave. NEW Central air and heat included with purchase. Upgrades include newer 2-year-old metal roof, exterior and interior paint, new drywall, flooring, and tile in the kitchen. New toilets and tub/shower combo and puck lights. New attic insulation and duct work are just some of the upgrades that make this home a must see. Located in beautiful Madison, just a few miles from some of the best hunting Florida has to offer. Combine that with the pull through driveway, this could be the perfect spot for those who want to pull trailers into a fenced yard. This won't last long.
Key facts
- Flexible floor plan
- Large backyard
- In-town location
Tags
Property features AI
Exterior
- Home design: Single-story residential home; Zoned R-2
- Construction: Frame construction; Metal roof
- Exterior features: Chain link fencing; Approximately 50 x 196 lot
Interior
- Bathrooms: 2 full bathrooms
- Heating & cooling: Central electric heating; Central air; Ceiling fans
- Interior features: Ceiling fans; Central air
Neighborhood map
What this means for you Summary
Snapshot
- This is a 4-bed/2.0-bath single-family listed at $100k.
Deal economics
- At list price, monthly cash flow is $338 ($4k/yr) — positive.
- The deal already cash-flows at list — no discount required.
- Meets the 1% rule at list price ($1k rent vs $100k).
- Cap rate 10.4% vs local median 2.6% in Madison — top-decile yield for the area; either an underpriced asset or a hidden risk that comps aren't pricing in. Stress-test before assuming the spread holds.
Location & tenants
- Location reads 70/100 on livability (#437 in FL) — a middle-class / working-renter tenant base. Strengths: cost of living A+, health & safety A+, crime A; Watch: housing D+, amenities F, commute F.
- Madison (rural): math 39% / reading 40% proficiency, ranked #64 of 73 in FL (top 88%) — families likely to look elsewhere, expect single-tenant / working-renter base with shorter leases; 75% free/reduced lunch — lower-income household profile, screen leases tightly.
- Zoned schools: Madison County Central School (math 26% / reading 29%, grade F, #1,962 of 2,144 statewide, top 92%, 846 students, 80% FRL); Madison County High School (math 27% / reading 32%, grade F, #447 of 667 statewide, top 68%, 468 students, 59% FRL) — zoned schools at 70% FRL track the district average.
- Market conditions: 97 active listings in the ZIP; 31 units permitted in Madison County in 2024 (0 in 5+ unit buildings).
Forward outlook
- In year one you build about $11k of equity ($691 loan paydown + $10k appreciation (10.0% local appreciation)).
- Madison County population projected at -29% by 2050 — secular population decline; favor cash flow + early exit over multi-decade hold.
- At projected returns (10.0% appreciation + 3.0% rent growth), your $28k cash investment doubles in ~2 years — after that, you're playing with house money.
- By year 4, paydown + projected appreciation supports a ~$38k cash-out refi (75% LTV) — recoverable capital for the next deal without selling this one.
Negotiation context
- Only 8 days on market — expect competitive offers; lowballing is unlikely to land.
- 4 sale attempts since 11y ago with the ask held roughly flat each time — persistent listings suggest the price (not the market) is what's stuck; bring a comps-based counter.
Risks & watch-outs
- Watch-outs: built in 1910 — expect roof / HVAC / electrical / plumbing capex.
- Climate carrying-cost: severe wind risk, 99% chance of damaging wind over 30y; major wildfire risk; extreme-heat days projected 7→21/yr by 2055 (HVAC capex compounding) — expect insurance premiums to compound above CPI over the hold.
Questions for the listing agent
- Built in 1910 — when were the roof, HVAC, electrical panel, plumbing, and water heater last replaced?
- Is there a deadline driving the sale (1031 exchange, divorce, estate, relocation)? That informs how much negotiation room exists.
- What's the average days-on-market for RENTAL listings here right now (not sales)? A rising rental-DOM trend means longer vacancies and softer asking-rent achievability than the comps imply.
- What's the recent tenant-quality profile in this submarket — average credit score on applications, eviction rate, late-payment / NSF rate, and stable-employment percentage? A property-management company in the area should have these aggregated.
- How much new for-sale + rental construction is in the pipeline within 1–3 miles? Heavy new supply typically softens prices + rents 12–24 months out; constrained supply supports both.
Investment metrics
- 1% rule
- 1.37% ✓
- Cap rate
- 10.35%
- Cash-on-cash
- 14.50%
- DSCR
- 1.65
- GRM
- 6.1
CMA / ARV
- ARV (on-the-fly)
- $219,780
- Comps found
- 4
Show comp detail 4 sales within ~0.75 mi
| Address | Dist | Beds/Ba | Sqft | Sold | Price | $/sf | Match |
|---|---|---|---|---|---|---|---|
| 310 SW Meeting Ave | 0.41mi | 3/3.0 (-1) | 2,095 (+5%) | 9mo | $230,000 | $110 | 56 |
| 293 W Base St | 0.64mi | 3/2.0 (-1) | 1,934 (-3%) | 13mo | $165,000 | $85 | 49 |
| 146 SE Pope Ave | 0.74mi | 3/2.0 (-1) | 1,956 (-2%) | 10mo | $139,000 | $71 | 48 |
| 135 SE Park Loop | 0.58mi | 3/2.0 (-1) | 1,741 (-13%) | 21mo | $213,500 | $123 | 28 |
Match score weights: distance 35% · size 25% · config 20% · recency 20%. Top-matched comps best support the ARV.
Projected returns pro-forma
10.0% appreciation · 3.0% rent growth · sell at horizon
- IRR
- 35.0%
- Equity multiple
- 3.72×
- Total profit
- $75,994
- Equity at exit
- $89,998
- IRR
- 30.2%
- Equity multiple
- 8.40×
- Total profit
- $206,957
- Equity at exit
- $194,084
Cash invested: $27,972 (down + closing). Projections, not guarantees.
Landlord ↔ Tenant lean methodology
- Overall (STATE)
- 87 Strongly Landlord-Friendly
- State Florida
- 87 Strongly Landlord-Friendly · R+3
- County
- — inherits STATE
- City
- — inherits STATE
ZIP-level market 32340
- Home prices YoY
- 32.0%
- Active inventory
- 97
- Price-to-rent
- 6.1×
Monthly cashflow live
- Estimated rent
- $1,365 medium interval (Pro) →
- Mortgage (P&I)
- −$524
- Tax from tax record
- −$175 /mo · $2,099/yr
- Insurance
- −$42
- HOA
- −$0
- Vacancy / Maint / Mgmt
- −$287
- Net cashflow
- $338
Break-even live
Sensitivity live
| Price | -10% $395 | -5% $366 | +0% $338 | +5% $310 | +10% $282 |
|---|---|---|---|---|---|
| Rent | -10% $230 | -5% $284 | +0% $338 | +5% $392 | +10% $446 |
| Rate | -1.0pp $388 | -0.5pp $364 | base $338 | +0.5pp $312 | +1.0pp $286 |
UW: 25.0% down · 7.5% · 30yr · 1.5% tax · 5.0% vac · 8.0% maint · 8.0% mgmt
Financing live
Cash to close
- Down payment
- $24,975
- Closing costs
- $2,997
- Reserves months
- —
- Total cash needed
- —
Loan-product check · same deal, 3 products live
Conventional
25% down · 7.5% · 30yr
- Down + closing
- —
- Monthly P&I
- —
- Monthly cashflow
- —
- DSCR
- —
- Eligible?
- —
Personal DTI + credit; lowest rate.
DSCR
20% down · 8.5% · 30yr
- Down + closing
- —
- Monthly P&I
- —
- Monthly cashflow
- —
- DSCR
- —
- Eligible?
- —
No personal income docs; deal must DSCR.
Hard money
10% down · 12.0% · 12mo
- Down + closing
- —
- Monthly P&I
- —
- Monthly cashflow
- —
- DSCR
- —
- Eligible?
- —
Short-term bridge; refi at stabilization.
Listing history 8 events
-
2026-06-19days on market $99,900 Active 8 DOM
-
2026-06-18days on market $99,900 Active 7 DOM
-
2026-06-17days on market $99,900 Active 6 DOM
-
2026-06-16days on market $99,900 Active 5 DOM
-
2026-06-15days on market $99,900 Active 4 DOM
-
2026-06-14days on market $99,900 Active 2 DOM
-
2026-06-13remarks 699-char remark
-
2026-06-13$99,900 Active 1 DOM
ⓘ Source: listings_history table (triggers on properties + properties_extension) + one-shot
backfill from property_details.listing_events for pre-trigger history.
Tax reassessment forecast FL · Resets to sale price
- Current annual tax
- $2,099 · $175/mo
- Projected year-2 tax
- $2,099 · $175/mo
- Expected delta
- $0/yr ($0/mo · 0.0%)
ⓘ Screening estimate from a state-policy table — verify with the county assessor before closing.
Climate risk First Street
- Flood 1/10 Low FEMA zone X (unshaded) · 0% chance over 30 yrs
- Wildfire 6/10 Major
- Heat 8/10 Severe 7 d/yr ≥108°F today · 21 d/yr by 30 yrs out
- Wind 9/10 Extreme 99% chance of damaging wind over 30 yrs
- Air quality 6/10 Major 11 unhealthy d/yr today · 12 by 30 yrs out
Nearby sold comps map
Loading sold comps map…
Walkable amenities ~0.75 mi
Loading nearby amenities…
Taxation est. · year 1
- Rental income
- $16,382
- − Mortgage interest
- −$5,596
- − Property taxes
- −$2,099
- − Insurance
- −$500
- − Repairs & maintenance
- −$1,311
- − Management
- −$1,311
- − Depreciation
- −$2,906
- Taxable income
- $2,661
- Est. tax owed @ 24.0%
- −$639
- After-tax cash flow
- $3,419/yr
For passive investors: Depreciation is non-cash, so a rental often shows a tax loss while cash-flowing — sheltering income. Rental losses are passive: they offset passive income freely, and up to $25,000/yr can offset ordinary (W-2) income if you actively participate and your MAGI is under $100k (phasing out to $0 by $150k); unused losses carry forward. On sale, claimed depreciation is recaptured at up to 25%, and gains may owe capital-gains tax (a 1031 exchange can defer both). Figures are a year-1 estimate at your 24.0% rate — not tax advice; consult a CPA.
Schools (NCES district)
- District
- Madison
- NCES district ID
- 1201200
- Math proficiency
- 39% ▼ -5.00%
- Reading proficiency
- 40% ▼ -2.00%
- Median HH income
- $33,925
- Composite
- 32.54/100
- National rank
- #5693
- State rank
- #64 of 73 in FL
Livability — Madison
- Score
- 70/100
- State rank
- #437
- US rank
- #7819
Category grades
Schools grade is shown separately in the Schools card above.
Census & demographics
- Census place
- Madison, FL
- Population (ZIP)
- 10,424
Population outlook (Madison County) Hauer SSP2
- Today (2025)
- 16,849 people
- By 2030
- 15,883 · -5.7%
- By 2040
- 13,861 · -17.7%
- By 2050
- 11,918 · -29.3%
- By 2075
- 7,810 · -53.6%
- By 2100
- 4,684 · -72.2%
Race, ethnicity, and origin ACS 2023
- Neighborhood character
- Diverse neighborhood (Simpson 0.56)
- Race & ethnicity
- White 50% Black 43% Two or more races 5% Hispanic / Latino 3%
- Common ancestry
- Slovak 1% Iranian 1% Serbian 1%
- Foreign-born
- 2% · Canada
- Languages at home
- 97% English-only · Spanish 2%
Political lean MEDSL · Madison
- 2024 margin
- Strong R (+28.9) · D 35.3% · R 64.2%
- 2008→2024 swing
- -25.8pp toward R · 2008: -3.1pp · 2024: -28.9pp
- All cycles
- 2024: R+28.9 2020: R+19.5 2016: R+15.6 2012: R+3.4 2008: R+3.1
Not yet ingested
- Civics
- —
Market trends
- HPI YoY
- ▲ 65.13%
- Current HPI
- 268.8459
- Rent YoY
- —
- Metro
- —
- State GDP YoY
- ▲ 3.28%
- F500 in state
- 36
Industry mix (Fortune 500 HQ in FL)
| Industry | F500 HQs | Revenue |
|---|---|---|
| Industrial Technology | 2 | $29B |
|
||
| Insurance | 2 | $17B |
|
||
| Retail | 1 | $60B |
|
||
| Technology Distribution | 1 | $58B |
|
||
| Homebuilding | 1 | $35B |
|
||
| Technology Manufacturing | 1 | $35B |
|
||
Price history
+233.0% since first listed9 events — show timeline
- 2026-06-11 Listed $99,900 NFMLS
- 2022-05-23 Sold (Public Records) $134,000 Public Records
- 2022-05-17 Sold (MLS) $134,000 Stellar MLS as Distributed by MLS Grid
- 2022-04-12 Pending — Stellar MLS as Distributed by MLS Grid
- 2022-03-10 Listed $130,000 Stellar MLS as Distributed by MLS Grid
- 2018-03-20 Sold (Public Records) $56,100 Public Records
- 2017-06-08 Listed $10,000 CATRS
- 2015-10-08 Listing Removed — CATRS
- 2015-07-08 Listed $30,000 CATRS
Property tax history
+4.0%/yrLatest (2025): $2,099 · -4.5% YoY. Source: county tax records.
Cash-flow waterfall
monthlySold comps — $/sqft
last 12 mo · ≤1 miLoading sold comps…