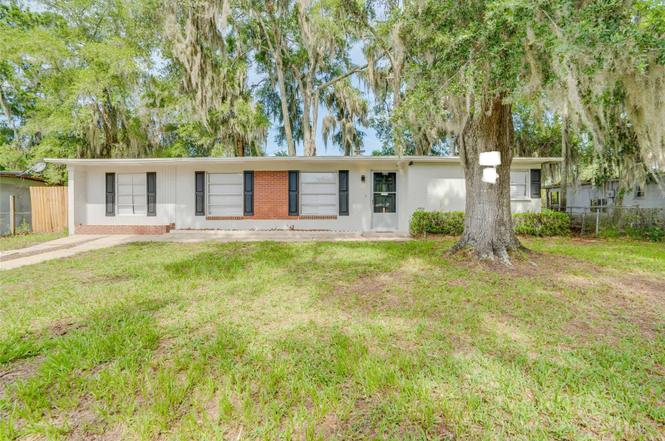
444 SE Castillo Ter · Lake City, FL
Flood risk 1/10 · Minimal
- FEMA flood zone
- X (unshaded)
- Chance of flooding over 30 yrs
- 0.0%
- Est. flood insurance / yr
- $507 – $1,088
Fire risk 5/10 · Moderate
- Est. fire insurance / yr
- $947 – $1,759
Heat risk 8/10 · Major
- Hot days now (above 107°F)
- 7 days/yr
- Hot days in 30 yrs
- 20 days/yr
Wind risk 9/10 · Severe
- Chance of severe wind over 30 yrs
- 99.0%
Air-quality risk 5/10 · Moderate
- Unhealthy air days now
- 9 days/yr
- Unhealthy air days in 30 yrs
- 10 days/yr
Risk factors via First Street. Map © Google.
Why this score? — see what drove the D+ grade
The composite is a weighted blend of 9 inputs, each scored 0–100. Each bar is that input's sub-score; the figure is the points it added to the 100-point composite (weight × sub-score).
- Cash flow +14.3/30.0
- Appreciation +10.0/10.0
- Schools +4.5/10.0
- DSCR +4.3/10.0
- Livability +3.7/5.0
- 1% rule +3.3/10.0
- Rent growth +2.5/5.0
- Condition / age +2.5/5.0
- ARV discount +0.0/15.0
$217,000
🖨 Deal sheet 📄 Offer letter ✓ Due diligence
Listing remarks
Newly Renovated 4Bed 2Bath Home in Lake City, FL near the beautiful Springs. This stunning home offers modern amenities, fixtures, recess lighting, and LED smart mirrors with classic charm! Featuring an open- split floor plan concept layout, perfect for entertaining guest and privacy. The kitchen features new stainless steel appliances, custom cabinets with touch of Gold, classic backsplash & countertops. Enjoy the luxurious master suite with a en-suite bath. 2 fully updated bathrooms with 3 additional spacious bedrooms provide ample space for family and guests. The expansive backyard and patio area perfect for outdoor fire-pit & BBQ. Located in quite neighborhood with easy acce
Key facts
- 7,187 sq ft lot
- Built 1958
- Listed 655 days
Property features AI
Finance
- Other: Property identified as zoning X; No waterfront; Universal property ID on file
- Financial info: No lease restrictions; Property is residential (single family); Lot about 0.16 acres (0 to less than 1/4 acre)
- HOA & community: No HOA association listed
Exterior
- Parking: No parking information listed
- Security: No security features listed
- Utilities: No water source listed; No sewer listed; Other utilities
- Home design: Single family residence; One story; Facing east
- Construction: Other construction materials; Built-up roof; Other foundation details; Approximately built area 1,536 square feet
- Exterior features: Other exterior features
Interior
- Kitchen: No appliances listed
- Bedrooms: 4 bedrooms
- Flooring: Carpet flooring
- Bathrooms: 2 full bathrooms
- Heating & cooling: No heating listed; No cooling listed
- Interior features: No interior features listed
- Laundry & utility: No laundry features listed
Neighborhood map
What this means for you Summary
Snapshot
- This is a 3-bed/1.0-bath single-family listed at $217k.
Deal economics
- At list price, monthly cash flow is $39 ($468/yr) — positive.
- The deal already cash-flows at list — no discount required.
- To meet the 1% rule (rent ≥ 1% of price), the offer needs to be $179k (17.4% below list).
- Recommended offer: $179k (17.4% below list) — sets the bar for 1% rule.
- Cap rate 6.5% vs local median 3.7% in Lake City — top-decile yield for the area; either an underpriced asset or a hidden risk that comps aren't pricing in. Stress-test before assuming the spread holds.
Location & tenants
- Location reads 73/100 on livability (#304 in FL) — a middle-class / working-renter tenant base. Strengths: cost of living A+, housing A+, health & safety A+; Watch: amenities C-, commute F, employment F.
- Columbia (town): math 53% / reading 54% proficiency, ranked #25 of 73 in FL (top 34%) — acceptable for families but not a draw, mixed tenant base, ~2y average lease.
- Market conditions: 143 active listings in the ZIP; 178 units permitted in Columbia County in 2024 (0 in 5+ unit buildings).
Forward outlook
- In year one you build about $23k of equity ($2k loan paydown + $22k appreciation (10.0% local appreciation)).
- Columbia County population projected to shrink 7% by 2050 — rents likely to lag national; underwrite the cash flow, not the appreciation.
- At projected returns (10.0% appreciation + 3.0% rent growth), your $61k cash investment doubles in ~3 years — after that, you're playing with house money.
- By year 2, paydown + projected appreciation supports a ~$37k cash-out refi (75% LTV) — recoverable capital for the next deal without selling this one.
Negotiation context
- It's been on market 656 days — a 12% lower offer ($191k) is reasonable based on typical stale-listing flexibility.
- 5 sale attempts since 2y ago; this cycle's ask has dropped $12k (5%) from the opening price — seller is motivated, your offer sets the floor, not the list.
- Current owner paid $65k; list at $217k implies a 234% gain — meaningful room to come down on a strong offer.
Risks & watch-outs
- Watch-outs: built in 1958 — expect roof / HVAC / electrical / plumbing capex.
- Climate carrying-cost: severe wind risk, 99% chance of damaging wind over 30y; moderate wildfire risk; extreme-heat days projected 7→20/yr by 2055 (HVAC capex compounding) — expect insurance premiums to compound above CPI over the hold.
Questions for the listing agent
- It's been on market 656 days. Have you received any prior offers? Is the seller open to a 17% concession, seller financing, or rate buy-down credit?
- Built in 1958 — when were the roof, HVAC, electrical panel, plumbing, and water heater last replaced?
- Why hasn't it sold? Are there any deal-killer items the seller is aware of (foundation, flood, title, zoning, code violations)?
- Is there a deadline driving the sale (1031 exchange, divorce, estate, relocation)? That informs how much negotiation room exists.
- Schools are B-rated — typically a magnet for longer-tenancy family renters. What's the average tenant stay here, and is there a school-zone premium baked into asking?
- The area grade is low — what's the realistic commute time and amenity access for the typical tenant pool here? Any planned neighborhood developments (good or bad) we should know about?
- What's the average days-on-market for RENTAL listings here right now (not sales)? A rising rental-DOM trend means longer vacancies and softer asking-rent achievability than the comps imply.
- What's the recent tenant-quality profile in this submarket — average credit score on applications, eviction rate, late-payment / NSF rate, and stable-employment percentage? A property-management company in the area should have these aggregated.
- How much new for-sale + rental construction is in the pipeline within 1–3 miles? Heavy new supply typically softens prices + rents 12–24 months out; constrained supply supports both.
Investment metrics
- 1% rule
- 0.83% ✗
- Cap rate
- 6.51%
- Cash-on-cash
- 0.77%
- DSCR
- 1.03
- GRM
- 10.1
CMA / ARV
- ARV (on-the-fly)
- $172,640
- Comps found
- 12
Show comp detail 12 sales within ~0.75 mi
| Address | Dist | Beds/Ba | Sqft | Sold | Price | $/sf | Match |
|---|---|---|---|---|---|---|---|
| 246 SE Lochlynn Ter | 0.18mi | 3/2.0 | 1,340 (+1%) | 6mo | $259,000 | $193 | 81 |
| 492 SE Lomond Ave | 0.23mi | 3/1.0 | 1,390 (+5%) | 6mo | $112,500 | $81 | 76 |
| 1047 SE Putnam St | 0.17mi | 3/2.5 | 1,256 (-5%) | 3mo | $76,500 | $61 | 75 |
| 319 SE Avalon Ave | 0.24mi | 3/3.0 | 1,344 (+1%) | 8mo | $174,400 | $130 | 72 |
| 993 SE Putnam St | 0.14mi | 4/2.0 (+1) | 1,438 (+8%) | 6mo | $165,000 | $115 | 66 |
| 823 NE Elsey Pl | 0.43mi | 3/2.0 | 1,236 (-7%) | 5mo | $265,000 | $214 | 60 |
| 570 SE Sunflower Pl | 0.52mi | 3/2.0 | 1,400 (+5%) | 8mo | $264,500 | $189 | 56 |
| 268 NE Anderson Ter | 0.52mi | 3/2.0 | 1,418 (+7%) | 6mo | $125,000 | $88 | 55 |
| 849 NE Maple Ln | 0.54mi | 3/2.0 | 1,180 (-11%) | 1mo | $95,000 | $81 | 52 |
| 493 SE Church Ave | 0.56mi | 2/2.0 (-1) | 1,440 (+8%) | 2mo | $187,500 | $130 | 49 |
| 240 SE Cameron Ter | 0.72mi | 3/2.0 | 1,225 (-8%) | 5mo | $235,000 | $192 | 45 |
| 211 NE Bradley Ter | 0.46mi | 4/2.0 (+1) | 1,136 (-14%) | 3mo | $125,000 | $110 | 44 |
Match score weights: distance 35% · size 25% · config 20% · recency 20%. Top-matched comps best support the ARV.
Projected returns pro-forma
10.0% appreciation · 3.0% rent growth · sell at horizon
- IRR
- 24.8%
- Equity multiple
- 2.99×
- Total profit
- $120,620
- Equity at exit
- $195,491
- IRR
- 21.9%
- Equity multiple
- 6.81×
- Total profit
- $353,157
- Equity at exit
- $421,583
Cash invested: $60,760 (down + closing). Projections, not guarantees.
Landlord ↔ Tenant lean methodology
- Overall (STATE)
- 87 Strongly Landlord-Friendly
- State Florida
- 87 Strongly Landlord-Friendly · R+3
- County
- — inherits STATE
- City
- — inherits STATE
ZIP-level market 32025
- Home prices YoY
- 6.8%
- Active inventory
- 143
- Price-to-rent
- 10.1×
Monthly cashflow live
- Estimated rent
- $1,792 medium interval (Pro) →
- Mortgage (P&I)
- −$1,138
- Tax from tax record
- −$149 /mo · $1,783/yr
- Insurance
- −$90
- HOA
- −$0
- Vacancy / Maint / Mgmt
- −$376
- Net cashflow
- $39
Break-even live
UW: 25.0% down · 7.5% · 30yr · 1.5% tax · 5.0% vac · 8.0% maint · 8.0% mgmt
Financing live
Cash to close
- Down payment
- $54,250
- Closing costs
- $6,510
- Reserves months
- —
- Total cash needed
- —
Loan-product check · same deal, 3 products live
Conventional
25% down · 7.5% · 30yr
- Down + closing
- —
- Monthly P&I
- —
- Monthly cashflow
- —
- DSCR
- —
- Eligible?
- —
Personal DTI + credit; lowest rate.
DSCR
20% down · 8.5% · 30yr
- Down + closing
- —
- Monthly P&I
- —
- Monthly cashflow
- —
- DSCR
- —
- Eligible?
- —
No personal income docs; deal must DSCR.
Hard money
10% down · 12.0% · 12mo
- Down + closing
- —
- Monthly P&I
- —
- Monthly cashflow
- —
- DSCR
- —
- Eligible?
- —
Short-term bridge; refi at stabilization.
Listing history 44 events
-
2026-06-19days on market $217,000 Active 656 DOM
-
2026-06-18days on market $217,000 Active 655 DOM
-
2026-06-17days on market $217,000 Active 654 DOM
-
2026-06-16days on market $217,000 Active 653 DOM
-
2026-06-15days on market $217,000 Active 652 DOM
-
2026-06-14days on market $217,000 Active 650 DOM
-
2026-06-12days on market $217,000 Active 649 DOM
-
2026-06-09days on market $217,000 Active 646 DOM
-
2026-06-08days on market $217,000 Active 645 DOM
-
2026-06-07days on market $217,000 Active 644 DOM
-
2026-06-05days on market $217,000 Active 641 DOM
-
2026-06-03days on market $217,000 Active 640 DOM
-
2026-06-02days on market $217,000 Active 639 DOM
-
2026-06-01days on market $217,000 Active 638 DOM
-
2026-05-31days on market $217,000 Active 637 DOM
-
2026-05-30days on market $217,000 Active 636 DOM
-
2026-04-29status Active
-
2026-04-20status Pending
-
2026-04-06price $217,000
-
2026-03-27price $217,898
-
2026-02-23price $217,900
-
2026-02-13price $219,900
-
2026-01-13price $219,000
-
2026-01-07price $217,000
-
2025-10-17price $219,000
-
2025-10-11price $219,990
-
2025-08-29price $219,000
-
2025-08-22price $229,000
-
2025-03-12price $229,990
-
2025-01-02price $229,999
-
2024-11-27$229,000 Active
-
2024-11-14price $229,000
-
2024-11-07price $229,999
-
2024-11-06status Active
-
2024-10-03price $219,000
-
2024-09-29price $229,000
-
2024-09-17price $239,899
-
2024-08-28price $239,900
-
2024-08-28status Active
-
2024-07-25$229,900 Active
-
2021-08-11soldstatus $65,000
-
2021-04-14soldstatus $65,000
-
1995-11-01soldstatus $29,200
-
1990-03-01soldstatus $29,000
ⓘ Source: listings_history table (triggers on properties + properties_extension) + one-shot
backfill from property_details.listing_events for pre-trigger history.
Tax reassessment forecast FL · Resets to sale price
- Current annual tax
- $1,783 · $149/mo
- Projected year-2 tax
- $1,801 · $150/mo
- Expected delta
- +$18/yr (+$2/mo · 1.0%)
ⓘ Screening estimate from a state-policy table — verify with the county assessor before closing.
Climate risk First Street
- Flood 1/10 Low FEMA zone X (unshaded) · 0% chance over 30 yrs
- Wildfire 5/10 Major
- Heat 8/10 Severe 7 d/yr ≥107°F today · 20 d/yr by 30 yrs out
- Wind 9/10 Extreme 99% chance of damaging wind over 30 yrs
- Air quality 5/10 Major 9 unhealthy d/yr today · 10 by 30 yrs out
Nearby sold comps map
Loading sold comps map…
Walkable amenities ~0.75 mi
Loading nearby amenities…
Taxation est. · year 1
- Rental income
- $21,508
- − Mortgage interest
- −$12,155
- − Property taxes
- −$1,783
- − Insurance
- −$1,085
- − Repairs & maintenance
- −$1,721
- − Management
- −$1,721
- − Depreciation
- −$6,313
- Taxable loss
- −$3,269
- Est. tax savings @ 24.0%
- +$785
- After-tax cash flow
- $1,253/yr
For passive investors: Depreciation is non-cash, so a rental often shows a tax loss while cash-flowing — sheltering income. Rental losses are passive: they offset passive income freely, and up to $25,000/yr can offset ordinary (W-2) income if you actively participate and your MAGI is under $100k (phasing out to $0 by $150k); unused losses carry forward. On sale, claimed depreciation is recaptured at up to 25%, and gains may owe capital-gains tax (a 1031 exchange can defer both). Figures are a year-1 estimate at your 24.0% rate — not tax advice; consult a CPA.
Schools (NCES district)
- District
- Columbia
- NCES district ID
- 1200360
- Math proficiency
- 53% ▼ -10.00%
- Reading proficiency
- 54% ▼ -3.00%
- Median HH income
- $40,053
- Composite
- 44.74/100
- National rank
- #2750
- State rank
- #25 of 73 in FL
Livability — Lake City
- Score
- 73/100
- State rank
- #304
- US rank
- #5154
Category grades
Schools grade is shown separately in the Schools card above.
Census & demographics
- Census place
- Lake City, FL
- County
- Columbia County · 40,507 people
- City population
- 40,507
- Metro
- Lake City, FL
- Population (ZIP)
- 22,948
- Household income
- $55,004
- Rent vs Own
- Severe rent burden
- 754.0
Population outlook (Columbia County) Hauer SSP2
- Today (2025)
- 68,129 people
- By 2030
- 67,501 · -0.9%
- By 2040
- 65,465 · -3.9%
- By 2050
- 63,058 · -7.4%
- By 2075
- 56,291 · -17.4%
- By 2100
- 45,243 · -33.6%
Race, ethnicity, and origin ACS 2023
- Neighborhood character
- Predominantly White (67%)
- Race & ethnicity
- White 67% Black 20% Hispanic / Latino 8% Two or more races 7%
- Hispanic origin (detail)
- Mexican 1% Puerto Rican 3% Cuban 1%
- Common ancestry
- Serbian 2% Lithuanian 2% Romanian 2%
- Foreign-born
- 3% · Canada
- Languages at home
- 91% English-only · Spanish 6% French/Haitian/Cajun 2%
Political lean MEDSL · Columbia
- 2024 margin
- Solid R (+50.2) · D 24.6% · R 74.7%
- 2008→2024 swing
- -16.4pp toward R · 2008: -33.8pp · 2024: -50.2pp
- All cycles
- 2024: R+50.2 2020: R+45.2 2016: R+44.5 2012: R+36.7 2008: R+33.8
Not yet ingested
- Civics
- —
Market trends
- HPI YoY
- ▲ 17.57%
- Current HPI
- 276.7253
- Rent YoY
- —
- Metro
- Lake City, FL
- State GDP YoY
- ▲ 3.28%
- F500 in state
- 36
Industry mix (Fortune 500 HQ in FL)
| Industry | F500 HQs | Revenue |
|---|---|---|
| Industrial Technology | 2 | $29B |
|
||
| Insurance | 2 | $17B |
|
||
| Retail | 1 | $60B |
|
||
| Technology Distribution | 1 | $58B |
|
||
| Homebuilding | 1 | $35B |
|
||
| Technology Manufacturing | 1 | $35B |
|
||
Price history
+648.3% since first listed28 events — show timeline
- 2026-04-29 Relisted — Stellar MLS as Distributed by MLS Grid
- 2026-04-20 Pending — Stellar MLS as Distributed by MLS Grid
- 2026-04-06 Price Changed $217,000 Stellar MLS as Distributed by MLS Grid
- 2026-03-27 Price Changed $217,898 Stellar MLS as Distributed by MLS Grid
- 2026-02-23 Price Changed $217,900 Stellar MLS as Distributed by MLS Grid
- 2026-02-13 Price Changed $219,900 Stellar MLS as Distributed by MLS Grid
- 2026-01-13 Price Changed $219,000 Stellar MLS as Distributed by MLS Grid
- 2026-01-07 Price Changed $217,000 Stellar MLS as Distributed by MLS Grid
- 2025-10-17 Price Changed $219,000 Stellar MLS as Distributed by MLS Grid
- 2025-10-11 Price Changed $219,990 Stellar MLS as Distributed by MLS Grid
- 2025-08-29 Price Changed $219,000 Stellar MLS as Distributed by MLS Grid
- 2025-08-22 Price Changed $229,000 Stellar MLS as Distributed by MLS Grid
- 2025-03-12 Price Changed $229,990 Stellar MLS as Distributed by MLS Grid
- 2025-01-02 Price Changed $229,999 Stellar MLS as Distributed by MLS Grid
- 2024-11-27 Listed $229,000 NFMLS
- 2024-11-14 Price Changed $229,000 Stellar MLS as Distributed by MLS Grid
- 2024-11-07 Price Changed $229,999 Stellar MLS as Distributed by MLS Grid
- 2024-11-06 Relisted — Stellar MLS as Distributed by MLS Grid
- 2024-10-03 Price Changed $219,000 Stellar MLS as Distributed by MLS Grid
- 2024-09-29 Price Changed $229,000 Stellar MLS as Distributed by MLS Grid
- 2024-09-17 Price Changed $239,899 Stellar MLS as Distributed by MLS Grid
- 2024-08-28 Price Changed $239,900 Stellar MLS as Distributed by MLS Grid
- 2024-08-28 Relisted — Stellar MLS as Distributed by MLS Grid
- 2024-07-25 Listed $229,900 Stellar MLS as Distributed by MLS Grid
- 2021-08-11 Sold (Public Records) $65,000 Public Records
- 2021-04-14 Sold (MLS) $65,000 NFMLS
- 1995-11-01 Sold (Public Records) $29,200 Public Records
- 1990-03-01 Sold (Public Records) $29,000 Public Records
Property tax history
+12.5%/yrLatest (2025): $1,783 · +9.4% YoY. Source: county tax records.
Cash-flow waterfall
monthlySold comps — $/sqft
last 12 mo · ≤1 miLoading sold comps…