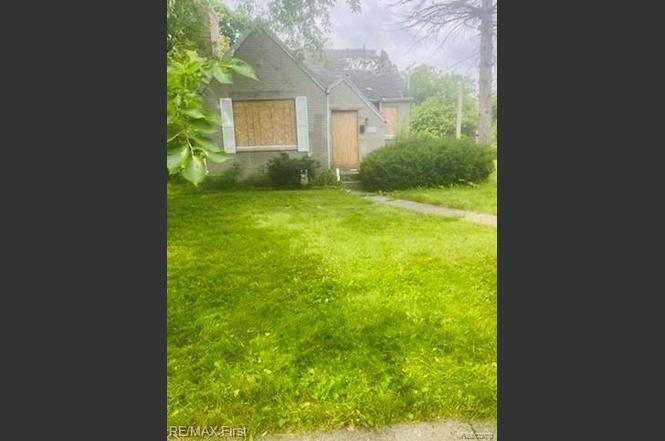
5117 University Pl · Detroit, MI
Flood risk 1/10 · Minimal
- FEMA flood zone
- X (unshaded)
- Chance of flooding over 30 yrs
- 0.0%
- Est. flood insurance / yr
- $473 – $860
Fire risk 1/10 · Minimal
- Est. fire insurance / yr
- $784 – $1,456
Heat risk 3/10 · Minor
- Hot days now (above 96°F)
- 7 days/yr
- Hot days in 30 yrs
- 15 days/yr
Wind risk 2/10 · Minimal
- Chance of severe wind over 30 yrs
- —
Air-quality risk 3/10 · Minor
- Unhealthy air days now
- 3 days/yr
- Unhealthy air days in 30 yrs
- 4 days/yr
Risk factors via First Street. Map © Google.
Why this score? — see what drove the D grade
The composite is a weighted blend of 9 inputs, each scored 0–100. Each bar is that input's sub-score; the figure is the points it added to the 100-point composite (weight × sub-score).
- Cash flow +15.0/30.0
- ARV discount +7.5/15.0
- 1% rule +5.0/10.0
- DSCR +5.0/10.0
- Livability +3.7/5.0
- Rent growth +2.7/5.0
- Condition / age +2.5/5.0
- Schools +1.3/10.0
- Appreciation +0.0/10.0
$27,000
🖨 Deal sheet 📄 Offer letter ✓ Due diligence
Listing remarks MLS
Great investment opportunity in Detroit's Cornerstone Village neighborhood! This 3-bedroom, 1-bath home offers over 1,300 square feet and has tons of potential for the right investor. The property experienced fire damage and will need a full renovation, but it sits on a solid foundation and provides a great opportunity to add value. Features include a spacious floor plan and a large detached garage that was not affected by the fire. Located in an established neighborhood with many updated and well-maintained homes nearby, this property has strong upside for resale or rental income. Cash buyers only. Sold as-is. Buyer to verify all information (BATVAI).
Key facts
- Solid foundation
- Spacious floor plan
- Full renovation
Tags
Property features AI
Exterior
- Parking: Detached 2-car garage
- Utilities: Public water; Public sewer
- Home design: Single-family residence; One and one-half story; Ground-level entry with steps
- Construction: Brick construction; Block foundation
- Exterior features: Paved road access; Lot approximately 0.15 acres (50 x 133.69)
Interior
- Kitchen: No appliances listed
- Bedrooms: Total of 5 rooms (bedrooms among them)
- Bathrooms: 1 full bathroom
- Heating & cooling: Forced air heating; Natural gas heating; No cooling
- Interior features: Unfinished basement
- Laundry & utility: Has heating
Neighborhood map
What this means for you Summary
Snapshot
- This is a 3-bed/1.0-bath single-family listed at $27k.
Deal economics
- At list price, monthly cash flow is $943 ($11k/yr) — positive.
- The deal already cash-flows at list — no discount required.
- Meets the 1% rule at list price ($1k rent vs $27k).
- Cap rate 48.2% vs local median 10.2% in Detroit — top-decile yield for the area; either an underpriced asset or a hidden risk that comps aren't pricing in. Stress-test before assuming the spread holds.
Location & tenants
- Location reads 73/100 on livability (#218 in MI) — a middle-class / working-renter tenant base. Strengths: amenities A+, commute A+, cost of living A+; Watch: schools F, crime F, employment F.
- Detroit Public Schools Community District (urban): math 10% / reading 24% proficiency, ranked #499 of 540 in MI (top 92%) — low school quality limits family demand, transient renter base, plan for 1-2y turnover; 90% free/reduced lunch — lower-income household profile, screen leases tightly.
- Market conditions: Rents flat; 484 active listings in the ZIP; 40 comparable units currently listed for rent nearby; rentals at typical pace (median 25d on market — plan ~3-4 weeks tenant-placement turnaround); lower-income renter base — watch delinquency; 2,639 units permitted in Wayne County in 2024 (1,216 in 5+ unit buildings).
- This rent runs 38% of the median local income ($45k/yr) — at the standard rent-burdened threshold; future hikes will face affordability resistance.
Forward outlook
- Local home prices are declining (-3.0%/yr); year-one equity from $187 of loan paydown is wiped out by about $810 of value loss. Plan a longer hold.
- Wayne County population projected at -17% by 2050 — secular population decline; favor cash flow + early exit over multi-decade hold.
- At projected returns (-3.0% appreciation + 0.7% rent growth), your $8k cash investment doubles in ~1 year — after that, you're playing with house money.
Negotiation context
- Only 1 days on market — expect competitive offers; lowballing is unlikely to land.
- 17 sale attempts since 20y ago with the ask held roughly flat each time — persistent listings suggest the price (not the market) is what's stuck; bring a comps-based counter.
Risks & watch-outs
- Watch-outs: built in 1937 — expect roof / HVAC / electrical / plumbing capex.
Questions for the listing agent
- Built in 1937 — when were the roof, HVAC, electrical panel, plumbing, and water heater last replaced?
- Is there a deadline driving the sale (1031 exchange, divorce, estate, relocation)? That informs how much negotiation room exists.
- Schools are F-rated, which usually means shorter tenancies and higher turnover. Who's the typical renter profile here, and what's been the actual vacancy rate?
- Crime grade is F in this area — have there been break-ins, vandalism, or insurance claims at this property in the last 3 years? What carrier currently insures it and at what premium?
- The area grade is low — what's the realistic commute time and amenity access for the typical tenant pool here? Any planned neighborhood developments (good or bad) we should know about?
- What's the average days-on-market for RENTAL listings here right now (not sales)? A rising rental-DOM trend means longer vacancies and softer asking-rent achievability than the comps imply.
- What's the recent tenant-quality profile in this submarket — average credit score on applications, eviction rate, late-payment / NSF rate, and stable-employment percentage? A property-management company in the area should have these aggregated.
- How much new for-sale + rental construction is in the pipeline within 1–3 miles? Heavy new supply typically softens prices + rents 12–24 months out; constrained supply supports both.
Investment metrics
- 1% rule
- 5.29% ✓
- Cap rate
- 48.19%
- Cash-on-cash
- 149.65%
- DSCR
- 7.66
- GRM
- 1.6
CMA / ARV
- ARV (on-the-fly)
- $133,600
- Comps found
- 12
Show comp detail 12 sales within ~0.75 mi
| Address | Dist | Beds/Ba | Sqft | Sold | Price | $/sf | Match |
|---|---|---|---|---|---|---|---|
| 5057 University Pl | 0.05mi | 3/1.0 | 1,301 (-3%) | 3mo | $110,000 | $85 | 90 |
| 5330 Hereford St | 0.17mi | 3/1.0 | 1,204 (-10%) | 3mo | $103,000 | $86 | 73 |
| 5779 Oldtown St | 0.50mi | 3/1.5 | 1,325 (-1%) | 4mo | $135,000 | $102 | 70 |
| 4403 Guilford St | 0.48mi | 3/1.0 | 1,270 (-5%) | 4mo | $35,900 | $28 | 67 |
| 5210 Farmbrook St | 0.20mi | 2/1.0 (-1) | 1,188 (-11%) | 3mo | $85,000 | $72 | 65 |
| 5960 Bishop St | 0.73mi | 3/1.0 | 1,351 (+1%) | 2mo | $155,000 | $115 | 62 |
| 5762 Oldtown St | 0.48mi | 3/1.5 | 1,240 (-7%) | 2mo | $138,000 | $111 | 62 |
| 5228 Hillcrest St | 0.71mi | 3/1.5 | 1,291 (-3%) | 2mo | $128,500 | $100 | 58 |
| 5085 Grayton St | 0.55mi | 4/2.5 (+1) | 1,381 (+3%) | 1mo | $240,500 | $174 | 57 |
| 5279 Cadieux Rd | 0.43mi | 3/2.0 | 1,161 (-13%) | 0mo | $68,000 | $59 | 54 |
| 4503 Bishop St | 0.68mi | 3/1.5 | 1,215 (-9%) | 3mo | $158,000 | $130 | 49 |
| 6230 Oldtown St | 0.72mi | 3/1.0 | 1,149 (-14%) | 2mo | $76,000 | $66 | 42 |
Match score weights: distance 35% · size 25% · config 20% · recency 20%. Top-matched comps best support the ARV.
Projected returns pro-forma
-3.0% appreciation · 0.73% rent growth · sell at horizon
- IRR
- —
- Equity multiple
- 7.94×
- Total profit
- $52,500
- Equity at exit
- $4,026
- IRR
- —
- Equity multiple
- 15.63×
- Total profit
- $110,605
- Equity at exit
- $2,334
Cash invested: $7,560 (down + closing). Projections, not guarantees.
Landlord ↔ Tenant lean methodology
- Overall (STATE)
- 62 Landlord-Friendly
- State Michigan
- 62 Landlord-Friendly · EVEN
- County
- — inherits STATE
- City
- — inherits STATE
ZIP-level market 48224
- Rents YoY
- 0.7%
- Active inventory
- 484
- Price-to-rent
- 1.6×
Monthly cashflow live
- Estimated rent
- $1,430 high interval (Pro) →
- Mortgage (P&I)
- −$142
- Tax est. 1.5%
- −$34 /mo · $405/yr
- Insurance
- −$11
- HOA
- −$0
- Vacancy / Maint / Mgmt
- −$300
- Net cashflow
- $943
Break-even live
UW: 25.0% down · 7.5% · 30yr · 1.5% tax · 5.0% vac · 8.0% maint · 8.0% mgmt
Financing live
Cash to close
- Down payment
- $6,750
- Closing costs
- $810
- Reserves months
- —
- Total cash needed
- —
Loan-product check · same deal, 3 products live
Conventional
25% down · 7.5% · 30yr
- Down + closing
- —
- Monthly P&I
- —
- Monthly cashflow
- —
- DSCR
- —
- Eligible?
- —
Personal DTI + credit; lowest rate.
DSCR
20% down · 8.5% · 30yr
- Down + closing
- —
- Monthly P&I
- —
- Monthly cashflow
- —
- DSCR
- —
- Eligible?
- —
No personal income docs; deal must DSCR.
Hard money
10% down · 12.0% · 12mo
- Down + closing
- —
- Monthly P&I
- —
- Monthly cashflow
- —
- DSCR
- —
- Eligible?
- —
Short-term bridge; refi at stabilization.
Rent comps 40 comps
| Address | Beds | Baths | Sqft | Rent | $/sqft | DOM | Units | Dist |
|---|---|---|---|---|---|---|---|---|
| 5786 Neff Ave Detroit, MI | 3.0 | 1.5 | 1100 | $1,225 | $1.11 | 16d | 1 | 0.37mi |
| 17137 Ontario St Unit 1 Detroit, MI | 2.0 | 1.0 | 982 | $1,123 | $1.14 | 24d | 1 | 0.43mi |
| 5915 Farmbrook St Detroit, MI | 3.0 | 1.5 | 1000 | $1,250 | $1.25 | 24d | 1 | 0.46mi |
| 6154 Woodhall St Detroit, MI | 2.0 | 1.0 | 1136 | $1,000 | $0.88 | 43d | 1 | 0.60mi |
| 6175 Marseilles St Detroit, MI | 3.0 | 1.0 | 1100 | $1,100 | $1.00 | 43d | 1 | 0.60mi |
| 6181 Neff Ave Detroit, MI | 3.0 | 1.0 | 1102 | $1,299 | $1.18 | 18d | 1 | 0.61mi |
| 6301 Lodewyck St Detroit, MI | 3.0 | 1.0 | 1084 | $1,300 | $1.20 | 12d | 1 | 0.67mi |
| 6325 Neff Ave Detroit, MI | 3.0 | 1.0 | 1000 | $1,500 | $1.50 | 2d | 1 | 0.68mi |
| 19000 Chandler Park Dr Grosse Pointe, MI | 2.0 | 1.0 | 1374 | $2,300 | $1.67 | 4d | 1 | 0.70mi |
| 19000 Chandler Park Dr Grosse Pointe, MI | 2.0 | 1.0 | 1374 | $2,300 | $1.67 | 1d | 1 | 0.70mi |
| 6304 Bluehill St Detroit, MI | 3.0 | 1.0 | 1088 | $1,500 | $1.38 | 43d | 1 | 0.70mi |
| 6225 Oldtown St Detroit, MI | 3.0 | 1.0 | 1330 | $1,199 | $0.90 | 17d | 1 | 0.73mi |
| 17710 Chester St Detroit, MI | 2.0 | 1.0 | 984 | $1,250 | $1.27 | 43d | 1 | 0.74mi |
| 17720 Chester St Detroit, MI | 2.0 | 1.0 | 986 | $1,250 | $1.27 | 43d | 1 | 0.74mi |
| 5783 Yorkshire Rd Detroit, MI | 2.0 | 1.0 | 1040 | $1,200 | $1.15 | 43d | 1 | 0.74mi |
| 19168 Berden St Grosse Pointe, MI | 3.0 | 1.0 | 1200 | $1,800 | $1.50 | 1d | 1 | 0.87mi |
| 890 Neff Rd Grosse Pointe, MI | 2.0 | 1.0 | 1100 | $2,000 | $1.82 | 24d | 1 | 0.90mi |
| 21401 Kingsville St Harper Woods, MI | 2.0 | 1.0 | 944 | $1,200 | $1.27 | 24d | 1 | 0.95mi |
| 20926 Moross Rd Grosse Pointe, MI | 3.0 | 1.0 | 1200 | $1,350 | $1.12 | 43d | 1 | 0.95mi |
| 9171 Bishop St Detroit, MI | 4.0 | 1.0 | 1508 | $1,300 | $0.86 | 43d | 1 | 0.98mi |
| 9241 Boleyn St Detroit, MI | 3.0 | 1.0 | 1350 | $1,350 | $1.00 | 43d | 1 | 1.00mi |
| 5028 Bedford St Detroit, MI | 3.0 | 1.0 | 1000 | $1,400 | $1.40 | 5d | 1 | 1.01mi |
| 10542 Lanark St Detroit, MI | 3.0 | 1.0 | 1023 | $1,250 | $1.22 | 43d | 1 | 1.02mi |
| 5031 Bedford St Detroit, MI | 2.0 | 1.0 | 876 | $1,870 | $2.13 | 1d | 1 | 1.04mi |
| 19203 Edgefield St Harper Woods, MI | 2.0 | 1.0 | 1100 | $1,100 | $1.00 | 24d | 1 | 1.05mi |
| 9313 Harvard Rd Detroit, MI | 3.0 | 1.5 | 1329 | $1,200 | $0.90 | 17d | 1 | 1.05mi |
| 4627 Bedford St Unit 1 Detroit, MI | 2.0 | 1.0 | 1050 | $945 | $0.90 | 20d | 1 | 1.09mi |
| 10037 Grayton St Detroit, MI | 3.0 | 1.0 | 1000 | $1,400 | $1.40 | 3d | 1 | 1.11mi |
| 5112 Haverhill St Unit 1 Detroit, MI | 2.0 | 1.0 | 1000 | $1,100 | $1.10 | 43d | 1 | 1.11mi |
| 9635 Everts St Detroit, MI | 4.0 | 2.0 | 1450 | $1,650 | $1.14 | 43d | 1 | 1.14mi |
| 10370 Britain St Detroit, MI | 3.0 | 1.0 | 1100 | $1,100 | $1.00 | 43d | 1 | 1.14mi |
| 5267 Haverhill St Detroit, MI | 3.0 | 1.5 | 1458 | $1,300 | $0.89 | 17d | 1 | 1.15mi |
| 5267 Haverhill St Detroit, MI | 3.0 | 1.5 | 1458 | $1,300 | $0.89 | 16d | 1 | 1.15mi |
| 10400 Britain St Detroit, MI | 3.0 | 1.0 | 890 | $1,100 | $1.24 | 43d | 1 | 1.17mi |
| 5574 Buckingham Ave Detroit, MI | 3.0 | 1.0 | 1430 | $1,450 | $1.01 | 4d | 1 | 1.19mi |
| 10692 Meuse St Detroit, MI | 3.0 | 1.0 | 955 | $1,250 | $1.31 | 12d | 1 | 1.19mi |
| 10870 Marne St Detroit, MI | 3.0 | 1.0 | 1156 | $1,100 | $0.95 | 17d | 1 | 1.20mi |
| 3626 Courville St Detroit, MI | 3.0 | 1.0 | 1260 | $1,300 | $1.03 | 43d | 1 | 1.22mi |
| 20461 Kingsville St Harper Woods, MI | 4.0 | 1.0 | 1100 | $1,399 | $1.27 | 15d | 1 | 1.27mi |
| 10985 Peerless St Detroit, MI | 3.0 | 1.0 | 1000 | $1,364 | $1.36 | 5d | 1 | 1.28mi |
Listing history 2 events
-
2026-06-17remarks 660-char remark
Show marketing remark (660 chars)
Great investment opportunity in Detroit's Cornerstone Village neighborhood! This 3-bedroom, 1-bath home offers over 1,300 square feet and has tons of potential for the right investor. The property experienced fire damage and will need a full renovation, but it sits on a solid foundation and provides a great opportunity to add value. Features include a spacious floor plan and a large detached garage that was not affected by the fire. Located in an established neighborhood with many updated and well-maintained homes nearby, this property has strong upside for resale or rental income. Cash buyers only. Sold as-is. Buyer to verify all information (BATVAI).
-
2026-06-17$27,000 Active 1 DOM
Show marketing remark (660 chars)
Great investment opportunity in Detroit's Cornerstone Village neighborhood! This 3-bedroom, 1-bath home offers over 1,300 square feet and has tons of potential for the right investor. The property experienced fire damage and will need a full renovation, but it sits on a solid foundation and provides a great opportunity to add value. Features include a spacious floor plan and a large detached garage that was not affected by the fire. Located in an established neighborhood with many updated and well-maintained homes nearby, this property has strong upside for resale or rental income. Cash buyers only. Sold as-is. Buyer to verify all information (BATVAI).
ⓘ Source: listings_history table (triggers on properties + properties_extension) + one-shot
backfill from property_details.listing_events for pre-trigger history.
Climate risk First Street
- Flood 1/10 Low FEMA zone X (unshaded) · 0% chance over 30 yrs
- Wildfire 1/10 Low
- Heat 3/10 Moderate 7 d/yr ≥96°F today · 15 d/yr by 30 yrs out
- Wind 2/10 Low
- Air quality 3/10 Moderate 3 unhealthy d/yr today · 4 by 30 yrs out
Nearby sold comps map
Loading sold comps map…
Walkable amenities ~0.75 mi
Loading nearby amenities…
Taxation est. · year 1
- Rental income
- $17,155
- − Mortgage interest
- −$1,512
- − Property taxes
- −$405
- − Insurance
- −$135
- − Repairs & maintenance
- −$1,372
- − Management
- −$1,372
- − Depreciation
- −$785
- Taxable income
- $11,572
- Est. tax owed @ 24.0%
- −$2,777
- After-tax cash flow
- $8,536/yr
For passive investors: Depreciation is non-cash, so a rental often shows a tax loss while cash-flowing — sheltering income. Rental losses are passive: they offset passive income freely, and up to $25,000/yr can offset ordinary (W-2) income if you actively participate and your MAGI is under $100k (phasing out to $0 by $150k); unused losses carry forward. On sale, claimed depreciation is recaptured at up to 25%, and gains may owe capital-gains tax (a 1031 exchange can defer both). Figures are a year-1 estimate at your 24.0% rate — not tax advice; consult a CPA.
Schools (NCES district)
- District
- Detroit Public Schools Community District
- NCES district ID
- 2601103
- Math proficiency
- 10% ▼ -2.00%
- Reading proficiency
- 24% ▲ 6.00%
- Median HH income
- $25,815
- Composite
- 13.06/100
- National rank
- #9564
- State rank
- #499 of 540 in MI
Livability — Detroit
- Score
- 73/100
- State rank
- #218
- US rank
- #5427
Category grades
Schools grade is shown separately in the Schools card above.
Census & demographics
- Census place
- Detroit, MI
- County
- Wayne County · 1,562,939 people
- City population
- 572,865
- Metro
- Detroit-Warren-Dearborn, MI
- Population (ZIP)
- 39,668
- Household income
- $44,856
- Rent vs Own
- Severe rent burden
- 2515.0
Population outlook (Wayne County) Hauer SSP2
- Today (2025)
- 1,675,273 people
- By 2030
- 1,620,300 · -3.3%
- By 2040
- 1,502,341 · -10.3%
- By 2050
- 1,384,039 · -17.4%
- By 2075
- 1,124,592 · -32.9%
- By 2100
- 881,193 · -47.4%
Race, ethnicity, and origin ACS 2023
- Neighborhood character
- Predominantly Black (88%)
- Race & ethnicity
- Black 88% White 8% Two or more races 3% Hispanic / Latino 1%
- Common ancestry
- Iranian 1% Romanian 1% Lithuanian 1%
- Foreign-born
- 1%
- Languages at home
- 97% English-only · Spanish 2%
Political lean MEDSL · Wayne
- 2024 margin
- Strong D (+29.0) · D 62.7% · R 33.7% · Other 3.6%
- 2008→2024 swing
- -20.5pp toward R · 2008: 49.5pp · 2024: 29.0pp
- All cycles
- 2024: D+29.0 2020: D+38.1 2016: D+37.3 2012: D+46.9 2008: D+49.5
Not yet ingested
- Civics
- —
Market trends
- HPI YoY
- ▼ -226.38%
- Current HPI
- 161.886
- Rent YoY
- ▲ 0.73%
- Metro
- Detroit-Warren-Dearborn, MI
- State GDP YoY
- ▲ 1.37%
- F500 in state
- 28
Industry mix (Fortune 500 HQ in MI)
| Industry | F500 HQs | Revenue |
|---|---|---|
| Automotive Parts | 3 | $48B |
|
||
| Automotive | 2 | $372B |
|
||
| Chemicals | 1 | $45B |
|
||
| Automotive Retail | 1 | $29B |
|
||
| Healthcare / Medical Devices | 1 | $23B |
|
||
| Automotive Technology | 1 | $20B |
|
||
Price history
-48.6% since first listed45 events — show timeline
- 2026-06-17 Listed $27,000 REALCOMP
- 2026-06-17 Listed $27,000 MiRealSource-MiMLS
- 2026-04-11 Listing Removed — MiRealSource-MiMLS
- 2026-04-11 Listing Removed — REALCOMP
- 2026-04-11 Price Changed $39,990 MiRealSource-MiMLS
- 2026-04-10 Price Changed $39,990 REALCOMP
- 2026-04-06 Listed $49,990 REALCOMP
- 2026-04-06 Listed $49,990 MiRealSource-MiMLS
- 2025-10-13 Listing Removed — MiRealSource-MiMLS
- 2025-09-10 Price Changed $98,900 MiRealSource-MiMLS
- 2025-09-09 Price Changed $98,900 REALCOMP
- 2025-08-26 Price Changed $99,000 MiRealSource-MiMLS
- 2025-08-26 Price Changed $99,000 REALCOMP
- 2025-07-24 Price Changed $111,000 MiRealSource-MiMLS
- 2025-07-24 Price Changed $111,000 REALCOMP
- 2025-07-09 Listed $121,000 REALCOMP
- 2025-07-08 Listed $121,000 MiRealSource-MiMLS
- 2016-03-11 Sold (Public Records) $52,500 Public Records
- 2012-06-01 Listing Removed — MiRealSource-MiMLS
- 2012-06-01 Listing Removed — REALCOMP
- 2012-01-03 Listed $29,500 MiRealSource-MiMLS
- 2012-01-03 Listed $29,500 REALCOMP
- 2011-12-31 Listing Removed — MiRealSource-MiMLS
- 2011-12-31 Listing Removed — REALCOMP
- 2010-04-01 Listing Removed — MiRealSource-MiMLS
- 2009-12-18 Listed $49,500 MiRealSource-MiMLS
- 2009-12-18 Listed $29,500 MiRealSource-MiMLS
- 2009-12-18 Listed $29,500 REALCOMP
- 2009-09-19 Listing Removed — REALCOMP
- 2009-09-18 Listing Removed — MiRealSource-MiMLS
- 2009-04-30 Listed $65,000 MiRealSource-MiMLS
- 2009-04-30 Listed $65,000 REALCOMP
- 2009-03-24 Listed $4,000 REALCOMP
- 2009-03-24 Listing Removed — REALCOMP
- 2007-08-24 Sold (Public Records) $117,000 Public Records
- 2007-01-31 Sold (MLS) $28,100 REALCOMP
- 2007-01-31 Sold (MLS) $28,100 MiRealSource-MiMLS
- 2007-01-08 Listing Removed — MiRealSource-MiMLS
- 2006-12-29 Listing Removed — REALCOMP
- 2006-12-29 Listed $22,500 REALCOMP
- 2006-12-29 Listed $22,500 MiRealSource-MiMLS
- 2006-09-05 Listed $22,500 REALCOMP
- 2004-07-30 Sold (Public Records) $120,000 Public Records
- 1998-04-27 Sold (Public Records) $71,000 Public Records
- 1998-04-27 Sold (Public Records) $52,500 Public Records
Property tax history
+7.9%/yrLatest (2025): $3,757 · -7.9% YoY. Source: county tax records.
Cash-flow waterfall
monthlySold comps — $/sqft
last 12 mo · ≤1 miLoading sold comps…