 🏗️ New Construction
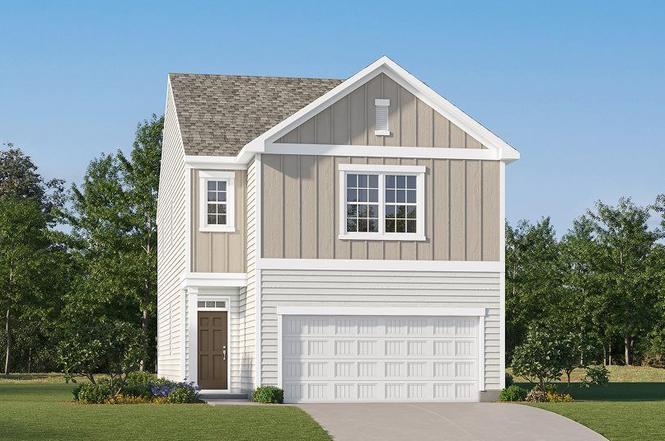
Anderson Plan · Gilbert, SC
Flood risk No data
- FEMA flood zone
- —
- Chance of flooding over 30 yrs
- —
- Est. flood insurance / yr
- —
Fire risk No data
- Est. fire insurance / yr
- —
Heat risk No data
- Hot days now (above threshold)
- —
- Hot days in 30 yrs
- —
Wind risk No data
- Chance of severe wind over 30 yrs
- —
Air-quality risk No data
- Unhealthy air days now
- —
- Unhealthy air days in 30 yrs
- —
Risk factors via First Street. Map © Google.
Why this score? — see what drove the D+ grade
The composite is a weighted blend of 9 inputs, each scored 0–100. Each bar is that input's sub-score; the figure is the points it added to the 100-point composite (weight × sub-score).
- Cash flow +12.4/30.0
- Appreciation +10.0/10.0
- ARV discount +7.5/15.0
- Schools +4.2/10.0
- DSCR +3.7/10.0
- Livability +3.6/5.0
- 1% rule +3.5/10.0
- Rent growth +2.5/5.0
- Condition / age +2.5/5.0
$233,999
🖨 Deal sheet 📄 Offer letter ✓ Due diligence
Key facts
- Breakfast nook
- Dual walk-in closet
- Stylish kitchen
Tags
Property features AI
Finance
- Other: Virtual branded tour available
- Financial info: List price $243,999
Exterior
- Home design: Single-family plan home (Anderson)
- Construction: New construction
- Exterior features: Living area approximately 1,928 (listed)
Interior
- Bedrooms: 3 bedrooms
- Bathrooms: 2 full bathrooms and 1 half bathroom (2.5 total)
- Interior features: New construction plan (Anderson)
Neighborhood map
What this means for you Summary
Snapshot
- This is a 3-bed/2.5-bath single-family listed at $234k.
Deal economics
- At list price, monthly cash flow is $-38 ($-456/yr) — negative.
- To cash-flow at today's rent, offer at most $229k (2.3% below list).
- To meet the 1% rule (rent ≥ 1% of price), the offer needs to be $200k (14.6% below list).
- Recommended offer: $200k (14.6% below list) — sets the bar for 1% rule.
Location & tenants
- Location reads 71/100 on livability (#52 in SC) — a middle-class / working-renter tenant base. Strengths: cost of living A+, housing A+, crime B; Watch: schools D, amenities F, commute F.
- Lexington 01 (suburban): math 42% / reading 53% proficiency, ranked #11 of 80 in SC (top 14%) — families likely to look elsewhere, expect single-tenant / working-renter base with shorter leases.
- Market conditions: 273 active listings in the ZIP; 2 comparable units currently listed for rent nearby; 1,712 units permitted in Lexington County in 2024 (0 in 5+ unit buildings).
Forward outlook
- In year one you build about $25k of equity ($2k loan paydown + $23k appreciation (10.0% local appreciation)).
- Lexington County population projected at +26% by 2050 — long-run rental-demand tailwind backs the buy-and-hold thesis.
- At projected returns (10.0% appreciation + 3.0% rent growth), your $66k cash investment doubles in ~3 years — after that, you're playing with house money.
- By year 2, paydown + projected appreciation supports a ~$40k cash-out refi (75% LTV) — recoverable capital for the next deal without selling this one.
Negotiation context
- It's been on market 454 days — a 12% lower offer ($206k) is reasonable based on typical stale-listing flexibility.
Questions for the listing agent
- What do current leases actually rent for vs. the listed asking? Can we see a recent rent roll and the last 12 months of T-12 income?
- It's been on market 454 days. Have you received any prior offers? Is the seller open to a 15% concession, seller financing, or rate buy-down credit?
- Why hasn't it sold? Are there any deal-killer items the seller is aware of (foundation, flood, title, zoning, code violations)?
- Is there a deadline driving the sale (1031 exchange, divorce, estate, relocation)? That informs how much negotiation room exists.
- Schools are D-rated, which usually means shorter tenancies and higher turnover. Who's the typical renter profile here, and what's been the actual vacancy rate?
- The area grade is low — what's the realistic commute time and amenity access for the typical tenant pool here? Any planned neighborhood developments (good or bad) we should know about?
- What's the average days-on-market for RENTAL listings here right now (not sales)? A rising rental-DOM trend means longer vacancies and softer asking-rent achievability than the comps imply.
- What's the recent tenant-quality profile in this submarket — average credit score on applications, eviction rate, late-payment / NSF rate, and stable-employment percentage? A property-management company in the area should have these aggregated.
- How much new for-sale + rental construction is in the pipeline within 1–3 miles? Heavy new supply typically softens prices + rents 12–24 months out; constrained supply supports both.
Investment metrics
- 1% rule
- 0.85% ✗
- Cap rate
- 6.10%
- Cash-on-cash
- -0.70%
- DSCR
- 0.97
- GRM
- 9.8
CMA / ARV
No comps found within radius.
Projected returns pro-forma
10.0% appreciation · 3.0% rent growth · sell at horizon
- IRR
- 23.8%
- Equity multiple
- 2.91×
- Total profit
- $125,053
- Equity at exit
- $210,805
- IRR
- 21.1%
- Equity multiple
- 6.65×
- Total profit
- $370,222
- Equity at exit
- $454,609
Cash invested: $65,520 (down + closing). Projections, not guarantees.
Landlord ↔ Tenant lean methodology
- Overall (STATE)
- 90 Strongly Landlord-Friendly
- State South Carolina
- 90 Strongly Landlord-Friendly · R+6
- County
- — inherits STATE
- City
- — inherits STATE
ZIP-level market 29054
- Home prices YoY
- 4.7%
- Active inventory
- 273
- Price-to-rent
- 9.8×
Monthly cashflow live
- Estimated rent
- $1,999 medium interval (Pro) →
- Mortgage (P&I)
- −$1,227
- Tax est. 1.5%
- −$292 /mo · $3,510/yr
- Insurance
- −$97
- HOA
- −$0
- Vacancy / Maint / Mgmt
- −$420
- Net cashflow
- $-38
Break-even live
UW: 25.0% down · 7.5% · 30yr · 1.5% tax · 5.0% vac · 8.0% maint · 8.0% mgmt
Financing live
Cash to close
- Down payment
- $58,500
- Closing costs
- $7,020
- Reserves months
- —
- Total cash needed
- —
Loan-product check · same deal, 3 products live
Conventional
25% down · 7.5% · 30yr
- Down + closing
- —
- Monthly P&I
- —
- Monthly cashflow
- —
- DSCR
- —
- Eligible?
- —
Personal DTI + credit; lowest rate.
DSCR
20% down · 8.5% · 30yr
- Down + closing
- —
- Monthly P&I
- —
- Monthly cashflow
- —
- DSCR
- —
- Eligible?
- —
No personal income docs; deal must DSCR.
Hard money
10% down · 12.0% · 12mo
- Down + closing
- —
- Monthly P&I
- —
- Monthly cashflow
- —
- DSCR
- —
- Eligible?
- —
Short-term bridge; refi at stabilization.
Rent comps 2 comps
| Address | Beds | Baths | Sqft | Rent | $/sqft | DOM | Units | Dist |
|---|---|---|---|---|---|---|---|---|
| 622 Wild Tulip Ct Gilbert, SC | 3.0 | 2.5 | 1800 | $1,875 | $1.04 | 11d | 1 | 0.96mi |
| 607 Wild Tulip Ct Gilbert, SC | 4.0 | 2.5 | 2358 | $2,145 | $0.91 | 3d | 1 | 0.99mi |
Listing history 13 events
-
2026-06-18days on market $233,999 Active 454 DOM
-
2026-06-17days on market $233,999 Active 453 DOM
-
2026-06-16days on market $233,999 Active 452 DOM
-
2026-06-15days on market $233,999 Active 451 DOM
-
2026-06-14days on market $233,999 Active 449 DOM
-
2026-06-10pricedays on market $233,999 Active 446 DOM
-
2026-06-09days on market $243,999 Active 445 DOM
-
2026-06-08days on market $243,999 Active 444 DOM
-
2026-06-07days on market $243,999 Active 443 DOM
-
2026-06-03days on market $243,999 Active 439 DOM
-
2026-06-03days on market $243,999 Active 438 DOM
-
2026-06-02days on market $243,999 Active 437 DOM
-
2026-05-31days on market $243,999 Active 436 DOM
ⓘ Source: listings_history table (triggers on properties + properties_extension) + one-shot
backfill from property_details.listing_events for pre-trigger history.
Nearby sold comps map
Loading sold comps map…
Walkable amenities ~0.75 mi
Loading nearby amenities…
Taxation est. · year 1
- Rental income
- $23,987
- − Mortgage interest
- −$13,108
- − Property taxes
- −$3,510
- − Insurance
- −$1,170
- − Repairs & maintenance
- −$1,919
- − Management
- −$1,919
- − Depreciation
- −$6,807
- Taxable loss
- −$4,446
- Est. tax savings @ 24.0%
- +$1,067
- After-tax cash flow
- $611/yr
For passive investors: Depreciation is non-cash, so a rental often shows a tax loss while cash-flowing — sheltering income. Rental losses are passive: they offset passive income freely, and up to $25,000/yr can offset ordinary (W-2) income if you actively participate and your MAGI is under $100k (phasing out to $0 by $150k); unused losses carry forward. On sale, claimed depreciation is recaptured at up to 25%, and gains may owe capital-gains tax (a 1031 exchange can defer both). Figures are a year-1 estimate at your 24.0% rate — not tax advice; consult a CPA.
Schools (NCES district)
- District
- Lexington 01
- NCES district ID
- 4502700
- Math proficiency
- 42% ▼ -12.00%
- Reading proficiency
- 53% ▼ -2.00%
- Median HH income
- $61,298
- Composite
- 41.75/100
- National rank
- #3399
- State rank
- #11 of 80 in SC
Livability — Gilbert
- Score
- 71/100
- State rank
- #52
- US rank
- #7008
Category grades
Schools grade is shown separately in the Schools card above.
Census & demographics
- Population (ZIP)
- 10,137
Population outlook (Lexington County) Hauer SSP2
- Today (2025)
- 322,999 people
- By 2030
- 342,356 · +6.0%
- By 2040
- 377,715 · +16.9%
- By 2050
- 406,984 · +26.0%
- By 2075
- 465,447 · +44.1%
- By 2100
- 485,674 · +50.4%
Race, ethnicity, and origin ACS 2023
- Neighborhood character
- Predominantly White (86%)
- Race & ethnicity
- White 86% Hispanic / Latino 6% Two or more races 6% Black 2%
- Hispanic origin (detail)
- Mexican 4%
- Common ancestry
- Slovak 2% Italian 2% Serbian 2%
- Foreign-born
- 2% · Canada, Jamaica
- Languages at home
- 94% English-only · Spanish 5%
Political lean MEDSL · Lexington
- 2024 margin
- Solid R (+33.5) · D 32.5% · R 66.0% · Other 1.4%
- 2008→2024 swing
- +4.6pp toward D · 2008: -38.0pp · 2024: -33.5pp
- All cycles
- 2024: R+33.5 2020: R+30.1 2016: R+36.7 2012: R+37.8 2008: R+38.0
Not yet ingested
- Civics
- —
Market trends
- HPI YoY
- ▲ 20.87%
- Current HPI
- 461.9332
- Rent YoY
- —
- Metro
- —
- State GDP YoY
- ▲ 4.51%
- F500 in state
- 2
Industry mix (Fortune 500 HQ in SC)
| Industry | F500 HQs | Revenue |
|---|---|---|
| Packaging | 1 | $7B |
|
||
Cash-flow waterfall
monthlySold comps — $/sqft
last 12 mo · ≤1 miLoading sold comps…