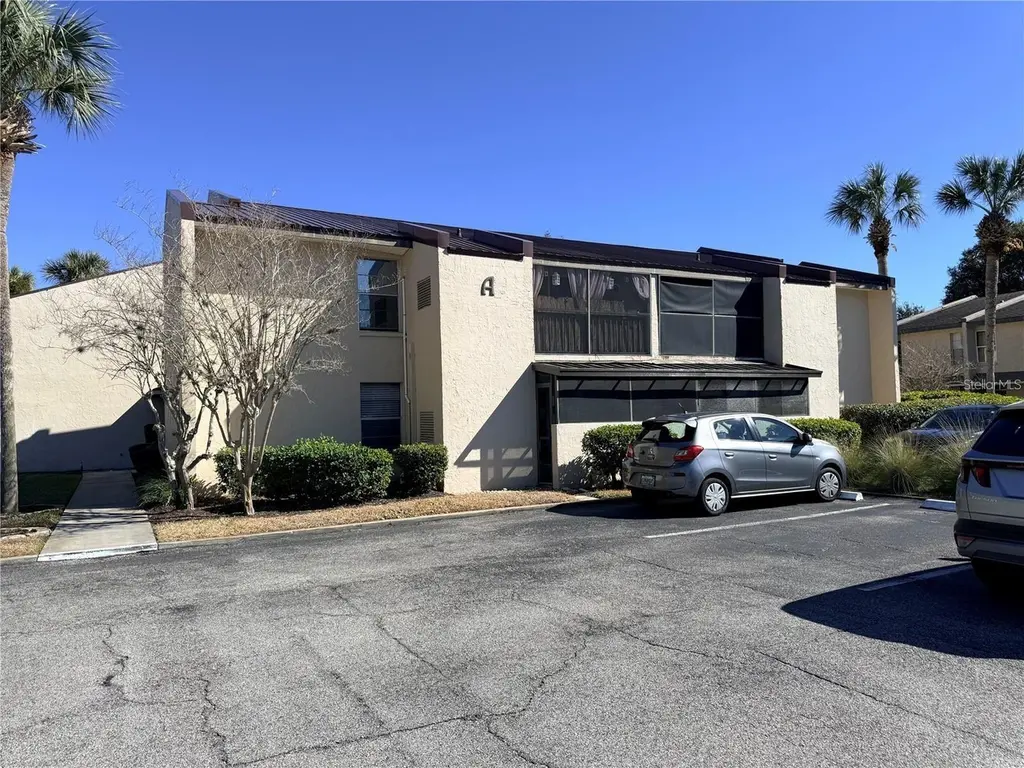
100 E Kentucky Ave Unit A6 · DeLand, FL
Flood risk 1/10 · Minimal
- FEMA flood zone
- X (unshaded)
- Chance of flooding over 30 yrs
- 0.0%
- Est. flood insurance / yr
- $507 – $1,088
Fire risk 2/10 · Minimal
- Est. fire insurance / yr
- $947 – $1,759
Heat risk 9/10 · Severe
- Hot days now (above 107°F)
- 7 days/yr
- Hot days in 30 yrs
- 20 days/yr
Wind risk 9/10 · Severe
- Chance of severe wind over 30 yrs
- 99.0%
Air-quality risk 2/10 · Minimal
- Unhealthy air days now
- 1 days/yr
- Unhealthy air days in 30 yrs
- 1 days/yr
Risk factors via First Street. Map © Google.
Why this score? — see what drove the D grade
The composite is a weighted blend of 9 inputs, each scored 0–100. Each bar is that input's sub-score; the figure is the points it added to the 100-point composite (weight × sub-score).
- Cash flow +9.6/30.0
- ARV discount +7.5/15.0
- 1% rule +7.4/10.0
- Schools +3.9/10.0
- Livability +3.4/5.0
- Rent growth +3.2/5.0
- DSCR +2.7/10.0
- Condition / age +2.5/5.0
- Appreciation +0.0/10.0
$117,900
🖨 Deal sheet 📄 Offer letter ✓ Due diligence
Listing remarks MLS
END UNIT ON 1ST FLOOR CLOSE TO PARKING. GLASSED IN FLORIDA ROOM WITH SLIDING DOOR FROM GREAT ROOM. WASHER AND DRYER IN STORAGE ROOM OFF OF FLORIDA ROOM. UPDATED KITCHEN AND BATHS. TILE FLOORS THROUGHOUT.
Key facts
- Newer vanities
- Bonus florida room
- Ceramic tile
Tags
Neighborhood map
What this means for you Summary
Snapshot
- This is a 2-bed/2.0-bath condo listed at $118k.
Deal economics
- At list price, monthly cash flow is $-79 ($-952/yr) — negative.
- To cash-flow at today's rent, offer at most $104k (11.9% below list).
- Meets the 1% rule at list price ($1k rent vs $118k).
- Recommended offer: $104k (11.9% below list) — sets the bar for cash-flow.
Location & tenants
- Location reads 68/100 on livability (#498 in FL) — a middle-class / working-renter tenant base. Strengths: housing A+, cost of living A, crime B; Watch: schools D+, amenities F, commute F.
- Volusia (suburban): math 44% / reading 49% proficiency, ranked #47 of 73 in FL (top 64%) — families likely to look elsewhere, expect single-tenant / working-renter base with shorter leases.
- Market conditions: Rents rising (+2.8%/yr); 662 active listings in the ZIP; 13 comparable units currently listed for rent nearby; rentals at typical pace (median 24d on market — plan ~3-4 weeks tenant-placement turnaround); 3,402 units permitted in Volusia County in 2024 (681 in 5+ unit buildings).
Forward outlook
- Local home prices are declining (-3.0%/yr); year-one equity from $815 of loan paydown is wiped out by about $4k of value loss. Plan a longer hold.
- Volusia County population projected at +19% by 2050 — long-run rental-demand tailwind backs the buy-and-hold thesis.
Negotiation context
- Only 4 days on market — expect competitive offers; lowballing is unlikely to land.
- 3 sale attempts since 10y ago with the ask held roughly flat each time — persistent listings suggest the price (not the market) is what's stuck; bring a comps-based counter.
- Current owner paid $62k; list at $118k implies a 89% gain — meaningful room to come down on a strong offer.
Risks & watch-outs
- Watch-outs: HOA is 36% of rent.
- Climate carrying-cost: severe wind risk, 99% chance of damaging wind over 30y; extreme-heat days projected 7→20/yr by 2055 (HVAC capex compounding) — expect insurance premiums to compound above CPI over the hold.
Questions for the listing agent
- What do current leases actually rent for vs. the listed asking? Can we see a recent rent roll and the last 12 months of T-12 income?
- Built in 1975 — when were the roof, HVAC, electrical panel, plumbing, and water heater last replaced?
- What does the HOA fee cover, when was the last increase, and are there any pending special assessments or reserve-fund shortfalls?
- Any open or pending special assessments — roof, HVAC, plumbing, elevator, façade? What's the per-unit balance and payoff schedule, and is the seller paying it off at close or rolling it to the buyer?
- Is there a deadline driving the sale (1031 exchange, divorce, estate, relocation)? That informs how much negotiation room exists.
- Schools are D-rated, which usually means shorter tenancies and higher turnover. Who's the typical renter profile here, and what's been the actual vacancy rate?
- The area grade is low — what's the realistic commute time and amenity access for the typical tenant pool here? Any planned neighborhood developments (good or bad) we should know about?
- What's the average days-on-market for RENTAL listings here right now (not sales)? A rising rental-DOM trend means longer vacancies and softer asking-rent achievability than the comps imply.
- What's the recent tenant-quality profile in this submarket — average credit score on applications, eviction rate, late-payment / NSF rate, and stable-employment percentage? A property-management company in the area should have these aggregated.
- How much new apartment / multifamily construction is in the pipeline within 1–3 miles? Heavy new supply (>2% of stock underway) typically softens rents 12–24 months out; light construction supports rent growth.
Investment metrics
- 1% rule
- 1.24% ✓
- Cap rate
- 5.49%
- Cash-on-cash
- -2.88%
- DSCR
- 0.87
- GRM
- 6.7
CMA / ARV
No comps found within radius.
Projected returns pro-forma
-3.0% appreciation · 2.82% rent growth · sell at horizon
- IRR
- -21.1%
- Equity multiple
- 0.27×
- Total profit
- $-24,139
- Equity at exit
- $17,579
- IRR
- -14.5%
- Equity multiple
- 0.17×
- Total profit
- $-27,466
- Equity at exit
- $10,194
Cash invested: $33,012 (down + closing). Projections, not guarantees.
Landlord ↔ Tenant lean methodology
- Overall (STATE)
- 87 Strongly Landlord-Friendly
- State Florida
- 87 Strongly Landlord-Friendly · R+3
- County
- — inherits STATE
- City
- — inherits STATE
ZIP-level market 32724
- Rents YoY
- 2.8%
- Active inventory
- 662
- Price-to-rent
- 6.7×
Monthly cashflow live
- Estimated rent
- $1,462 high interval (Pro) →
- Mortgage (P&I)
- −$618
- Tax from tax record
- −$43 /mo · $518/yr
- Insurance
- −$49
- HOA
- −$524
- Vacancy / Maint / Mgmt
- −$307
- Net cashflow
- $-79
Break-even live
UW: 25.0% down · 7.5% · 30yr · 1.5% tax · 5.0% vac · 8.0% maint · 8.0% mgmt
Financing live
Cash to close
- Down payment
- $29,475
- Closing costs
- $3,537
- Reserves months
- —
- Total cash needed
- —
Loan-product check · same deal, 3 products live
Conventional
25% down · 7.5% · 30yr
- Down + closing
- —
- Monthly P&I
- —
- Monthly cashflow
- —
- DSCR
- —
- Eligible?
- —
Personal DTI + credit; lowest rate.
DSCR
20% down · 8.5% · 30yr
- Down + closing
- —
- Monthly P&I
- —
- Monthly cashflow
- —
- DSCR
- —
- Eligible?
- —
No personal income docs; deal must DSCR.
Hard money
10% down · 12.0% · 12mo
- Down + closing
- —
- Monthly P&I
- —
- Monthly cashflow
- —
- DSCR
- —
- Eligible?
- —
Short-term bridge; refi at stabilization.
Rent comps 13 comps
| Address | Beds | Baths | Sqft | Rent | $/sqft | DOM | Units | Dist |
|---|---|---|---|---|---|---|---|---|
| 100 E Kentucky Ave Deland, FL | 2.0 | 2.0 | 955 | $1,322 | $1.38 | 21d | 2 | 0.04mi |
| 301 Arrow Wood Trl DeLand, FL | 1.0 | 1.0 | 634 | $1,104 | $1.74 | 23d | 1 | 0.35mi |
| 250 W International Speedway Blvd Deland, FL | 1.0–2.0 | 1.0 | 644 | $1,234 | $1.91 | 23d | 1 | 0.43mi |
| 830 N Clake Ave Apt 1 DeLand, FL | 2.0 | 2.0 | 900 | $1,500 | $1.67 | 23d | 1 | 0.47mi |
| 735 N Clara Ave Deland, FL | 2.0 | 1.0 | 900 | $1,700 | $1.89 | 23d | 1 | 0.67mi |
| 135 W Minnesota Ave #8 Deland, FL | 1.0 | 1.0 | 825 | $1,400 | $1.70 | 23d | 1 | 0.93mi |
| 641 N Orange Ave Unit 643 DeLand, FL | 2.0 | 1.0 | 1100 | $1,650 | $1.50 | 23d | 1 | 0.98mi |
| 12 S University Cir Deland, FL | 2.0 | 2.0 | 1105 | $1,775 | $1.61 | 23d | 1 | 0.99mi |
| 255 Tupelo Honey Cir Deland, FL | 1.0–4.0 | 1.0–3.0 | 1516 | $2,200 | $1.45 | 4d | 4 | 1.08mi |
| 501 W Ohio Ave Unit 19 DeLand, FL | 1.0 | 1.0 | 575 | $1,095 | $1.90 | 14d | 1 | 1.23mi |
| 501 W Ohio Ave Deland, FL | 1.0 | 1.0 | 575 | $1,095 | $1.90 | 14d | 1 | 1.23mi |
| 501 W Ohio Ave Unit L501WO19 DeLand, FL | 1.0 | 1.0 | 575 | $1,095 | $1.90 | 23d | 1 | 1.23mi |
| 202 Luella Ct Apt 3 DeLand, FL | 1.0 | 1.0 | 610 | $1,250 | $2.05 | 14d | 1 | 1.26mi |
HOA detail condo
- Monthly dues
- $524 · $6,288/yr
- Assessments
- None detected in remarks — confirm with the listing agent.
Listing history 11 events
-
2026-04-01historical $1,490
-
2026-04-01status Pending
-
2026-03-28$117,900 Active
-
2026-03-08price $1,490
-
2026-01-20$1,600
-
2016-12-19soldstatus $62,500 Sold 203-char remark
Show marketing remark (203 chars)
END UNIT ON 1ST FLOOR CLOSE TO PARKING. GLASSED IN FLORIDA ROOM WITH SLIDING DOOR FROM GREAT ROOM. WASHER AND DRYER IN STORAGE ROOM OFF OF FLORIDA ROOM. UPDATED KITCHEN AND BATHS. TILE FLOORS THROUGHOUT.
-
2016-11-01status Pending 203-char remark
Show marketing remark (203 chars)
END UNIT ON 1ST FLOOR CLOSE TO PARKING. GLASSED IN FLORIDA ROOM WITH SLIDING DOOR FROM GREAT ROOM. WASHER AND DRYER IN STORAGE ROOM OFF OF FLORIDA ROOM. UPDATED KITCHEN AND BATHS. TILE FLOORS THROUGHOUT.
-
2016-11-01$62,500 Active 203-char remark
Show marketing remark (203 chars)
END UNIT ON 1ST FLOOR CLOSE TO PARKING. GLASSED IN FLORIDA ROOM WITH SLIDING DOOR FROM GREAT ROOM. WASHER AND DRYER IN STORAGE ROOM OFF OF FLORIDA ROOM. UPDATED KITCHEN AND BATHS. TILE FLOORS THROUGHOUT.
-
1992-06-01soldstatus $25,000
-
1981-03-01soldstatus $36,300
-
1975-10-01soldstatus $31,700
ⓘ Source: listings_history table (triggers on properties + properties_extension) + one-shot
backfill from property_details.listing_events for pre-trigger history.
Tax reassessment forecast FL · Resets to sale price
- Current annual tax
- $518 · $43/mo
- Projected year-2 tax
- $979 · $82/mo
- Expected delta
- +$461/yr (+$38/mo · 89.0%)
ⓘ Screening estimate from a state-policy table — verify with the county assessor before closing.
Climate risk First Street
- Flood 1/10 Low FEMA zone X (unshaded) · 0% chance over 30 yrs
- Wildfire 2/10 Low
- Heat 9/10 Extreme 7 d/yr ≥107°F today · 20 d/yr by 30 yrs out
- Wind 9/10 Extreme 99% chance of damaging wind over 30 yrs
- Air quality 2/10 Low 1 unhealthy d/yr today · 1 by 30 yrs out
Nearby sold comps map
Loading sold comps map…
Walkable amenities ~0.75 mi
Loading nearby amenities…
Taxation est. · year 1
- Rental income
- $17,548
- − Mortgage interest
- −$6,604
- − Property taxes
- −$518
- − Insurance
- −$590
- − Repairs & maintenance
- −$1,404
- − Management
- −$1,404
- − HOA
- −$6,288
- − Depreciation
- −$3,430
- Taxable loss
- −$2,689
- Est. tax savings @ 24.0%
- +$645
- After-tax cash flow
- $-306/yr
For passive investors: Depreciation is non-cash, so a rental often shows a tax loss while cash-flowing — sheltering income. Rental losses are passive: they offset passive income freely, and up to $25,000/yr can offset ordinary (W-2) income if you actively participate and your MAGI is under $100k (phasing out to $0 by $150k); unused losses carry forward. On sale, claimed depreciation is recaptured at up to 25%, and gains may owe capital-gains tax (a 1031 exchange can defer both). Figures are a year-1 estimate at your 24.0% rate — not tax advice; consult a CPA.
Schools (NCES district)
- District
- Volusia
- NCES district ID
- 1201920
- Math proficiency
- 44% ▼ -9.00%
- Reading proficiency
- 49% ▼ -3.00%
- Median HH income
- $42,946
- Composite
- 39.2/100
- National rank
- #4019
- State rank
- #47 of 73 in FL
Livability — DeLand
- Score
- 68/100
- State rank
- #498
- US rank
- #9197
Category grades
Schools grade is shown separately in the Schools card above.
Census & demographics
- Census place
- DeLand, FL
- County
- Volusia County · 556,871 people
- City population
- 81,399
- Metro
- Deltona-Daytona Beach-Ormond Beach, FL
- Population (ZIP)
- 45,140
- Household income
- $73,592
- Rent vs Own
- Severe rent burden
- 942.0
Population outlook (Volusia County) Hauer SSP2
- Today (2025)
- 572,749 people
- By 2030
- 598,695 · +4.5%
- By 2040
- 644,880 · +12.6%
- By 2050
- 681,451 · +19.0%
- By 2075
- 759,957 · +32.7%
- By 2100
- 778,902 · +36.0%
Race, ethnicity, and origin ACS 2023
- Neighborhood character
- Predominantly White (71%)
- Race & ethnicity
- White 71% Hispanic / Latino 19% Two or more races 9% Black 6% Asian 1%
- Hispanic origin (detail)
- Mexican 9% Puerto Rican 5%
- Common ancestry
- Romanian 2% Slovak 2% Lithuanian 2%
- Foreign-born
- 10% · Canada, Jamaica
- Languages at home
- 83% English-only · Spanish 14% Other Indo-European 1% French/Haitian/Cajun 1%
Political lean MEDSL · Volusia
- 2024 margin
- Strong R (+21.8) · D 38.7% · R 60.5%
- 2008→2024 swing
- -27.4pp toward R · 2008: 5.7pp · 2024: -21.8pp
- All cycles
- 2024: R+21.8 2020: R+14.1 2016: R+13.1 2012: R+1.2 2008: D+5.7
Not yet ingested
- Civics
- —
Market trends
- HPI YoY
- ▼ -215.80%
- Current HPI
- 297.1837
- Rent YoY
- ▲ 2.82%
- Metro
- Deltona-Daytona Beach-Ormond Beach, FL
- State GDP YoY
- ▲ 3.28%
- F500 in state
- 36
Industry mix (Fortune 500 HQ in FL)
| Industry | F500 HQs | Revenue |
|---|---|---|
| Industrial Technology | 2 | $29B |
|
||
| Insurance | 2 | $17B |
|
||
| Retail | 1 | $60B |
|
||
| Technology Distribution | 1 | $58B |
|
||
| Homebuilding | 1 | $35B |
|
||
| Technology Manufacturing | 1 | $35B |
|
||
Price history
-95.3% since first listed11 events — show timeline
- 2026-04-01 Rental Removed $1,490 STELLARMLS
- 2026-04-01 Pending — Stellar MLS as Distributed by MLS Grid
- 2026-03-28 Listed $117,900 Stellar MLS as Distributed by MLS Grid
- 2026-03-08 Price Changed $1,490 STELLARMLS
- 2026-01-20 Listed for Rent $1,600 STELLARMLS
- 2016-12-19 Sold (MLS) $62,500 Stellar MLS as Distributed by MLS Grid
- 2016-11-01 Pending — Stellar MLS as Distributed by MLS Grid
- 2016-11-01 Listed $62,500 Stellar MLS as Distributed by MLS Grid
- 1992-06-01 Sold (Public Records) $25,000 Public Records
- 1981-03-01 Sold (Public Records) $36,300 Public Records
- 1975-10-01 Sold (Public Records) $31,700 Public Records
Property tax history
+64.1%/yrLatest (2025): $518 · +0.9% YoY. Source: county tax records.
Cash-flow waterfall
monthlySold comps — $/sqft
last 12 mo · ≤1 miLoading sold comps…